. 2023 Nov 14:12:RP87081.
doi: 10.7554/eLife.87081.

Human skeletal muscle organoids model fetal myogenesis and sustain uncommitted PAX7 myogenic progenitors

Affiliations

Human skeletal muscle organoids model fetal myogenesis and sustain uncommitted PAX7 myogenic progenitors

Lampros Mavrommatis et al. Elife. .

Abstract

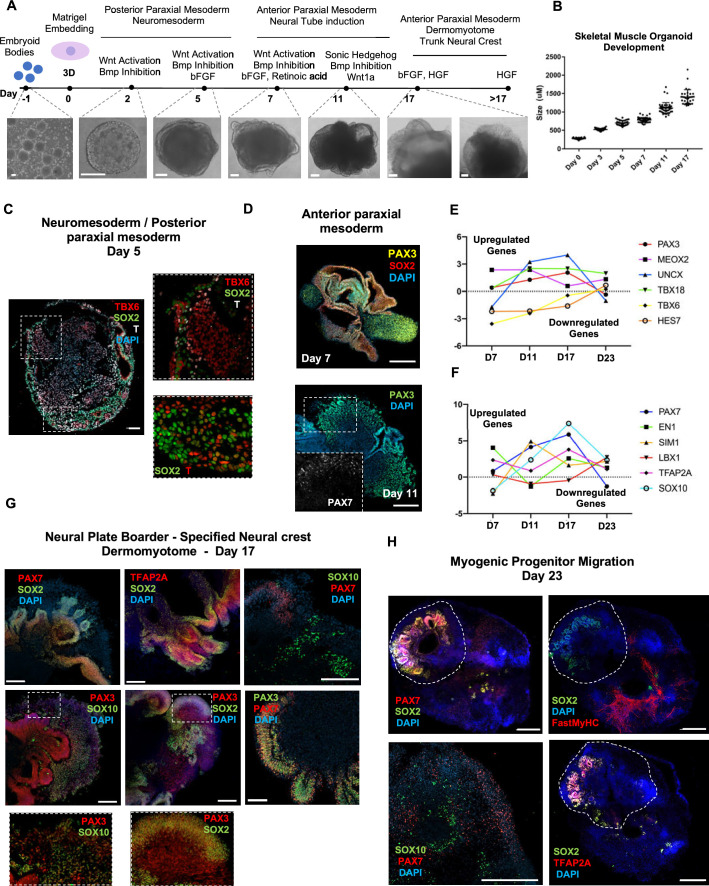
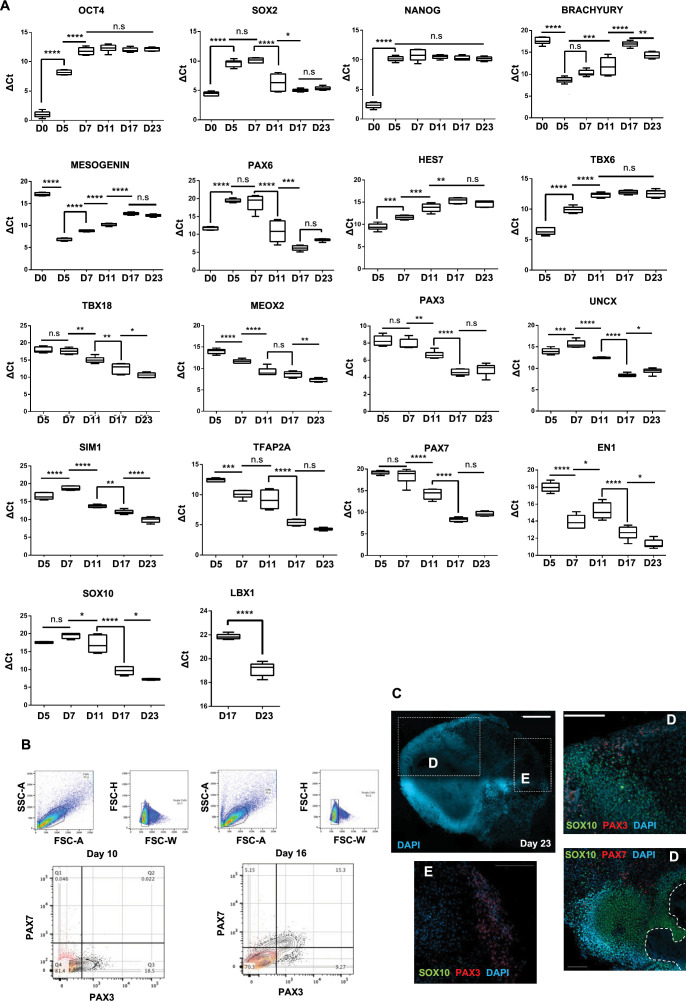
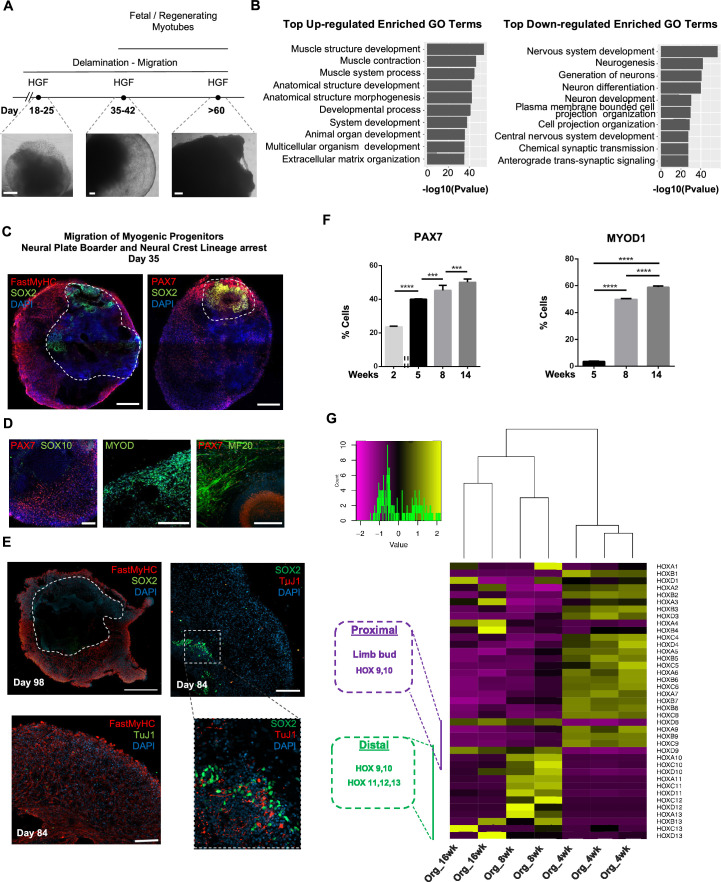
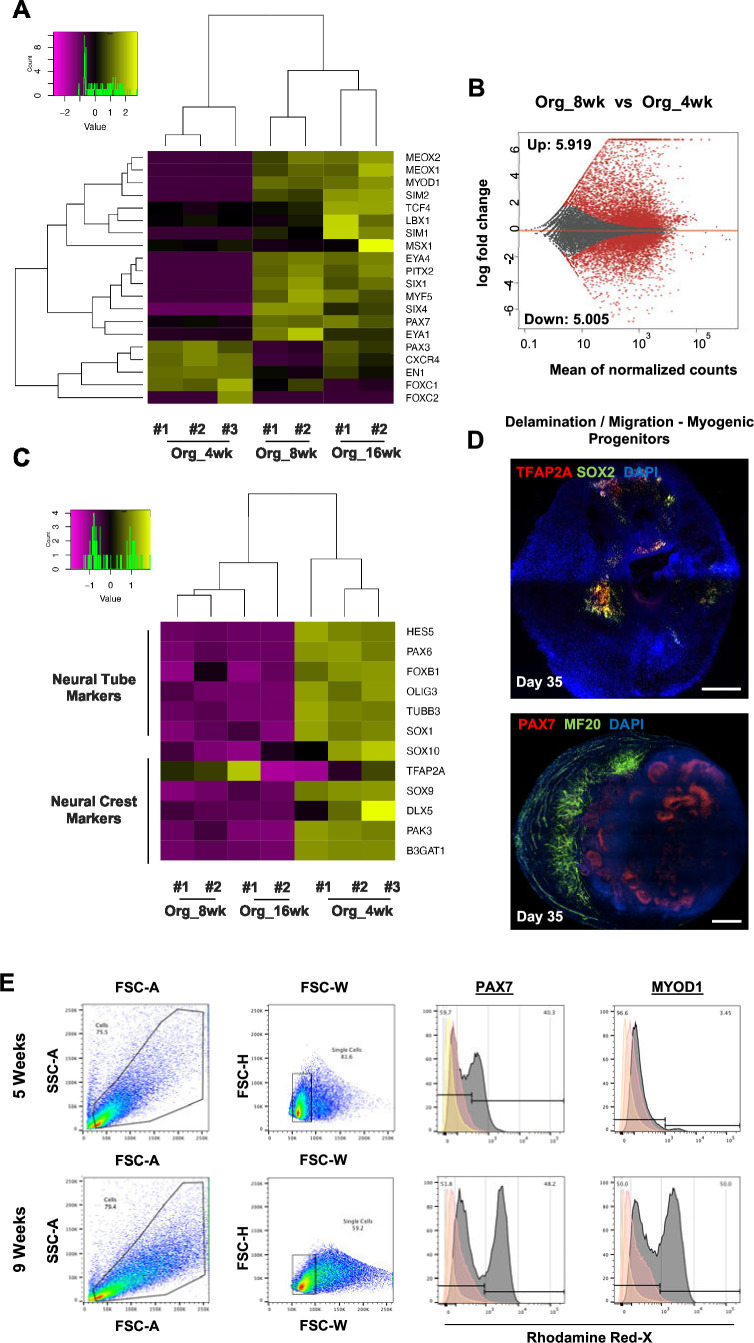
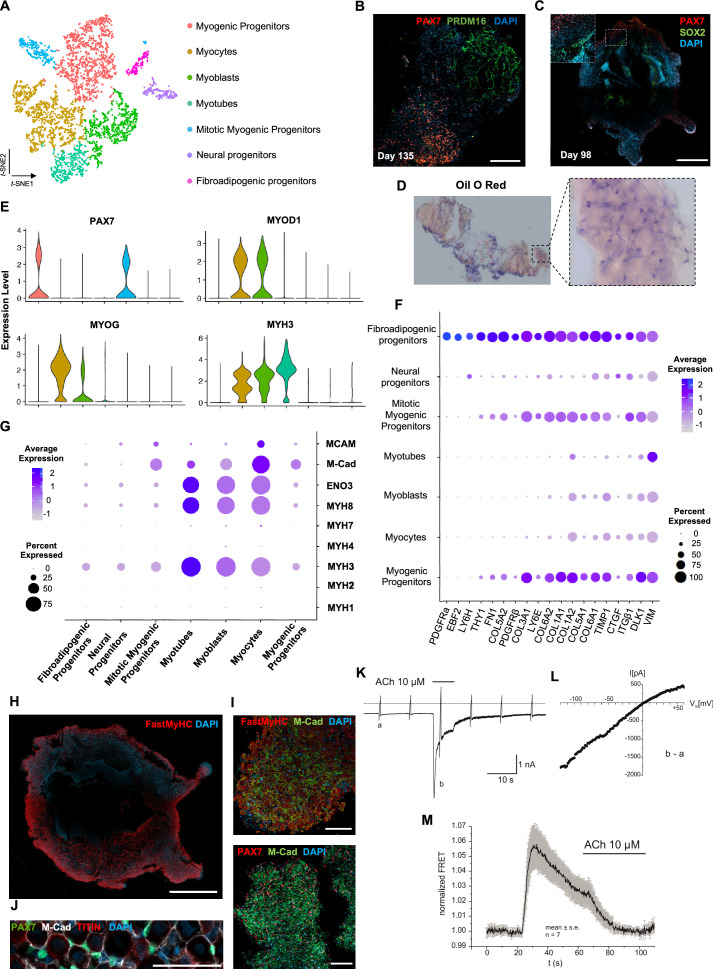
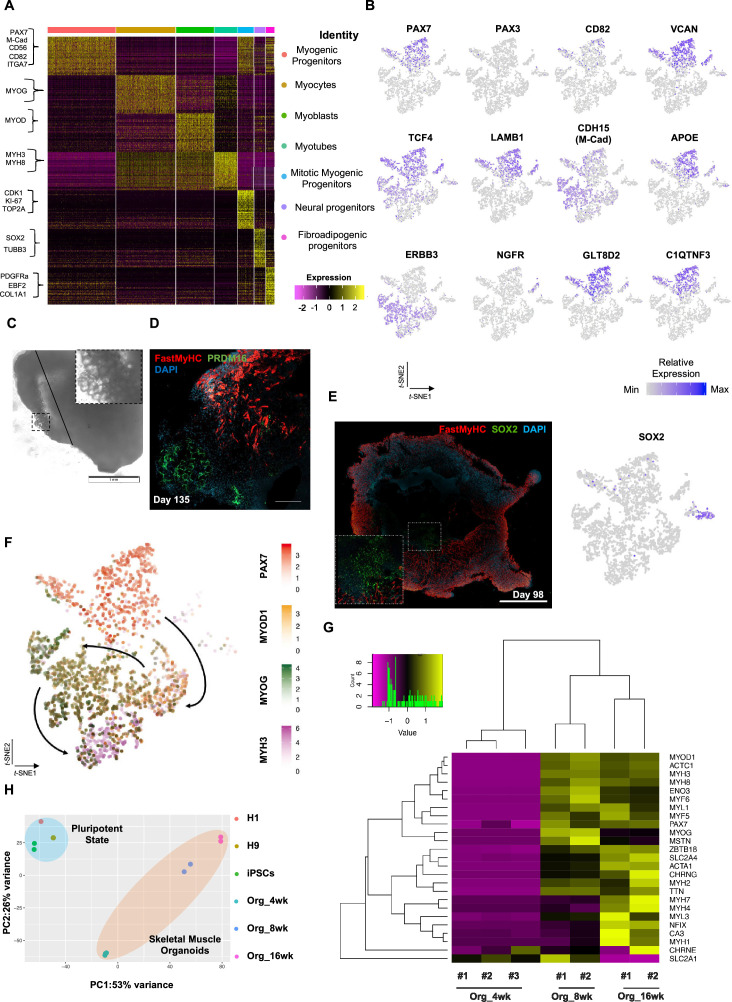
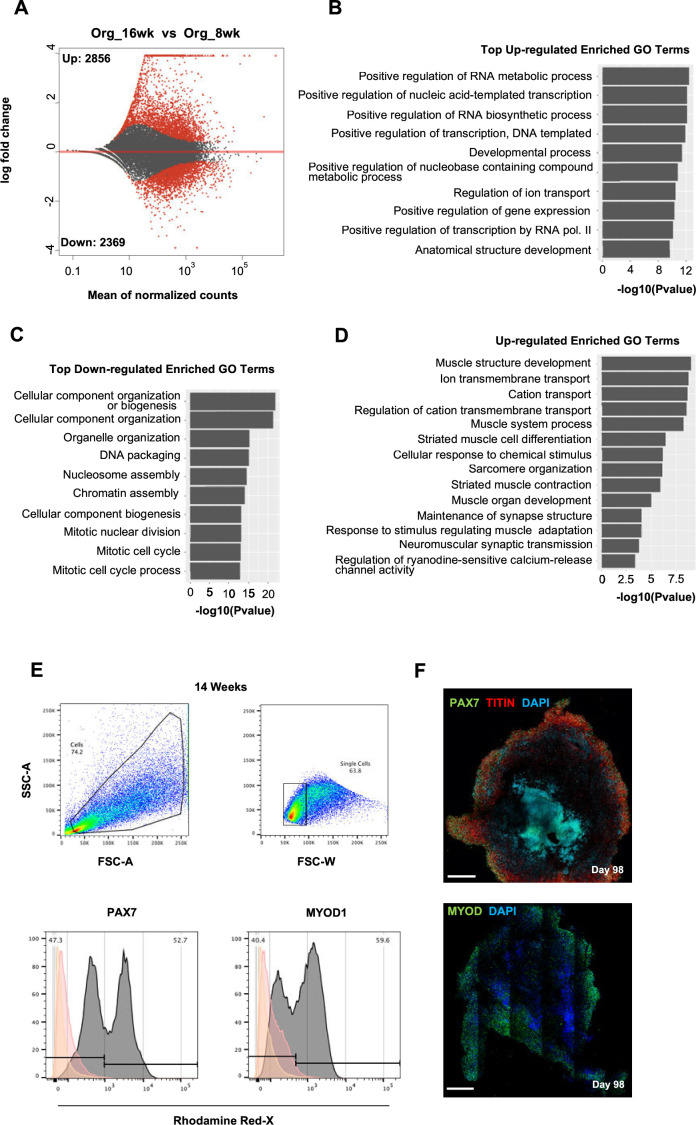
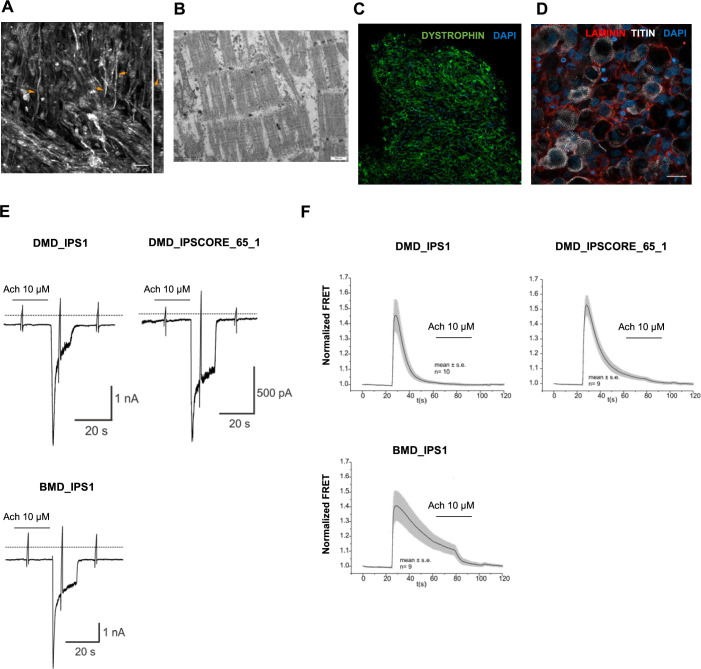
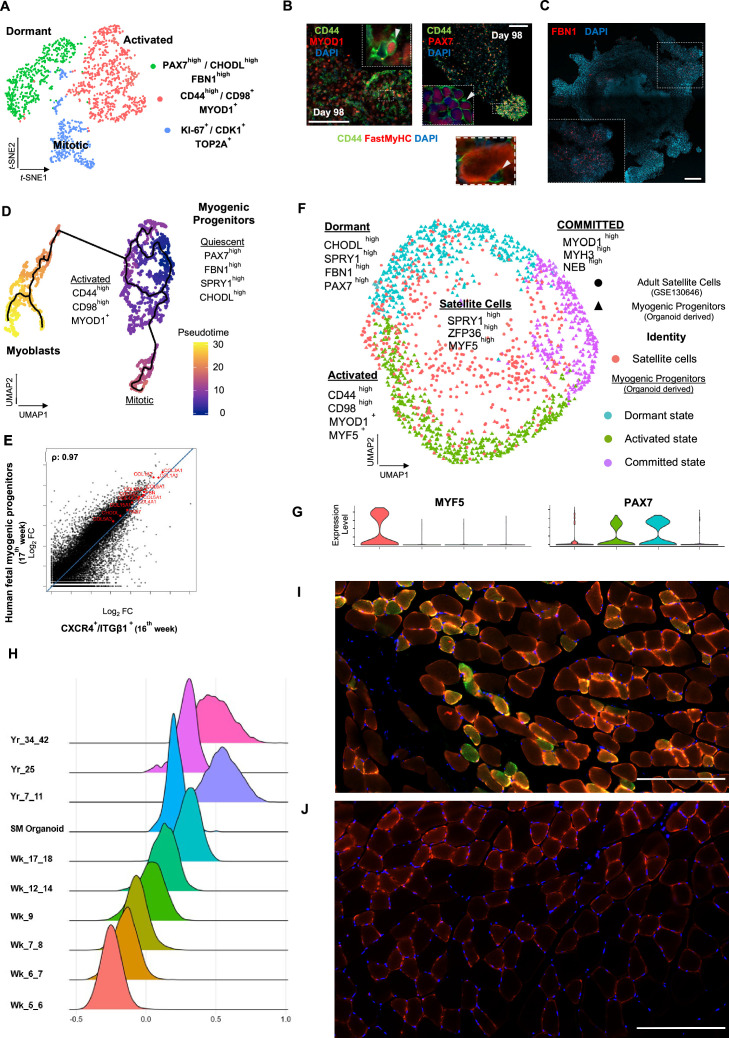
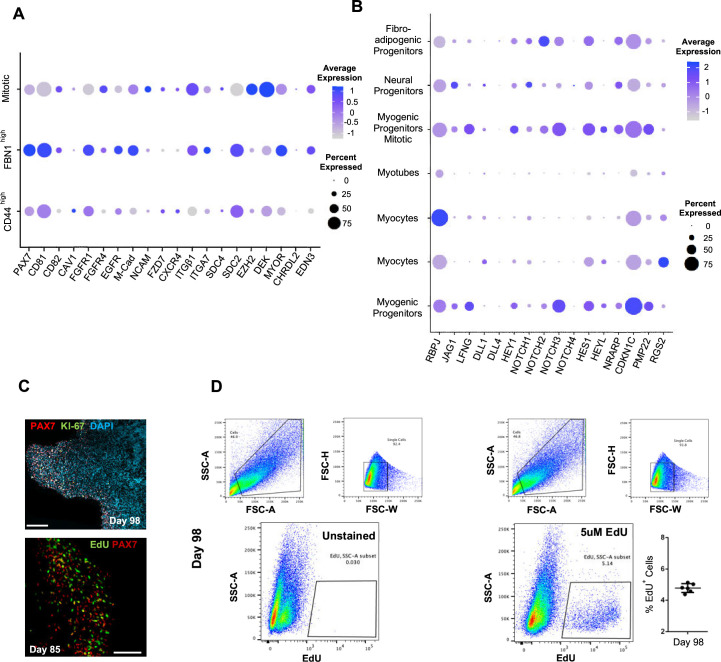
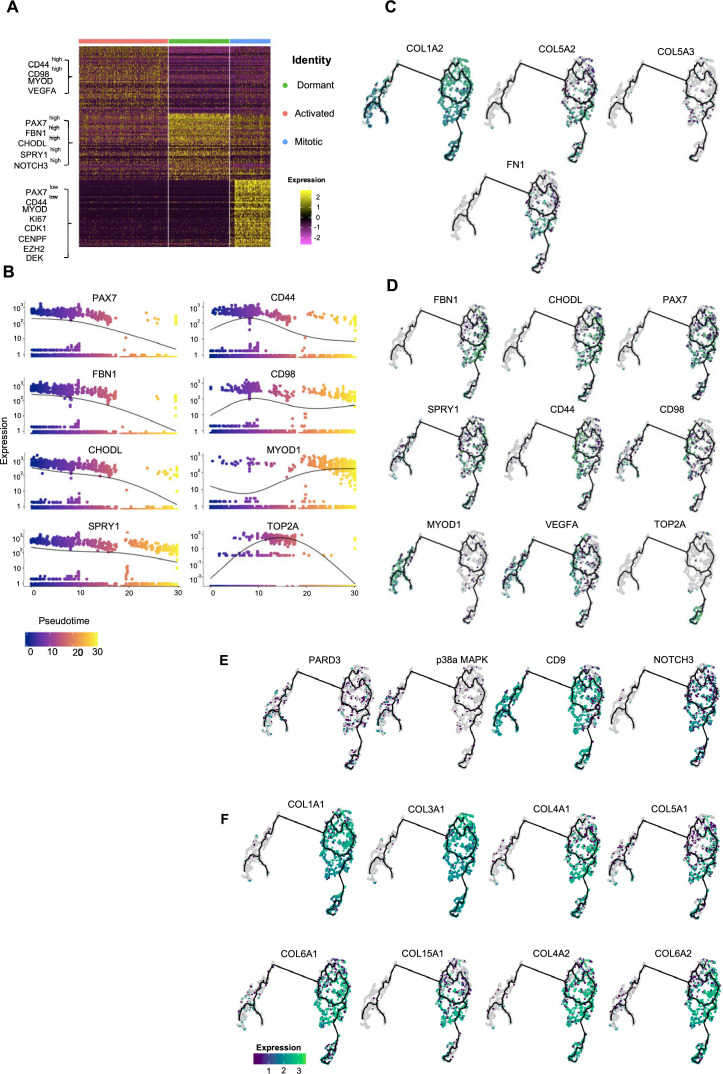
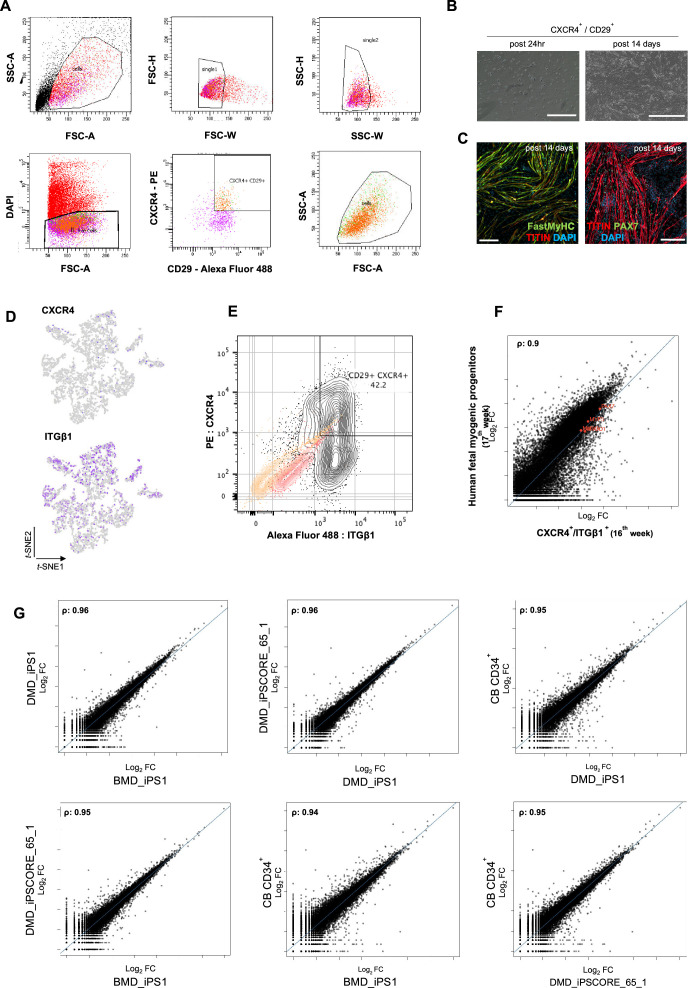
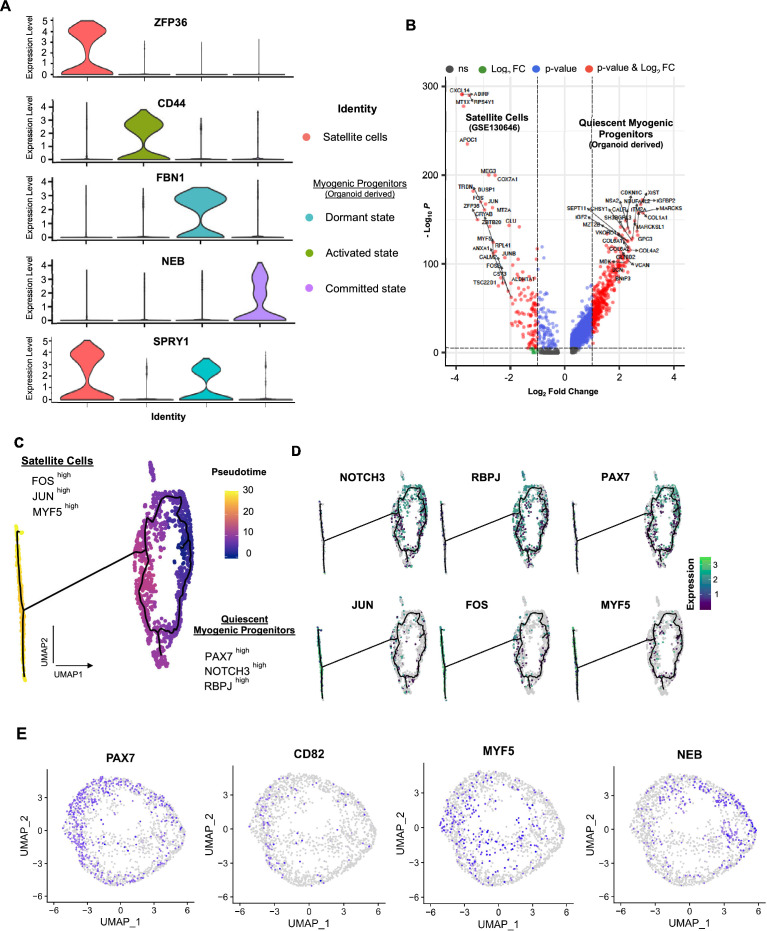
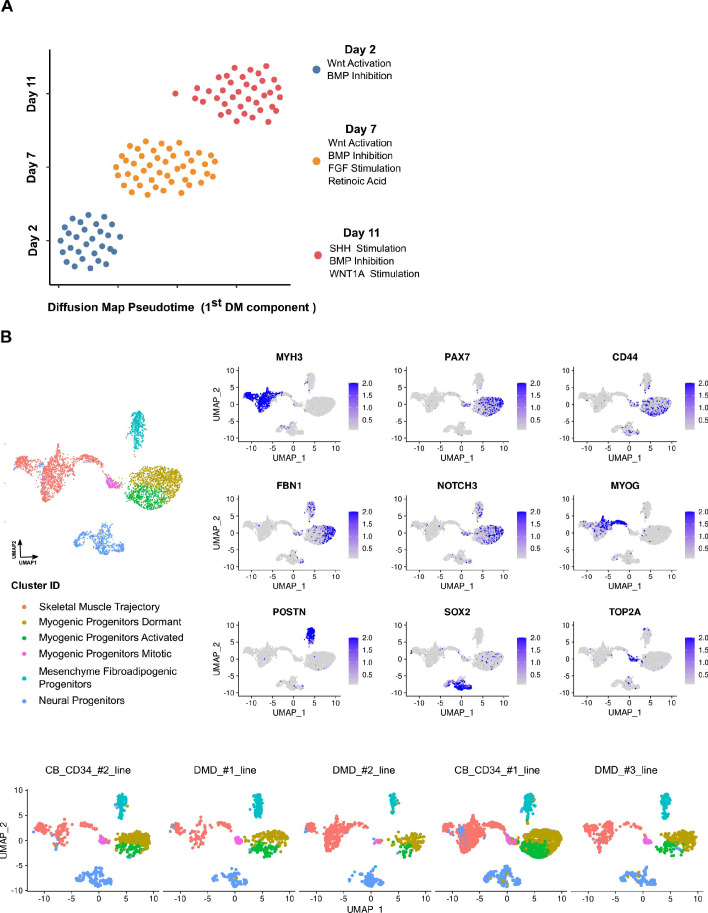
In vitro culture systems that structurally model human myogenesis and promote PAX7+ myogenic progenitor maturation have not been established. Here we report that human skeletal muscle organoids can be differentiated from induced pluripotent stem cell lines to contain paraxial mesoderm and neuromesodermal progenitors and develop into organized structures reassembling neural plate border and dermomyotome. Culture conditions instigate neural lineage arrest and promote fetal hypaxial myogenesis toward limb axial anatomical identity, with generation of sustainable uncommitted PAX7 myogenic progenitors and fibroadipogenic (PDGFRa+) progenitor populations equivalent to those from the second trimester of human gestation. Single-cell comparison to human fetal and adult myogenic progenitor /satellite cells reveals distinct molecular signatures for non-dividing myogenic progenitors in activated (CD44High/CD98+/MYOD1+) and dormant (PAX7High/FBN1High/SPRY1High) states. Our approach provides a robust 3D in vitro developmental system for investigating muscle tissue morphogenesis and homeostasis.

Keywords: Myogenesis; Organoids; Pax7; human; ips cells; regenerative medicine; satellite cells; skeletal muscle; stem cells.

Plain language summary

Humans contains around 650 skeletal muscles which allow the body to move around and maintain its posture. Skeletal muscles are made up of individual cells that bundle together into highly organized structures. If this group of muscles fail to develop correctly in the embryo and/or fetus, this can lead to muscular disorders that can make it painful and difficult to move. One way to better understand how skeletal muscles are formed, and how this process can go wrong, is to grow them in the laboratory. This can be achieved using induced pluripotent stem cells (iPSCs), human adult cells that have been ‘reprogrammed’ to behave like cells in the embryo that can develop in to almost any cell in the body. The iPSCs can then be converted into specific cell types in the laboratory, including the cells that make up skeletal muscle. Here, Mavrommatis et al. created a protocol for developing iPSCs into three-dimensional organoids which resemble how cells of the skeletal muscle look and arrange themselves in the fetus. To form the skeletal muscle organoid, Mavrommatis et al. treated iPSCs that were growing in a three-dimensional environment with various factors that are found early on in development. This caused the iPSCs to organize themselves in to embryonic and fetal structures that will eventually give rise to the parts of the body that contain skeletal muscle, such as the limbs. Within the organoid were cells that produced Pax7, a protein commonly found in myogenic progenitors that specifically mature into skeletal muscle cells in the fetus. Pax 7 is also present in ‘satellite cells’ that help to regrow damaged skeletal muscle in adults. Indeed, Mavrommatis et al. found that the myogenic progenitors produced by the organoid were able to regenerate muscle when transplanted in to adult mice. These findings suggest that this organoid protocol can generate cells that will give rise to skeletal muscle. In the future, these lab-grown progenitors could potentially be created from cells isolated from patients and used to repair muscle injuries. The organoid model could also provide new insights in to how skeletal muscles develop in the fetus, and how genetic mutations linked with muscular disorders disrupt this process.


Conflict of interest statement

LM, HJ, UK, GG, MK, MS, OP, DZ, MB, DH, GM, DG, JK, MA, JS, SH, RA, HS, MV, BB, HZ No competing interests declared, JY is partially employed by Next & Bio Inc

Figures

Figure 1.
Figure 1.. Skeletal muscle organoid protocol and correlation to fetal development.
(A) Brightfield images of myogenic development stages, with corresponding cytokines/growth factors protocol applications. (B) Graph depicting organoid development in size (day 0, n = 51; day 3, n = 46; day 5, n = 48; day 7, n = 50; day 11, n = 50; day 17, n = 33; for each timepoint organoids from three independent derivations were measured). (C) Representative mesodermal T+, neuromesodermal T+, SOX2+, and paraxial mesodermal TBX6+ organoid expression (in live DAPI- cells) on day 5. (D) Representative organoid PAX3+, mesodermal SOX2-, and neural SOX2+ expression on day 7; PAX3/PAX7 coexpression on day 11. (E) Graph depicting qPCR values for anterior PAX3/UNCX/MEOX2/TBX18 and posterior TBX6/HES7 somitic mesodermal markers. (F) Graph depicting qPCR values for epaxial and hypaxial dermomyotomal PAX7/EN1/SIM1/LBX1 and neural crest TFAP2A/SOX10 markers. (G) Representative organoid neural plate border epithelial PAX3+/PAX7+/SOX2+/TFAP2A+, paraxial mesodermal PAX3+/SOX2-, and delaminating specified neural crest progenitor PAX3+/SOX10+ expression on day 17. (H) Representative organoid myogenic FastMyHC+, PAX7+, and neural SOX2+/TFAP2A+/SOX10+ expression on day 23. Dashed line represents the location of embryoid body embedded into Matrigel. Statistics: values at each timepoint represent the difference in mean relative expression for each gene (D7 = day 5–day 7, D11 = day 7–day 11, D17 = day 11–day 17, D23 = day 17–day 23) as derived by performing ordinary one-way ANOVA and Tukey’´s multiple-comparison tests (E, F). Scale bars: 200 μm (G), 100 μm (A, D, H), 50 μm.
Figure 1—figure supplement 1.
Figure 1—figure supplement 1.. Lineage representation and organoid culture progression at early stages of differentiation protocol.
(A) qPCR analysis depicts relative expression of pluripotent (OCT4, SOX2, NANOG), mesodermal/posterior somitic (BRACHYURY, MESOGENIN, TBX6, HES7), anterior somitic (PAX3, UNCX, TBX18, MEOX2), dermomyotomal (PAX7, SIM1, EN1, LBX1), and neural tube/crest markers (SOX2, PAX6, TFAP2A, SOX10). (B) Gating strategies and FACS intracellular quantification of PAX3 and PAX7 markers on days 10 and 16. (C) Tile scan overview on day 23 shows neural crest SOX10+ populations close to neural plate border epithelium (D) and SOX10-/PAX3+ populations at more outer locations (E). For each replicate, six organoids were pooled; gene expression was normalized to housekeeping gene. Statistics: *p<0.05, **p<0.01, ***p<0.001, ****p<0.0001, ns: not significant. FACS plots, yellow: unstained population; red: isotype control; gray: PAX7+ or PAX3+ population. Scale bars, 500 uM (C), 200 uM (D, E).
Figure 2.
Figure 2.. Neural lineage development during skeletal muscle organoid progression.
(A) Stepwise brightfield images depicting delamination/migration of progenitor population during organoid culture progression and corresponding myofiber formation. (B) Gene ontology enrichment analysis comparing 4 and 8 wk organoids attributes muscle identity at 8 wk post differentiation and highlights muscle system development and neural lineage arrest among the top upregulated and downregulated gene ontology terms, respectively. (C–E) Organoid overview on day 35 indicates predominant expression of FastMyHC+ and PAX7+ myogenic populations, while SOX2+ neural populations demarcate SOX2 neural plate border epithelium location as observed at earlier stages (day 16) (C); PAX7 cells are of myogenic origin (PAX7+/SOX10-), MF20+ myotubes are in their proximity and MYOD1+ cells appear at organoid periphery (D); TUJ1+ neurons are restricted to inner organoid areas and close to SOX2+ epithelium, while FastMyHC+ myofibers occupy exterior organoid areas (E). (F) Histographs based on FACS intracellular quantification depicting percentage of PAX7+ or MYOD1+ cells through differentiation protocol. For each replicate, 10 organoids were pooled, n = 10. Statistics: *p<0.05, **p<0.01, ***p<0.001, ****p<0.0001, ns: not significant. (G) Heatmap of HOX gene cluster emphasizes organoid culture limb axial anatomical identity by depicting transition from an initial limb bud (HOX 9–10) toward a more distal identity (HOX 11–13) at 8 and 16 wk post differentiation, respectively. Scale bars, 500 μm (C), 200 μm (A, D, E).
Figure 2—figure supplement 1.
Figure 2—figure supplement 1.. Myogenic versus neural fate during organoid development.
(A) Heatmap of limb myogenic progenitor markers emphasizes upregulation through organoid protocol development. (B) Differential expression comparison highlights upregulated (n = 5919) and downregulated (n = 5005) genes between 8 vs. 4 wk organoids (Padj<0.001). (C) Heatmap of neural tube and neural crest markers during 4, 8, and 16 wk post differentiation highlights neural lineage arrest from 4 wk onward. (D) Organoid overview on day 35 indicates the presence of MF20+ myofibers in proximity of PAX7+ cells and delamination migration of mainly myogenic cells. SOX2 and TFAP2A expression is restricted toward inner organoid areas. (E) Gating strategy applied to quantify MYOD1+ (committed state) and PAX7+ (progenitor state) populations at 5 and 8 wk post differentiation. Yellow histogram: unstained population; red: isotype control; gray: PAX7+ or MYOD+ population. Scale bars, 500 uM.
Figure 3.
Figure 3.. Skeletal muscle organoid characterization at single-cell resolution.
(A) t-SNE visualization of color-coded clustering (n = 4323 cells) at 12 wk post differentiation highlights the predominant presence of skeletal muscle lineage, represented by clusters corresponding to myogenic progenitors (n = 1625 cells, 37% of total population) in non-dividing (n = 1317 cells) and mitotic (n = 308 cells) state, myoblasts (n = 731 cells), myocytes (n = 1147 cells), and myotubes (n = 442). Additionally, mesenchymal and neural lineages are represented by two smaller clusters of fibroadipogenic (n = 165 cells) and neural (n = 213 cells) progenitors, respectively. (B) Immunocytochemistry on day 135 indicates derivation of PRDM16+ adipocyte clusters distinct from PAX7+ myogenic progenitors. (C) Organoid overview on day 98 depicts expression of PAX7+ myogenic populations and highlights SOX2+ neural populations toward organoid interior. (D) Positive areas with Oil O Red staining indicate derivation of adipocytes in organoid culture on day 135. (E) Violin plots of key markers PAX7, MYOD1, MYOG, MYH3 from each stage as in (A) depict relative expression levels and emphasize gradual transition from myogenic progenitor to myotube subcluster. (F) Dot plot showing expression of representative genes related to adipogenesis and fibrogenesis across the seven main clusters. Circle area represents the percentage of gene+ cells in a cluster, color reflects average expression level (gray, low expression; blue, high expression). (G) Dot plot showing expression of representative genes related to fetal myogenesis across the seven main clusters. Circle area represents the percentage of gene+ cells in a cluster, color reflects average expression level (gray, low expression; blue, high expression). (H–J) Representative organoid overview on day 98 indicates predominant expression of Fast MyHC fetal myofibers (H, J), positive for M-Cadherin and in PAX7+ cells proximity (I, J). (K) Representative recording (n = 6) of acetylcholine (ACh)-induced changes in holding current in a single skeletal muscle cell. ACh (10 μM) was applied as indicated by the bar. Holding potential –90 mV. Downward deflections represent membrane currents in response to depolarizing voltage ramps (duration 500 ms) from –120 mV to +60 mV. Dashed line indicates zero current level. (L) I/V curve of nAChR currents obtained by subtraction of voltage ramp-induced changes of current in the presence and absence of ACh (10–5 mol/l), corresponding lowercase letters b – a. (M) Summarized FRET recordings from skeletal muscle cells transfected with Twitch2B to monitor the increase in [Ca2+]i during ACh application (h). Scale bars, 1 mm (C, H), 200 μm (B), 100 μm (I, J).
Figure 3—figure supplement 1.
Figure 3—figure supplement 1.. Single-cell RNA-seq expression profiling and lineage representation in organoid culture at week 12.
(A) Gene signatures of t-SNE-described clusters based on relative expression levels of the 50 most significant markers for each of the seven clusters. (B) t-SNE plot of myogenic and fibroadipogenic markers. (C) Brightfield image on day 135 highlights the presence of structures reassembling adipocytes. (D) Immunocytochemistry on day 135 emphasizing derivation of PRDM16+ cells in FastMyHC+ myofibers proximity. (E) Organoid overview on day 98 highlights muscle system development at outer and neural lineage representation at more inner sites. (F) t-SNE plot of key markers PAX7, MYOD1, MYOG, MYH3 from each stage depicts relative expression levels and emphasizes gradual transition from myogenic progenitor to myotube subcluster. (G) Heatmap of embryonic or fetal myogenic markers depicts a fetal environment during 8–16 wk post differentiation. (H) Two-dimensional principal component analysis based on gene expression profiling between samples separates skeletal muscle organoid cluster from pluripotent and highlights greater difference in variance between 4 and 8–16 wk subgroups in comparison to 8 and 16 wk subgroups. w.p.d.: weeks post differentiation. Scale bars, 1 mM (D), 200 uM (E, F).
Figure 3—figure supplement 2.
Figure 3—figure supplement 2.. Skeletal muscle organoid culture maturation and identity.
(A) Differential expression comparison highlights upregulated (n = 2856) and downregulated (n = 2369) genes between 16 and 8 wk organoids (Padj<0.001). (B, C) Gene ontology (GO) enrichment analysis at 16 wk depicting top statistically significant upregulated (B) and downregulated (C) GO terms; (D) statistically significant upregulated GO terms further highlights skeletal muscle maturation. (E) Gating strategy applied to quantify MYOD1+ (committed state) and PAX7+ (progenitor state) population at 14 wk post differentiation. (F) Organoid overview on day 98 depicts the high proportion of PAX7+/MYOD+ cells toward outer areas. Yellow histogram: unstained population; red histogram: isotype control; gray histogram: PAX7+ or MYOD+ population. Scale bars, 500 uM (F).
Figure 3—figure supplement 3.
Figure 3—figure supplement 3.. Functional properties of organoid-derived skeletal muscle myofibers.
(A) Second harmonic generation imaging (SHG) from areas with dense fiber network reveals myofibril formation with distinct sarcomeres (z plane of stack right). (B) Electron microscopy depicts myofibrils with well-developed sarcomeres. (C, D) Skeletal muscle organoid-derived myofibers expressed LAMININ and DYSTROPHIN. (E) Representative recording of acetylcholine (Ach)-induced changes in holding current in a single skeletal muscle cell from organoid-derived skeletal muscle cells from induced pluripotent stem cell (iPSC) lines with Duchenne (DMD_IPS1, DMD_IPSCORE_65_1) and Becker (BMD_IPS1) muscular dystrophy patients. ACh (10 μM) was applied as indicated by the bar. Holding potential –90 mV. Downward deflections represent membrane currents in response to depolarizing voltage ramps (duration 500 ms) from –120 mV to +60 mV. Dashed line indicates zero current level. (F) Summarized FRET recordings from organoid-derived skeletal muscle cells from iPSC lines with Duchenne (DMD_IPS1, DMD_IPSCORE_65_1), Becker (BMD_IPS1) transfected with Twitch2B to monitor the increase in [Ca2+]i during ACh application. Scale bars, 100 uM (C, D), 20 uM in (A), 500 nM (B).
Figure 4.
Figure 4.. Myogenic progenitor identity and comparison to progenitors derived from fetal and adult muscle tissue.
(A) t-SNE plot visualization of color-coded clustering indicates myogenic progenitor subcluster with distinct molecular signatures: ‘dormant’ PAX7high/CHODLhigh/FBN1high, ‘activated’ CD44high/CD98+/MYOD1+, and ‘mitotic’ KI-67+/CDK1+/TOP2A. (B) Organoid overviews on day 98 illustrate CD44 and PAX7-expressing cells at developing sites, which are more accessible to HGF activation signal, specificity of CD44 on MYOD+/PAX7+ progenitor-expressing cells (arrows) and absence from FastMyHC+ positive myofibers is highlighted. (C) FBN1+ microfibrils are located toward organoid interior. (D) Pseudotime ordering for myogenic progenitors and myoblast corresponding clusters highlights distinct developmental trajectories promoting myogenic commitment and self-renewal. (E) Correlation coefficient plot for Log2 fold change (Log2 FC) values for isolated myogenic progenitors from human fetal tissue (17w) and FACS-sorted CXCR4+/ITGβ1+ organoid-derived myogenic progenitors (16w). PAX7, COL1A1, COL3A1, COL4A1, COL5A1, COL15A1, FBN1, and CHODL and further extracellular matrix-related genes are highlighted on the plot. Pearson’s correlation coefficient, rho = 0.9 for global expression comparison and rho = 0.97 for selected genes. (F) UMAP color-based clustering divides non-dividing myogenic progenitors and adult satellite cells into four clusters with distinct molecular signatures: satellite cells characterized by SPRY1high/ZFP36high/MYF5high expression, co-clustered with dormant SPRY1high/FBN1high/CHODLhigh/PAX7high, activated CD44high/CD98high/MYOD1+, and committed, NEB high/MYH3high/MYOD1high organoid-derived myogenic progenitors. Dots correspond to adult satellite cells from GSE130646 database, triangles correspond to organoid-derived myogenic progenitors. (G) Violin plots depicting relative expression levels of markers specific for quiescent PAX7 or activated MYF5 muscle stem cell state across adult satellite cells (GSE130646) and organoid-derived myogenic progenitors subclusters. (H) Ridge plots of developmental score distribution of myogenic progenitors across in vivo or in vitro stages based on the difference between upregulated satellite cell and embryonic markers from human reference atlases for weeks (Wk) 5–18 embryonic and fetal stages, years (Yr) 7–42 adult satellite cells and skeletal muscle (SM) organoid. (I, J) In vivo engraftment potential of human myogenic progenitors. 100.000 CD82+ sorted human cells were injected into Tibialis anterior muscle of nude mice. (I) Control mice were not injected (J). Six weeks post transplantation, transverse cryosections of muscle fibers were stained with huLamin A/C (green), dystrophin (red), and DAPI (blue). Human cells appear green and red in contrast to murine cells, which only show a dystrophin-positive red staining. Scale bars 200 μm in (I, J).
Figure 4—figure supplement 1.
Figure 4—figure supplement 1.. Subclustering of myogenic progenitors and NOTCH signaling.
(A) Dot plot showing expression of representative genes related to satellite cell identity across the seven main clusters. (B) Dot plot showing expression of representative genes related to NOTCH signaling, which are identified as regulators of satellite cell quiescence across the seven main clusters. (C) Organoid immunohistochemistry on day 98 indicates PAX7 myogenic progenitors that are Ki-67-/EdU-. (D) Gating strategy applied to quantify EdU+ proliferating cells in organoid culture on day 98 (14 wk); histograph depicting percentage of EdU+ cells; dot plot, circle area represents percentage of gene+ cells in a cluster, color reflects average expression level (gray, low expression; blue, high expression). Scale bars, 100 uM in (C).
Figure 4—figure supplement 2.
Figure 4—figure supplement 2.. Pseudotime ordering of myogenic progenitor revealing distinct states and cell fate decisions.
(A) Gene signatures of t-SNE described clusters based on relative expression levels of the 50 most significant markers for each of the three clusters. (B) Expression of selected genes along pseudotime. Group of genes selected for myogenic progenitors: PAX7, SPRY1, CHODL (dormant state), CD44, CD98, MYOD1 (activated state), TOP2A (mitotic state), and for myoblasts: MYOD1. (C, D) UMAP feature plots depicting relative expression of extracellular matrix proteins COL1A2, COL5A2, COL5A3, FN1 (C) and selected transcriptional regulators that define dormant (PAX7, FBN1, CHODL, SPRY1), activated (CD44, CD98, MYOD1, VEGFA), and mitotic (TOP2A) state of myogenic progenitor and myoblast (MYOD1) clusters (D). (E, F) UMAP feature plots depicting relative expression of genes regulating asymmetric divisions and self-renewal (PARD3, p38a/b, CD9, NOTCH3) (E) and extracellular matrix collagens (COL1A1, COL3A1, COL4A1, COL5A1, COL6A1, COL15A1, COL4A2, COL6A2) (F).
Figure 4—figure supplement 3.
Figure 4—figure supplement 3.. Organoid-derived myogenic progenitors and correlation to fetal muscle progenitors.
(A) Gating strategy applied for FACS sorting CD29+/CXCR4+ cells from 15 to 16 wk skeletal muscle organoids. (B, C) Re-plating CD29+/CXCR4+ cells and culturing for 14 d highlights fetal myogenic potential, illustrated by brightfield and immunocytochemistry images for Fast MyHC+, TITIN+, and PAX7+ populations. (D) t-SNE feature plots for ITGβ1 and CXCR4 demarcate expression of FACS isolated calls into myogenic progenitor subcluster. (E) Gating strategy from (A) together with unstained population (yellow), isotype control (red), and CD29+/CXCR4+ (gray) population. (F) Correlation coefficient plot for Log2 fold change (Log2 FC) values for isolated myogenic progenitors from human fetal tissue (17w) and FACS-sorted CXCR4+/ ITGβ1+ organoid-derived myogenic progenitors (16w). PAX7, MYF5, MYOD1, MYOG are highlighted on the plot. (G) Correlation coefficient plot for Log2 FC values for FACS-sorted CXCR4+/ ITGβ1+ organoid-derived myogenic progenitors (16w) from CB CD34+, DMD_IPS1, BMD_iPS1, and iPSCORE_65_1 pluripotent lines. Scale bars, 200 uM (B), 100 uM (C).
Figure 4—figure supplement 4.
Figure 4—figure supplement 4.. Organoid-derived myogenic progenitors and correlation to adult human satellite cells.
(A) Violin plots highlighting developmental status for organoid-derived myogenic progenitors and satellite cells through relative expression of key signature markers ZFP36, CD44, FBN1, NEB, and SPRY1 for each subcluster. (B) Enhanced volcano plot from comparing transcript levels between all adult satellite cells (GSE130646) and organoid-derived myogenic progenitors. Log2 fold-change in normalized gene expression vs. –Log10 adjusted p-value is plotted. Differentially expressed genes: blue, adjusted p-value<0.001; green, adjusted p-value>0.001 and log2 fold-change >1; red, log2 fold-change >1 and adjusted p-value <0.001; gray, no significance. (C) Pseudotime ordering for organoid-derived myogenic progenitors and adult satellite cells together with expression of selected genes. (D) Expression of genes selected for dormant myogenic progenitors (PAX7, NOTCH3, RBPJ) and activated satellite cells (MYF5, JUN, FOS). (E) UMAP feature plots depicting expression of PAX7, CD82+, MYF5, and NEB within the myogenic progenitor and adult satellite cell clusters corresponding to Figure 4F.
Figure 4—figure supplement 5.
Figure 4—figure supplement 5.. Characterization of cell–cell communication network for all clusters at week 12 of human skeletal muscle organoid development.
(A) Circle plot illustrates the aggregated cell–cell communication network for all clusters at week 12 of human skeletal muscle organoids development. Circle sizes are proportional to the number of cells in each cell group and edge width represents the communication probability. (B) Heatmap indicating signals contributing most to the outgoing or incoming signaling among activated, mitotic, dormant/specification-resistant myogenic progenitors and fibroadipogenic progenitors, neural progenitors and myofibers-related clusters at week 12 of human skeletal muscle organoid development.
Figure 4—figure supplement 6.
Figure 4—figure supplement 6.. Reproducibility of organoid culture at early and mature stages.
(A) Pseudotemporal ordering of organoids from days 2, 7, and 11 based on qPCR expression profiling of selected 32 genes indicates robust homogeneous development of organoids during WNT activation and BMP Inhibition, while the subsequent development of paraxial mesoderm and neural tube-related lineages via bFGF, retinoic acid (day 7) and WNT1a, hSHH (day 11) stimulation, introduced small variations to the organoid culture system. (B) Integrative analysis between datasets of organoids from different lines demonstrates highly conserved lineage representation for all datasets at mature stages (week 12) of human skeletal muscle organoid development. Feature plots on PAX7, CD44, FBN1, MYH3, POSTN, SOX2, as well as NOTCH3, MYOG, TOP2A indicate the presence of dormant, activated, and mitotic myogenic progenitors together with skeletal muscle myofibers, fibroadipogenic progenitors, and neural progenitors-related clusters.
Figure 4—figure supplement 7.
Figure 4—figure supplement 7.. Comparison between 2D in vitro myogenic differentiation protocols and in vivo staging.
Violin plots highlighting expression of key myogenesis markers: Comparison between myogenic progenitors derived in 2D differentiation protocols (HX protocol, Xi et al., 2017; JC protocol, Chal et al., 2015; MS protocol, Shelton et al., 2014) and in vivo myogenic progenitors (five stages: 1, 2: embryonic; 3, 4: fetal; 5: postnatal). Data were acquired from Pyle ´s LAB UCLA website (here) and Xi et al., 2020.
Author response image 1.
Author response image 2.
Author response image 3.

Update of

  • doi: 10.1101/2020.09.14.295832
  • doi: 10.7554/eLife.87081.1
  • doi: 10.7554/eLife.87081.2

Similar articles

Cited by

References

    1. Alexander MS, Rozkalne A, Colletta A, Spinazzola JM, Johnson S, Rahimov F, Meng H, Lawlor MW, Estrella E, Kunkel LM, Gussoni E. CD82 is a marker for prospective isolation of human muscle satellite cells and is linked to muscular dystrophies. Cell Stem Cell. 2016;19:800–807. doi: 10.1016/j.stem.2016.08.006. - DOI - PMC - PubMed
    1. Al Tanoury Z, Rao J, Tassy O, Gobert B, Gapon S, Garnier J-M, Wagner E, Hick A, Hall A, Gussoni E, Pourquié O. Differentiation of the human PAX7-positive myogenic precursors/satellite cell lineage in vitro. Development. 2020;147:dev187344. doi: 10.1242/dev.187344. - DOI - PMC - PubMed
    1. Angerer P, Haghverdi L, Büttner M, Theis FJ, Marr C, Buettner F. destiny: diffusion maps for large-scale single-cell data in R. Bioinformatics. 2016;32:1241–1243. doi: 10.1093/bioinformatics/btv715. - DOI - PubMed
    1. Aulehla A, Pourquié O. Signaling gradients during paraxial mesoderm development. Cold Spring Harbor Perspectives in Biology. 2010;2:a000869. doi: 10.1101/cshperspect.a000869. - DOI - PMC - PubMed
    1. Barbieri G, De Angelis L, Feo S, Cossu G, Giallongo A. Differential expression of muscle-specific enolase in embryonic and fetal myogenic cells during mouse development. Differentiation. 1990;45:179–184. doi: 10.1111/j.1432-0436.1990.tb00471.x. - DOI - PubMed

MeSH terms

Substances

Associated data

LinkOut - more resources