. 2023 Nov 14:12:RP87147.
doi: 10.7554/eLife.87147.

Missense mutations in CRX homeodomain cause dominant retinopathies through two distinct mechanisms

Affiliations

Missense mutations in CRX homeodomain cause dominant retinopathies through two distinct mechanisms

Yiqiao Zheng et al. Elife. .

Abstract

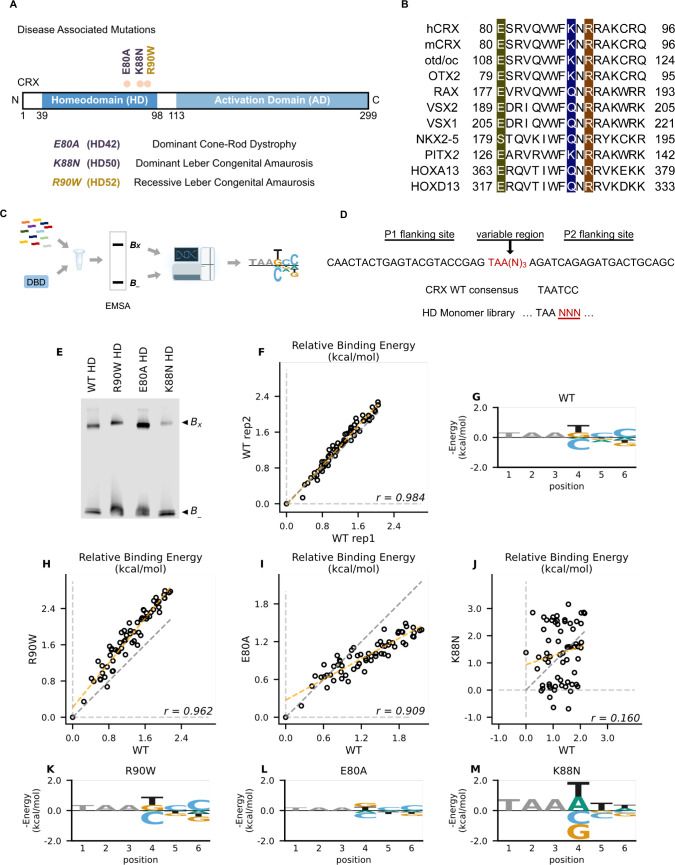
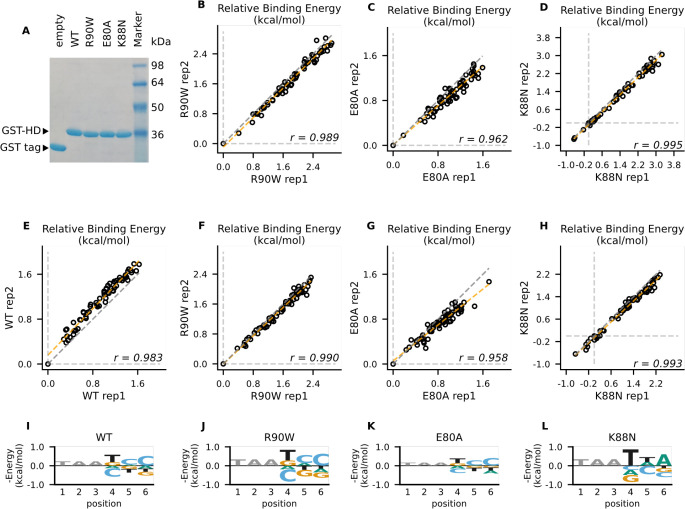
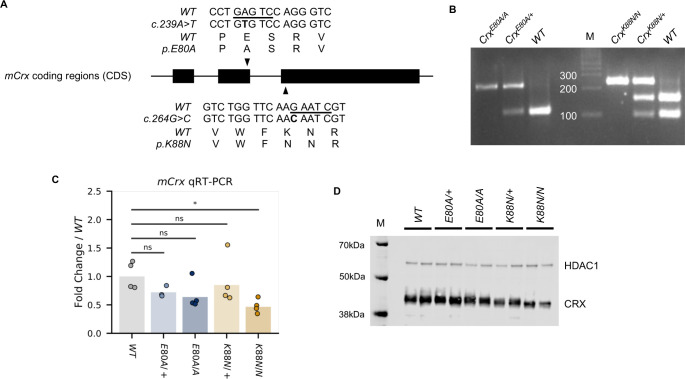
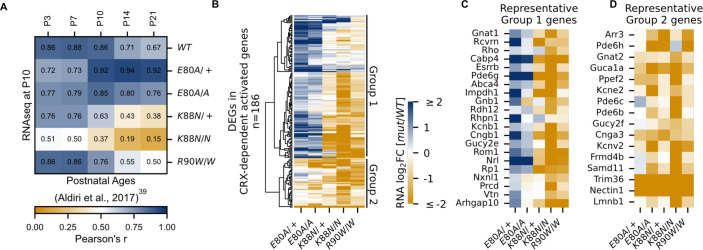
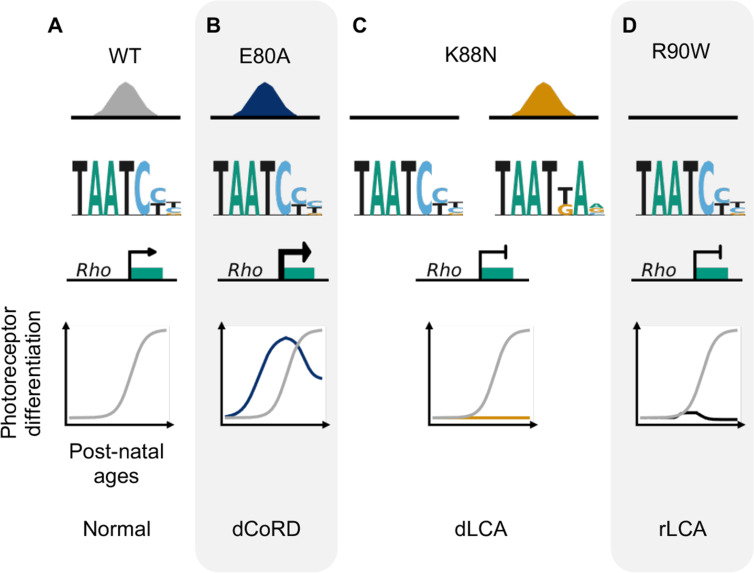
Homeodomain transcription factors (HD TFs) are instrumental to vertebrate development. Mutations in HD TFs have been linked to human diseases, but their pathogenic mechanisms remain elusive. Here, we use Cone-Rod Homeobox (CRX) as a model to decipher the disease-causing mechanisms of two HD mutations, p.E80A and p.K88N, that produce severe dominant retinopathies. Through integrated analysis of molecular and functional evidence in vitro and in knock-in mouse models, we uncover two novel gain-of-function mechanisms: p.E80A increases CRX-mediated transactivation of canonical CRX target genes in developing photoreceptors; p.K88N alters CRX DNA-binding specificity resulting in binding at ectopic sites and severe perturbation of CRX target gene expression. Both mechanisms produce novel retinal morphological defects and hinder photoreceptor maturation distinct from loss-of-function models. This study reveals the distinct roles of E80 and K88 residues in CRX HD regulatory functions and emphasizes the importance of transcriptional precision in normal development.

Keywords: CRX disease mutations; DNA-binding specificity; genetics; genomics; homeodomain; inherited retinal diseases; mouse; neuroscience; photoreceptor development; transcription factor.


Conflict of interest statement

YZ, CS, XZ, PR, SC No competing interests declared

Figures

Figure 1.
Figure 1.. Disease associated missense mutations altered CRX homeodomain (HD) DNA-binding specificity (legend on the next page).
(A) Diagram of CRX functional domains: HD for DNA-binding and activation domain (AD) for target gene transactivation. The three missense mutations in this study are located at the C-terminus of CRX HD and associated with different retinal diseases in human. Number in the parenthesis denotes the CRX HD position of the corresponding mutated residue. (B) Alignments of HD recognition helix sequences for the indicated HD proteins for which HD missense mutations have been associated with inherited diseases. Accession numbers can be found in Supplementary file 1a. Missense variants in this study (highlighted) are located at highly conserved residues across species and different HD transcription factors (TFs). (C) Spec-seq experimental workflow (Methods). (D) Spec-seq library design of monomeric HD-binding sites. (E) Electrophoretic mobility shift assay (EMSA) gel images of Spec-seq experiments with different CRX HD species. Bx: bound. B-: unbound. (F) Relative binding energy comparison from two different experiments with wild-type (WT) HD. (G) Binding energy model for WT CRX HD. Relative binding energy comparison between WT HD and R90W HD (H), E80A HD (I), or K88N HD (J). Consensus sequence is defined to have relative binding energy of 0kT (TAATCC for WT, R90W and E80A, TAATTA for K88N). The identity line is represented in gray dash. The orange dashed line shows the best linear fit to the data. Binding energy models for R90W HD (K), E80A HD (L), and K88N HD (M). Only sequence variants within two mismatches to the corresponding consensus sequences were used to generate binding models. Negative binding energy is plotted such that bases above the x-axis are preferred bases and bases below the x-axis are unfavorable bases. Constant bases (TAA) carried no information are drawn at arbitrary height in gray.
Figure 1—figure supplement 1.
Figure 1—figure supplement 1.. Multi-omics approach to investigate the functional consequences of dominant disease mutations on CRX regulatory activities and photoreceptor development.
Human retinopathy associated CRX homeodomain (HD) mutant is first tested in vitro for HD–DNA interactions by Spec-seq. Quantitative binding models are generated for wild-type (WT) and mutant HDs. Each mutation is then introduced into endogenous mCrx locus to generate human mutation knock-in mouse models. ChIP-seq is employed to characterize CRX chromatin binding in WT and mutant mouse retinas. Bulk RNA-seq is then applied to determine transcriptomic changes in developing (P10) and mature (P21) photoreceptors (PRs) in both WT and mutant mouse retinas. Last, phenotypic characterization on retinal morphology and visual functions is carried out to understand the consequences of mutant CRX chromatin binding and associated transcriptomic alterations.
Figure 1—figure supplement 2.
Figure 1—figure supplement 2.. Reversed-strand Spec-seq library showed similar changes in mutant CRX homeodomain (HD) DNA-binding specificity.
(A) Native sodium dodecyl sulfate–polyacrylamide gel electrophoresis (SDS–PAGE) gel image of affinity-purified empty GST tag and GST-CRX HDs. Relative binding energy comparison from two different experiments for R90W HD (B), E80A HD (C), and K88N HD (D) on the same Spec-seq library as in Figure 1. (E–L) Spec-seq experiments of a second library with the TAANNN sites on the reverse strand show similar results. Relative binding energy comparison from two different experiments for wild-type (WT) HD (E), R90W HD (F), E80A HD (G), and K88N HD (H) on the reversed monomeric library. The identity line is represented in gray dash. The orange dashed line shows the best linear fit to the data. Binding energy models for WT HD (I), R90W HD (J), E80A HD (K), and K88N HD (L) obtained from the reversed monomeric library. Quantitative difference with models obtained from forward-oriented library likely comes from difference in sequences immediately flanking the TAANNN variable region.
Figure 2.
Figure 2.. CRX E80A binds to wild-type (WT) sites while CRX K88N occupies novel genomic regions enriched for N88 homeodomain (HD) motif in vivo.
(A) Enrichment heatmap depicting CRX ChIP-seq normalized reads centered at all possible CRX peaks ±2 kb, sorted by binding intensity in WT samples. Clusters were defined by hierarchical clustering of CRX-binding intensity matrix from all genotypes (Materials and methods). (B, C) Genome browser representations of ChIP-seq normalized reads for different CRX species in P14 WT and mutant mouse retinas at Rho and Atf2. (D) Enrichment heatmap showing fraction of CRX ChIP-seq peaks fall in different genomic environments. (E) Logo representations of de novo found short HD motifs under CRX ChIP-seq peaks in WT and mutant mouse retinas with DREME E-value on the right.
Figure 2—figure supplement 1.
Figure 2—figure supplement 1.. Wild-type (WT) and mutation knock-in mouse CRX sequences and genotyping identifications.
(A) Alignment of mCrx cDNA and protein sequences showing the nucleotide substitutions and amino acid changes of CrxE80A (top) and CrxK88N (bottom) alleles. Only coding regions of mCrx exons are shown and the diagram is not to scale. Underlined bases in WT sequences indicate the restriction enzyme HinfI cut sites used in the genotyping PCR. (B) Representative mutation knock-in mouse genotyping gel image. (C) Barchart and stripplot showing mCrx mRNA expression levels in P14 WT and mutant mouse retinas. p-values for one-way analysis of variance (ANOVA) with Turkey honestly significant difference (HSD) test are indicated. (D) Immunoblots of nuclear extracts obtained from P14 WT and mutant mouse retinas showing that full-length CRX protein are produced and localized to the nucleus fraction in all mutant mouse retinas. HDAC1 was used as a loading control.
Figure 3.
Figure 3.. CRX-dependent activated genes affected in opposite directions in developing CrxE80A and CrxK88N mutant retinas.
(A) Heatmap showing sample-wise Pearson correlations of the expression of all CRX-dependent activated genes between P10 wild-type (WT) and homeodomain (HD) mutant mouse retinas in this study (rows) with postnatal WT retinas from age P3 to P21 (columns, data from GSE87064). (B) Heatmap showing the expression changes of DEGs in CRX-dependent activated gene set in HD mutant mouse retinas at P10. (C, D) Heatmaps showing expression changes of selected photoreceptor genes from Groups 1 and 2. Color scale identical to (B).
Figure 3—figure supplement 1.
Figure 3—figure supplement 1.. Definition of CRX-dependent activated and CRX-independent gene sets.
(A) Schematic representation of CRX-dependent activated genes where CRX binding nearby is required for the expression of these genes in mature wild-type (WT) retinas. (B) Top gene ontology (GO) terms associated with CRX-dependent activated genes. Benjamini–Hochberg adjusted p-values are shown. (C) Line plot showing average expression pattern of CRX-dependent activated genes during normal postnatal retina. (D) Definition of CRX-independent genes where CRX binding nearby is dispensable for the expression of these genes in mature WT retinas. (E) Top GO terms associated with CRX-independent genes. (F) Line plot showing average expression pattern of CRX-independent genes during normal retina development. RNA-seq data in (C) and (F) were retrieved from Aldiri et al., 2017 (GEO accession: GSE87064).
Figure 3—figure supplement 2.
Figure 3—figure supplement 2.. E80A and K88N mutation each causes novel gene expression changes in the CRX-independent category.
(A) Strip plots showing normalized CRX ChIP-seq intensity at peaks associated with Group 1 or 2 genes in wild-type (WT) and CRX mutant mouse retinas. p-values for two-sided Mann–Whitney U-test are indicated. (B) Venn diagram showing the overlap of genes differentially expressed (DEGs) in CrxE80A (pale blue) and CrxK88N (pale yellow) but not in CrxR90W/W (gray) mutant retinas. For DEGs in CrxE80A and CrxK88N mutants, genes that were differentially expressed in either heterozygotes or homozygotes, or both were counted. (C) Heatmap showing the expression changes of CRX-independent genes that are DEGs in at least one of the CrxE80A mutants (n = 244, left). Heatmap on the right shows the expression pattern of these genes during normal postnatal development (data from GEO: GSE87064). (D) Table showing selected genes downregulated in CrxE80A mutants that have been implicated in cell differentiation or photoreceptor development. (E) Heatmap showing the expression changes of CRX-independent genes that are DEGs in at least one of the CrxK88N mutants (n = 351, left). Heatmap on the right shows the expression pattern of these genes during normal postnatal development (data from GEO: GSE87064). (F) Barchart showing gene ontology (GO) term enrichment of DEGs in CrxK88N mutants.
Figure 4.
Figure 4.. Photoreceptor genes important for phototransduction are downregulated in all homeodomain (HD) mutants.
(A) Box plot showing that genes in the detection of light stimulus gene ontology (GO) term were downregulated and affected to various degrees in different adult (P21) HD mutant mouse retinas. (B) Heatmap showing that expression of both cone and rod phototransduction genes were downregulated in adult (P21) HD mutant mouse retinas. Annotation of rod and cone enrichment of each gene is in Supplementary file 1f. See Figure 4—figure supplement 1 for the developmental expression dynamics of these genes.
Figure 4—figure supplement 1.
Figure 4—figure supplement 1.. Developmental expression pattern of phototransduction genes in WT animals.
(A) Parallel coordinates plot showing expression pattern of genes in GO:0009583 during normal postnatal retina development (data from GEO: GSE87064). Row z-score is shown. (B) Heatmap showing expression patterns of phototransduction genes during normal postnatal retina development (data from GEO: GSE87064). Row z-score is shown.
Figure 5.
Figure 5.. Only CrxE80A/+ retinas maintain photoreceptor OS and residual rod electroretinogram (ERG) response.
(A–E) Hematoxylin–eosin (H&E) staining of P21 retina sections show that photoreceptor OS layer is absent in all mutant retinas except CrxE80A/+. OS: outer segment; ONL: outer nuclear layer; INL: inner nuclear layer; IPL: inner plexiform layer; GCL: ganglion cell layer. Scale bar, 100 µm. (F–J) Rhodopsin (RHO, red) immunostaining is present in CrxE80A/+, CrxE80A/A, and CrxK88N/+ retinas and absent in CrxK88N/N retina. Cone arrestin (mCAR, green) immunostaining is absent in all mutant retinas. Nuclei were visualized by (4',6-diamidino-2-phenylindole) DAPI staining (blue). Scale bar, 100 µm. (K–M) The ERG responses recorded from 1 month mice. Error bars represent the standard error of the mean (SEM, n ≥ 4). p-value: Two-way analysis of variance (ANOVA) and Tukey’s multiple comparisons. ****p ≤ 0.0001. ns: >0.05.
Figure 6.
Figure 6.. CRX E80A hyperactivity underlies precocious photoreceptor differentiation in CrxE80A retinas.
(A) Boxplot showing luciferase reporter activities of different CRX variants. p-values for one-way analysis of variance (ANOVA) with Turkey honestly significant difference (HSD) test are indicated. (B–D) Rhodopsin (RHO, green) immunostaining is absent in P3 wild-type (WT) retina but detected in CrxE80A/+ and CrxE80A/A retinas. Nuclei are visualized by DAPI staining (blue). Arrow indicates the sporadic RHO staining in CrxE80A/+ sample. ONBL: outer neuroblast layer; GCL: ganglion cell layer. Scale bar, 100 µm.
Figure 6—figure supplement 1.
Figure 6—figure supplement 1.. Cone photoreceptors born in CrxE80A retinas and hyperactivity of CRX E80A at S-opsin promoter.
(A–C) Immunostaining shows that Retinoid X receptor gamma (RXRγ, red), a fated cone photoreceptor marker, is present in P0 WT, CrxE80A/+, and CrxE80A/A retinas. Nuclei are visualized by DAPI staining (blue). Asterisks indicate examples of RXRG+ cells. NBL: neuroblast layer; GCL: ganglion cell layer. Scale bar, 100 µm. (D) Boxplot showing luciferase reporter activities of different CRX variants at the Opn1sw promoter sequences. p-values for one-way analysis of variance (ANOVA) with Turkey honestly significant difference (HSD) test are indicated.
Figure 7.
Figure 7.. Missense mutations in CRX homeodomain (HD) affect photoreceptor gene expression and lead to distinct retinal disease phenotypes through gain- and loss-of-function mechanisms.
dCoRD: dominant cone–rod dystrophy; dLCA/rLCA: dominant/recessive Leber congenital amaurosis.

Update of

Similar articles

Cited by

References

    1. Aavani T, Tachibana N, Wallace V, Biernaskie J, Schuurmans C. Temporal profiling of photoreceptor lineage gene expression during murine retinal development. Gene Expression Patterns. 2017;23–24:32–44. doi: 10.1016/j.gep.2017.03.001. - DOI - PubMed
    1. Abouzeid H, Youssef MA, ElShakankiri N, Hauser P, Munier FL, Schorderet DF. PAX6 aniridia and interhemispheric brain anomalies. Molecular Vision. 2009;15:2074–2083. - PMC - PubMed
    1. Abouzeid H, Youssef MA, Bayoumi N, ElShakankiri N, Marzouk I, Hauser P, Schorderet DF. RAX and anophthalmia in humans: evidence of brain anomalies. Molecular Vision. 2012;18:1449–1456. - PMC - PubMed
    1. Ades SE, Sauer RT. Specificity of minor-groove and major-groove interactions in a homeodomain-DNA complex. Biochemistry. 1995;34:14601–14608. doi: 10.1021/bi00044a040. - DOI - PubMed
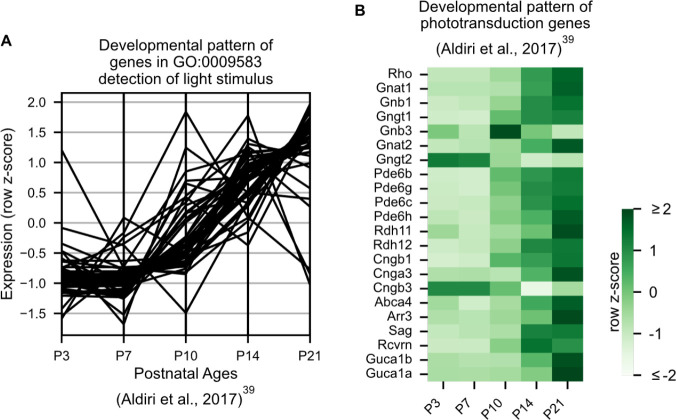
    1. Aldiri I, Xu B, Wang L, Chen X, Hiler D, Griffiths L, Valentine M, Shirinifard A, Thiagarajan S, Sablauer A, Barabas M-E, Zhang J, Johnson D, Frase S, Zhou X, Easton J, Zhang J, Mardis ER, Wilson RK, Downing JR, Dyer MA, St. Jude Children’s Research Hospital—Washington University Pediatric Cancer Genome Project The dynamic epigenetic landscape of the retina during development, reprogramming, and tumorigenesis. Neuron. 2017;94:550–568. doi: 10.1016/j.neuron.2017.04.022. - DOI - PMC - PubMed

Associated data