. 2023 Nov 14:12:RP87720.
doi: 10.7554/eLife.87720.

Approach-avoidance reinforcement learning as a translational and computational model of anxiety-related avoidance

Affiliations

Approach-avoidance reinforcement learning as a translational and computational model of anxiety-related avoidance

Yumeya Yamamori et al. Elife. .

Abstract

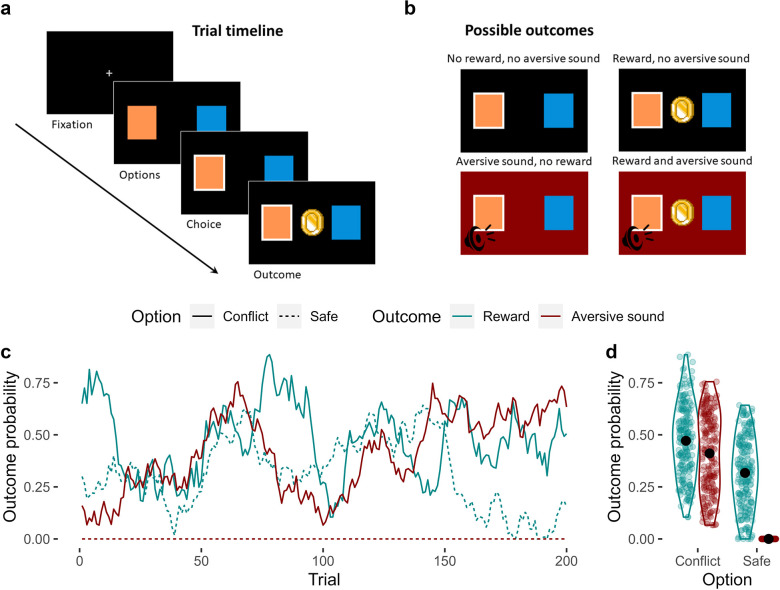
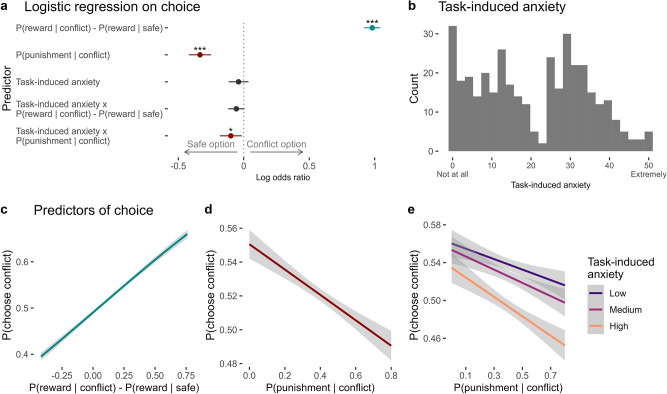
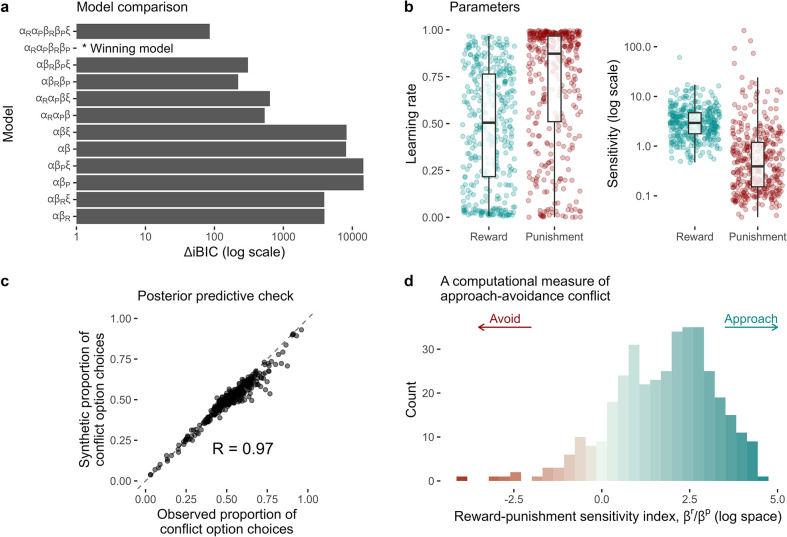
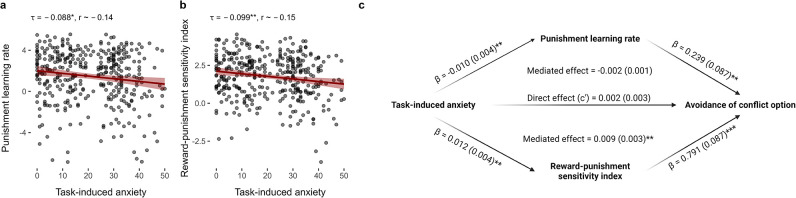
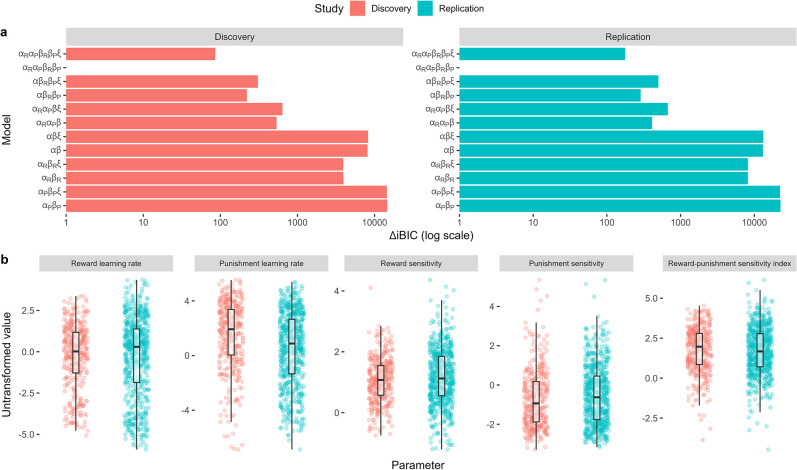
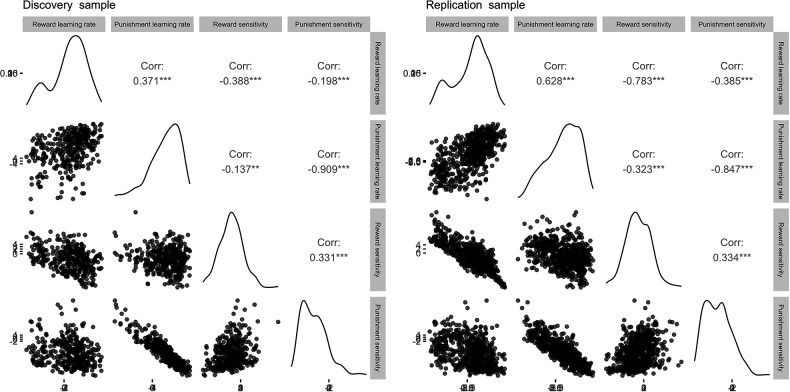
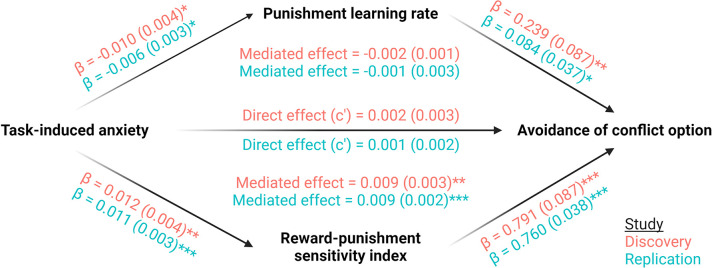
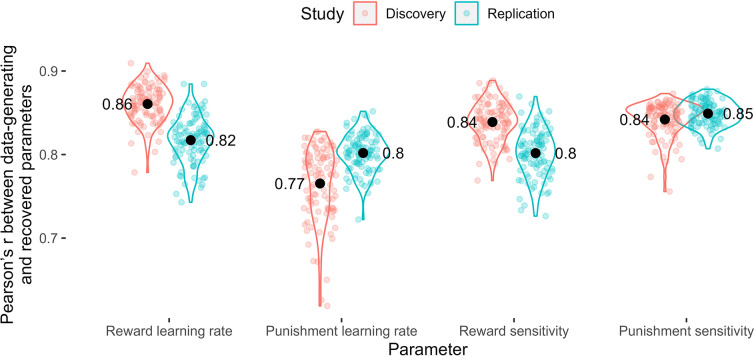
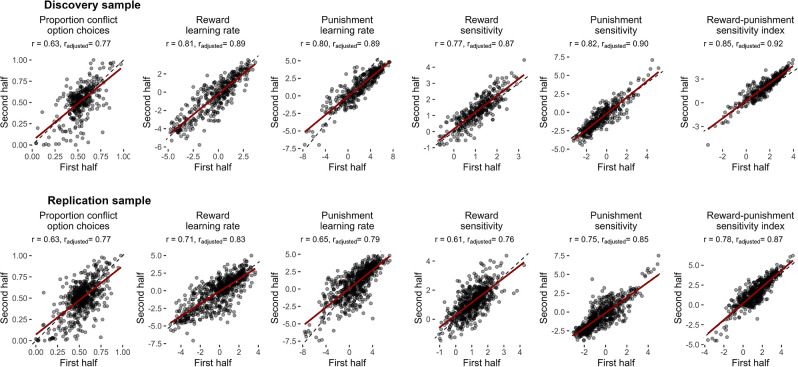
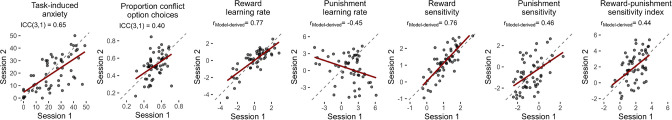
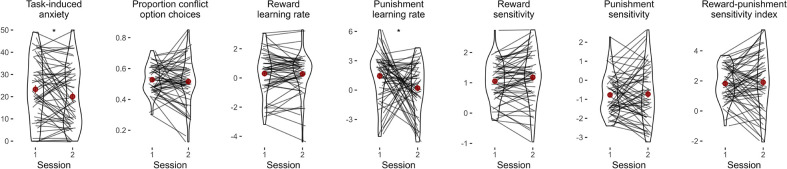
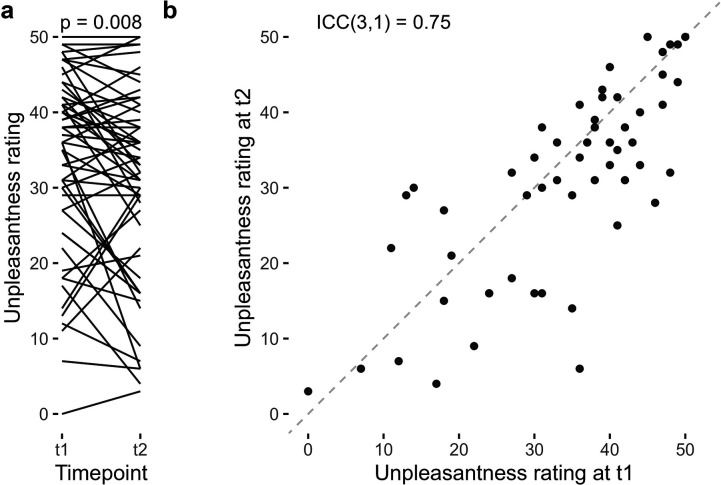
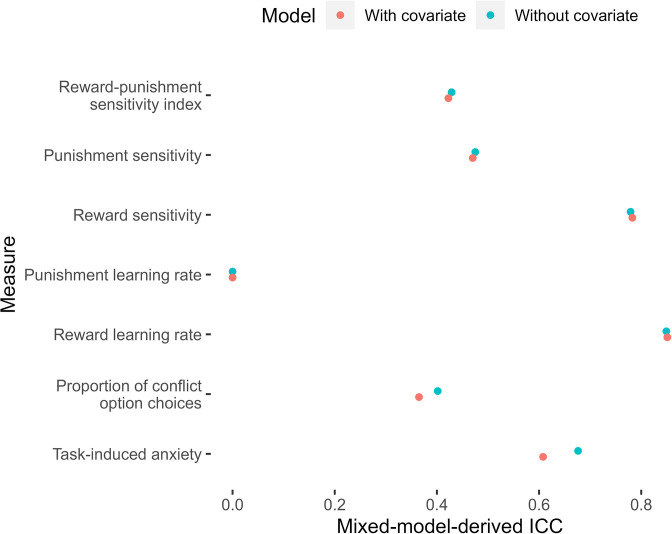
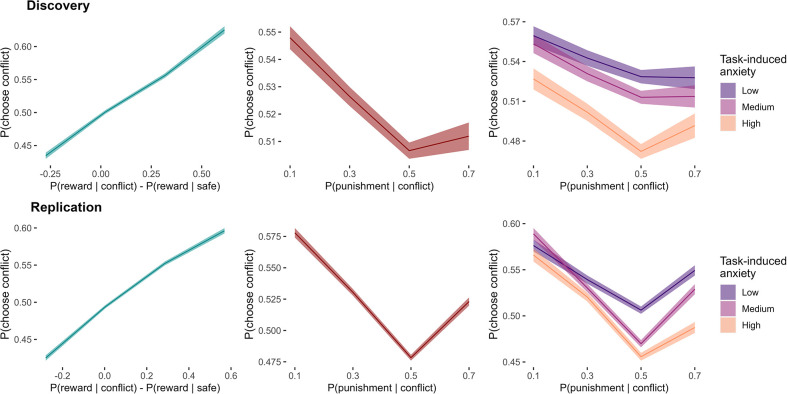
Although avoidance is a prevalent feature of anxiety-related psychopathology, differences in the measurement of avoidance between humans and non-human animals hinder our progress in its theoretical understanding and treatment. To address this, we developed a novel translational measure of anxiety-related avoidance in the form of an approach-avoidance reinforcement learning task, by adapting a paradigm from the non-human animal literature to study the same cognitive processes in human participants. We used computational modelling to probe the putative cognitive mechanisms underlying approach-avoidance behaviour in this task and investigated how they relate to subjective task-induced anxiety. In a large online study (n = 372), participants who experienced greater task-induced anxiety avoided choices associated with punishment, even when this resulted in lower overall reward. Computational modelling revealed that this effect was explained by greater individual sensitivities to punishment relative to rewards. We replicated these findings in an independent sample (n = 627) and we also found fair-to-excellent reliability of measures of task performance in a sub-sample retested 1 week later (n = 57). Our findings demonstrate the potential of approach-avoidance reinforcement learning tasks as translational and computational models of anxiety-related avoidance. Future studies should assess the predictive validity of this approach in clinical samples and experimental manipulations of anxiety.

Keywords: anxiety; approach-avoidance conflict; computational modelling; human; neuroscience; reinforcement learning; translational.


Conflict of interest statement

YY No competing interests declared, OR OJR's MRC senior fellowship is partially in collaboration with Cambridge Cognition Ltd (who plan to provide in-kind contribution) and he is running an investigator-initiated trial with medication donated by Lundbeck (escitalopram and placebo, no financial contribution). He also holds an MRC-Proximity to discovery award with Roche (who provide in-kind contributions and have sponsored travel for ACP) regarding work on heart-rate variability and anxiety. He also has completed consultancy work for Peak, IESO digital health, Roche and BlackThorn therapeutics. OJR sat on the committee of the British Association of Psychopharmacology until 2022, JR Senior editor, eLife

Figures

Figure 1.
Figure 1.. The approach-avoidance reinforcement learning task.
(a) Trial timeline. A fixation cross initiates the trial. Participants are presented with two options for up to 2 s, from which they choose one. The outcome is then presented for 1 s. (b) Possible outcomes. There were four possible outcomes: (1) no reward and no aversive sound; (2) a reward and no aversive sound; (3) an aversive sound and no reward; or (4) both the reward and the aversive sound. (c) Probabilities of observing each outcome given the choice of option. Unbeknownst to the participant, one of the options (which we refer to as the ‘conflict’ option – solid lines) was generally more rewarding compared to the other option (the ‘safe’ option – dashed line) across trials. However, the conflict option was also the only option of the two that was associated with a probability of producing an aversive sound (the probability that the safe option produced the aversive sound was 0 across all trials). The probabilities of observing each outcome given the choice of option fluctuated randomly and independently across trials. The correlations between these dynamic probabilities were negligible (mean Pearson’s r = 0.06). (d) Distribution of outcome probabilities by option and outcome. On average, the conflict option was more likely to produce a reward than the safe option. The conflict option had a variable probability of producing the aversive sound across trials, but this probability was always 0 for the safe option. Black points represent the mean probability.
Figure 2.
Figure 2.. Predictors of choice in the approach-avoidance reinforcement learning task.
(a) Coefficients from the mixed-effects logistic regression of trial-by-trial choices in the task (n = 369). On any given trial, participants chose the option that was more likely to produce a reward. They also avoided choosing the conflict option when it was more likely to produce the punishment. Task-induced anxiety significantly interacted with punishment probability. Significance levels are shown according to the following: p < 0.05 – *; p < 0.01 – **; p < 0.001 – ***. Error bars represent confidence intervals. (b) Subjective ratings of task-induced anxiety, given on a scale from ‘Not at all’ (0) to ‘Extremely’ (50). (c) On each trial, participants were likely to choose the option with greater probability of producing the reward. (d) Participants tended to avoid the conflict option when it was likely to produce a punishment. (e) Compared to individuals reporting lower anxiety during the task, individuals experiencing greater anxiety showed greater avoidance of the conflict option, especially when it was more likely to produce the punishment. Note. Figures c–e show logistic curves fitted to the raw data using the ‘glm’ function in R. For visualisation purposes, we categorised continuous task-induced anxiety into tertiles. We show linear curves here since these effects were estimated as linear effects in the logistic regression models, however the raw data showed non-linear trends – see Appendix 11—figure 1.
Figure 3.
Figure 3.. Computational modelling of approach-avoidance reinforcement learning.
(a) Model comparison results (n = 369). The difference in integrated Bayesian information criterion scores from each model relative to the winning model is indicated on the x-axis. The winning model included specific learning rates for reward (αR) and punishment learning (αp), and specific outcome sensitivity parameters for reward (βR) and punishment (βP). Some models were tested with the inclusion of a lapse term (ξ). (b) Distributions of individual parameter values from the winning model. (c) The winning model was able to reproduce the proportion of conflict option choices over all trials in the observed data with high accuracy (observed vs predicted data r = 0.97). (d) The distribution of the reward-punishment sensitivity index – the computational measure of approach-avoidance bias. Higher values indicate approach biases, whereas lower values indicate avoidance biases.
Figure 4.
Figure 4.. Relationships between task-induced anxiety, model parameters, and avoidance.
(a) Task-induced anxiety was negatively correlated with the punishment learning rate. (b) Task-induced anxiety was also negatively correlated with reward-punishment sensitivity index. Kendall’s tau correlations and approximate Pearson’s r equivalents are reported above each figure (n = 369). (c) The mediation model. Mediation effects were assessed using structural equation modelling. Bold terms represent variables and arrows depict regression paths in the model. The annotated values next to each arrow show the regression coefficient associated with that path, denoted as coefficient (standard error). Only the reward-punishment sensitivity index significantly mediated the effect of task-induced anxiety on avoidance. Significance levels in all figures are shown according to the following: p < 0.05 – *; p < 0.01 – **; p < 0.001 – ***.
Appendix 2—figure 1.
Appendix 2—figure 1.. Model comparison and parameter distributions across studies.
(a) Model comparison results. The difference in integrated Bayesian information criterion scores from each model relative to the winning model is indicated on the x-axis. The winning model in both studies included specific learning rates for reward (αR) and punishment learning (αp), and specific outcome sensitivity parameters for reward (βR) and punishment (βP). Some models were tested with the inclusion of a lapse term (ξ). (b) Distributions of individual parameter values from the winning model across studies. The reward-punishment sensitivity index constituted our computational measure of approach-avoidance bias, calculated by taking the ratio between the reward and punishment sensitivity parameters.
Appendix 2—figure 2.
Appendix 2—figure 2.. Correlation matrices for the estimated parameters across studies.
Lower-right diagonal of each matrix shows a scatterplot of cross-parameter correlations. Upper-right diagonal denotes the Pearson’s r correlation coefficients for each pair of parameters, based on the untransformed parameter values.
Appendix 3—figure 1.
Appendix 3—figure 1.. Mediation analyses across studies.
Mediation effects were assessed using structural equation modelling. Bold terms represent variables and arrows depict regression paths in the model. The annotated values next to each arrow show the regression coefficient associated with that path, denoted as coefficient (standard error). Only the reward-punishment sensitivity index significantly mediated the effect of task-induced anxiety on avoidance. Significance levels in all figures are shown according to the following: p < 0.05 – *; p < 0.01 – **; p < 0.001 – ***.
Appendix 4—figure 1.
Appendix 4—figure 1.. Parameter recovery.
Pearson’s r values across the data-generating and recovered parameters by parameter. Coloured points represent Pearson’s r values for each of 100 simulation iterations, and black points represent the mean value across simulations.
Appendix 5—figure 1.
Appendix 5—figure 1.. Split-half reliability of the task.
Scatter plots of measures calculated from the first and second halves of the task are shown with their estimates of reliability (Pearson's r values). Reliability estimates for the computational measures from the winning computational model were computed by fitting split-half parameters within a single model, then using the parameter covariance matrix to derive Pearson’s correlation coefficients for each parameter across halves. Reliability estimates are reported as unadjusted values (r) and after adjusting for reduced number of trials via Spearman-Brown correction (radjusted). Dotted lines represent the reference line, indicating perfect correlation. Red lines show lines-of-best-fit.
Appendix 6—figure 1.
Appendix 6—figure 1.. Test-retest reliability of the task.
Scatter plots of measures calculated from the test and retest sessions are shown with their estimates of reliability (intra-class correlations: ICCs; and Pearson's r values). Reliability estimates for the model-agnostic measures (task-induced anxiety, proportion of conflict option choices) were estimated using intra-class correlation coefficients. Reliability estimates for the computational measures from the winning computational model were computed by first fitting both sessions’ parameters within a single model, then using the parameter covariance matrix to derive a Pearson’s correlation coefficient (rModel-derived) for each parameter across sessions to be calculated from their covariance. Dotted lines represent the reference line, indicating perfect correlation. Red lines show lines-of-best-fit.
Appendix 7—figure 1.
Appendix 7—figure 1.. Task practice effects.
Comparison of behavioural measures and model parameters across time. Lines represent individual data, red points represent mean values, and red lines represent standard error bars. P-values of paired t-tests are annotated above each plot. Task-induced anxiety and the punishment learning rate was significantly lower in the second session, whilst the other measures did not change significantly across sessions. Significance levels are shown according to the following: p < 0.05 – *.
Appendix 8—figure 1.
Appendix 8—figure 1.. Inter-parameter correlations across the expectation maximisation (EM, red) and variational Bayesian inference (VBI, blue) algorithms.
Overall, the VBI algorithm produced lower correlations compared to EM.
Appendix 8—figure 2.
Appendix 8—figure 2.. Sensitivity analysis of the computational findings relating to task-induced anxiety; comparing results when using parameters estimated via expectation maximisation (EM, red) and variational Bayesian inference (VBI, blue).
(a) Kendall’s tau correlations across each parameter and task-induced anxiety. (b) Mediating effects of the punishment learning rate and reward-punishment sensitivity index.
Appendix 9—figure 1.
Appendix 9—figure 1.. Distribution of self-reported punishment unpleasantness ratings.
Ratings were scored from ‘Not at all’ to ‘Extremely’ (encoded as 0 and 50, respectively). Distributions are shown across the discovery and replication samples.
Appendix 9—figure 2.
Appendix 9—figure 2.. The effect of including unpleasantness ratings as a covariate in the hierarchical logistic regression models of task choices.
Dots represent coefficient estimates from the model, with confidence intervals. Models are shown for both the discovery and replication samples. Significance levels are shown according to the following: p < 0.05 – *; p < 0.01 – **; p < 0.001 – ***.
Appendix 9—figure 3.
Appendix 9—figure 3.. The effect of including unpleasantness ratings as a covariate in the mediation models.
Dots represent coefficient estimates from the model, with confidence intervals. Models are shown for both the discovery and replication samples. Significance levels are shown according to the following: p < 0.1 – †; p < 0.05 – *; p < 0.01 – **; p<0.001 – ***.
Appendix 9—figure 4.
Appendix 9—figure 4.. Test-retest reliability of unpleasantness ratings.
(a) Comparing unpleasantness ratings across timepoints, participants rated the punishments as significantly less unpleasant in the second session. (b) Correlation of ratings across timepoints.
Appendix 9—figure 5.
Appendix 9—figure 5.. Mixed-model-derived intra-class correlation coefficients (ICCs) for measures of task performance, with and without accounting for unpleasantness.
Dots represent model-derived ICCs.
Appendix 11—figure 1.
Appendix 11—figure 1.. Effects of outcome probabilities on proportion of conflict option choices.
Mean probabilities of choosing the conflict arm across the sample are plotted with standard errors. The relationships between the drifting outcome probabilities in the task and group choice proportions showed non-linear trends in both the discovery and replication samples, especially for the effect of punishment probability on choice (both main effect and interaction effect with anxiety). Note. For visualisation purposes, the continuous predictors (based on the latent outcome probabilities or task-induced anxiety) were categorised into discrete bins.

Update of

  • doi: 10.1101/2023.04.04.535526
  • doi: 10.7554/eLife.87720.1
  • doi: 10.7554/eLife.87720.2
  • doi: 10.7554/eLife.87720.3

Similar articles

Cited by

References

    1. Aldao A, Nolen-Hoeksema S, Schweizer S. Emotion-regulation strategies across psychopathology: A meta-analytic review. Clinical Psychology Review. 2010;30:217–237. doi: 10.1016/j.cpr.2009.11.004. - DOI - PubMed
    1. Aupperle RL, Paulus MP. Neural systems underlying approach and avoidance in anxiety disorders. Dialogues in Clinical Neuroscience. 2010;12:517–531. doi: 10.31887/DCNS.2010.12.4/raupperle. - DOI - PMC - PubMed
    1. Aupperle RL, Sullivan S, Melrose AJ, Paulus MP, Stein MB. A reverse translational approach to quantify approach-avoidance conflict in humans. Behavioural Brain Research. 2011;225:455–463. doi: 10.1016/j.bbr.2011.08.003. - DOI - PMC - PubMed
    1. Aylward J, Valton V, Ahn WY, Bond RL, Dayan P, Roiser JP, Robinson OJ. Altered learning under uncertainty in unmedicated mood and anxiety disorders. Nature Human Behaviour. 2019;3:1116–1123. doi: 10.1038/s41562-019-0628-0. - DOI - PMC - PubMed
    1. Bach DR. Cross-species anxiety tests in psychiatry: pitfalls and promises. Molecular Psychiatry. 2022;27:154–163. doi: 10.1038/s41380-021-01299-4. - DOI - PMC - PubMed