. 2023 Nov 21;120(47):e2307773120.
doi: 10.1073/pnas.2307773120. Epub 2023 Nov 14.

The emergence and diversification of a zoonotic pathogen from within the microbiota of intensively farmed pigs

Affiliations

The emergence and diversification of a zoonotic pathogen from within the microbiota of intensively farmed pigs

Gemma G R Murray et al. Proc Natl Acad Sci U S A. .

Abstract

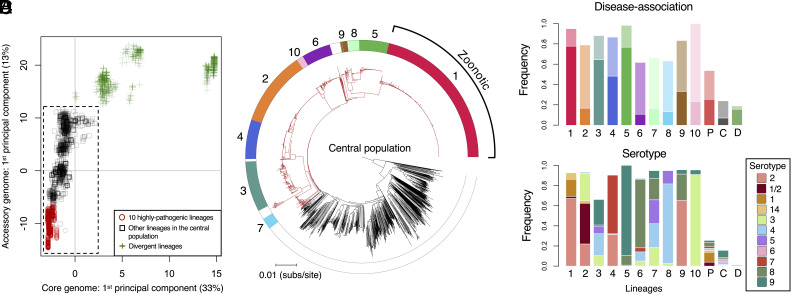
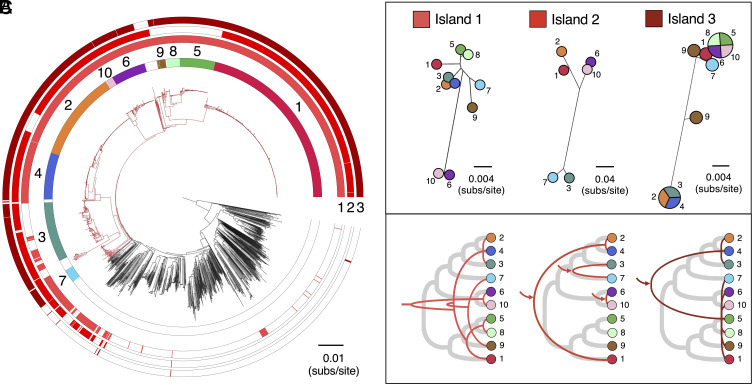
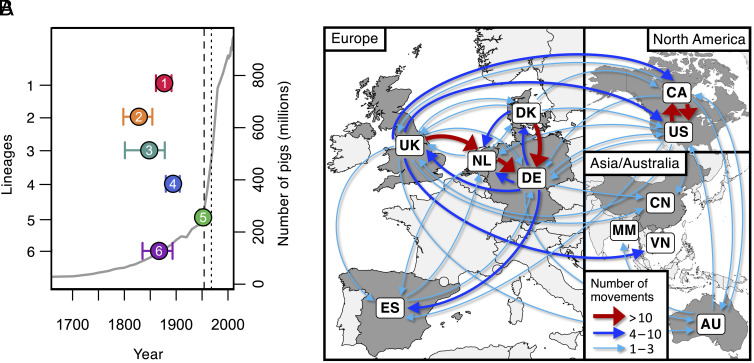
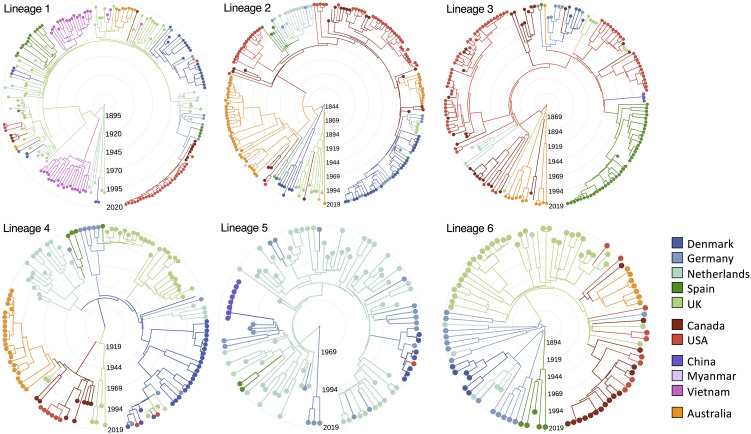
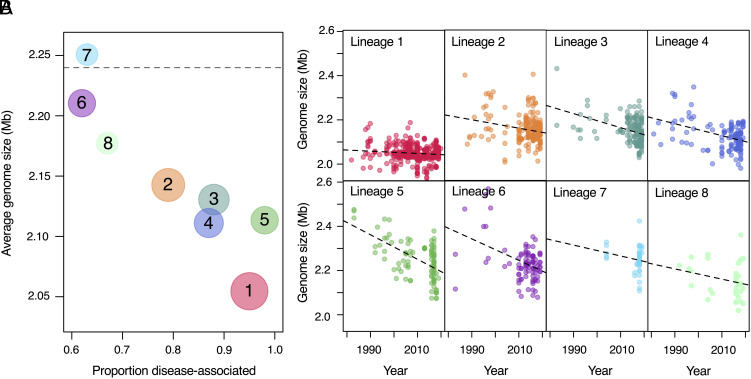
The expansion and intensification of livestock production is predicted to promote the emergence of pathogens. As pathogens sometimes jump between species, this can affect the health of humans as well as livestock. Here, we investigate how livestock microbiota can act as a source of these emerging pathogens through analysis of Streptococcus suis, a ubiquitous component of the respiratory microbiota of pigs that is also a major cause of disease on pig farms and an important zoonotic pathogen. Combining molecular dating, phylogeography, and comparative genomic analyses of a large collection of isolates, we find that several pathogenic lineages of S. suis emerged in the 19th and 20th centuries, during an early period of growth in pig farming. These lineages have since spread between countries and continents, mirroring trade in live pigs. They are distinguished by the presence of three genomic islands with putative roles in metabolism and cell adhesion, and an ongoing reduction in genome size, which may reflect their recent shift to a more pathogenic ecology. Reconstructions of the evolutionary histories of these islands reveal constraints on pathogen emergence that could inform control strategies, with pathogenic lineages consistently emerging from one subpopulation of S. suis and acquiring genes through horizontal transfer from other pathogenic lineages. These results shed light on the capacity of the microbiota to rapidly evolve to exploit changes in their host population and suggest that the impact of changes in farming on the pathogenicity and zoonotic potential of S. suis is yet to be fully realized.

Keywords: Streptococcus suis; bacterial pathogens; comparative genomics; livestock pathogens; pathogen emergence.


Conflict of interest statement

The authors declare no competing interest.

Figures

Fig. 1.
Fig. 1.
The relationship between pathogenicity and genetic structure within S. suis. (A) The first components of principal component analyses of the presence/absence of accessory genes and SNPs in core genes plotted against one another for all 3,070 isolates in our collection (other components and their eigenvalues are shown in SI Appendix, Figs. S3 and S4). Points represent individual isolates and different shapes/colours represent categories of lineages. Isolates in the dashed box fall within the central population of S. suis. (B) A core genome phylogeny of the central population of S. suis (excluding divergent isolates). Branches in the pathogenic clade are coloured red and branches outside of this clade are coloured black. Colours in the outer ring indicate the 10 most common lineages in our collection, which we also find to be the most pathogenic. Lineage 1 largely corresponds to ST1, which is associated with most cases of zoonotic disease in humans. (C) The frequency of disease-associated isolates in each of the 10 pathogenic lineages (1 to 10), in other lineages within the pathogenic clade (P, coloured red in B), in the central population outside of the pathogenic clade (C, coloured black in B), and in divergent lineages (D, green addition signs in A). Bars 1 to 10 are coloured to match the outer ring in B with the lower part of the bar (deeper colour) representing the frequency of systemic disease isolates and the upper part of the bar (paler colour) representing the frequency of respiratory disease isolates. (D) The frequency of disease-associated serotypes in the same groups as shown in C.
Fig. 2.
Fig. 2.
Divergent evolutionary histories of the three pathogenicity-associated genomic islands. (A) The same core genome phylogeny as shown in Fig. 1B with three additional outer rings describing the presence of the three pathogenicity-associated genomic islands (1, 2, and 3). (B) Trees representing median genetic distances between pathogenic lineages based on coding regions of each of the three genomic islands (as described in SI Appendix, Figs. S6–S8). For Island 3, lineages that have average distances of zero are represented by the same circle split into segments and lineage 9 is represented by two circles due to the presence of two divergent versions of the island. (C) Cladograms representing inferred patterns of acquisition and inheritance of these three islands (red lines) compared to the core genome (thicker gray lines). Arrows indicate inferred acquisitions from outside of S. suis. A single inferred recombination event is omitted from the description of the history of Island 3 shown in C.
Fig. 3.
Fig. 3.
Dates of emergence and paths of between-country transmission for the six most common pathogenic lineages. (A) Estimates of the dates of the most recent common ancestors of the six most common pathogenic lineages (coloured points) against an estimate of the global number of pigs (gray line). Country-specific estimates of pig numbers are shown in SI Appendix, Fig. S15. The vertical dashed line shows the date of the first reported case of S. suis disease in pigs (1954), and the dotted line shows the first reported human case (1968). (B) Map showing inferred routes of transmission of these six pathogenic lineages between the countries in our collection. Arrows represent routes with at least one inferred transmission event. Routes with more than ten inferred transmission events are shown in red, those with more than three in blue, and those with one to three in turquoise. Further details of the numbers and rates of movements between countries across our six lineages are shown in SI Appendix, Figs. S18–S20 and Table S4.
Fig. 4.
Fig. 4.
Reconstructions of the emergence and spread of the six most common pathogenic lineages. Time-scaled phylogenies for the six most common pathogenic lineages of S. suis coloured by country of origin. Colours of branches represent the most likely ancestral location inferred from ancestral state reconstructions with an asymmetric discrete transition model in BEAST.
Fig. 5.
Fig. 5.
Gradual and ongoing genome reduction in pathogenic lineages. (A) Average genome sizes for recently sampled isolates (2018 to 2020) are shown against the proportion of disease-associated isolates for pathogenic lineages 1 to 8. Pathogenic lineages 9 and 10 are not shown as we have no or very few recent isolates from these lineages in our collection. The size of the points reflects the number of isolates in our collection on a log-scale. The dashed line represents the average genome size of isolates of S. suis from outside of the pathogenic clade, where disease isolates are present at a frequency of approximately 25%. (B) Genome sizes of individual isolates against sampling year for lineages 1 to 8. Dashed lines represent best fits for linear models of genome size against year of isolation; all have a negative slope, with a gradient ranging from a loss of 516 bases per year (lineage 1) to a loss of 5,550 bases per year (lineage 5).

References

    1. Bar-On Y. M., Phillips R., Milo R., The biomass distribution on Earth. Proc. Natl. Acad. Sci. U.S.A. 115, 6506–6511 (2018). - PMC - PubMed
    1. Food and Agriculture Organization of the United Nations Statistics Division (FAOSTAT), Food and agriculture data. https://www.fao.org. 2 March 2023.
    1. Gilbert W., Thomas L. F., Coyne L., Rushton J., Review: Mitigating the risks posed by intensification in livestock production: The examples of antimicrobial resistance and zoonoses. Animal 15, 100123 (2021). - PubMed
    1. Jones B. A., et al. , Zoonosis emergence linked to agricultural intensification and environmental change. Proc. Natl. Acad. Sci. U.S.A. 110, 8399–8404 (2013). - PMC - PubMed
    1. Engering A., Hogerwerf L., Slingenbergh J., Pathogen-host-environment interplay and disease emergence. Emerg. Microbes Infect. 2, e5 (2013). - PMC - PubMed

LinkOut - more resources