. 2023 Nov;20(208):20230424.
doi: 10.1098/rsif.2023.0424. Epub 2023 Nov 15.

Evolutionary rescue on genotypic fitness landscapes

Affiliations

Evolutionary rescue on genotypic fitness landscapes

L M Wahl et al. J R Soc Interface. 2023 Nov.

Abstract

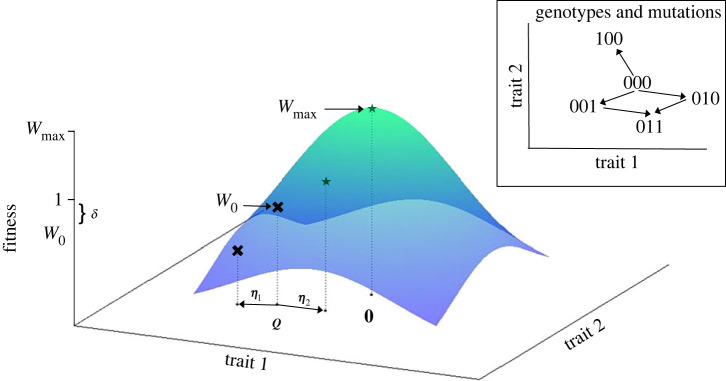
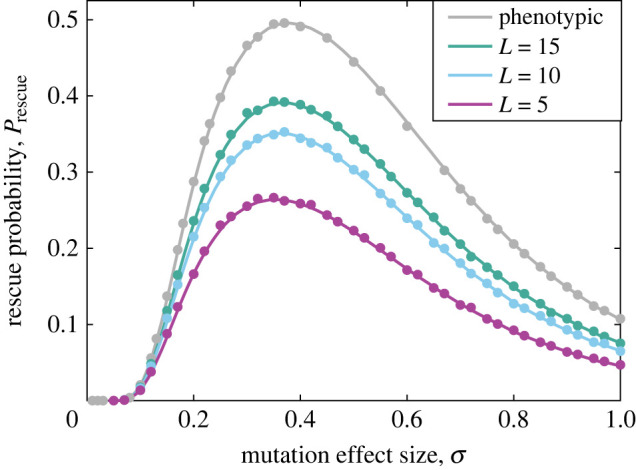
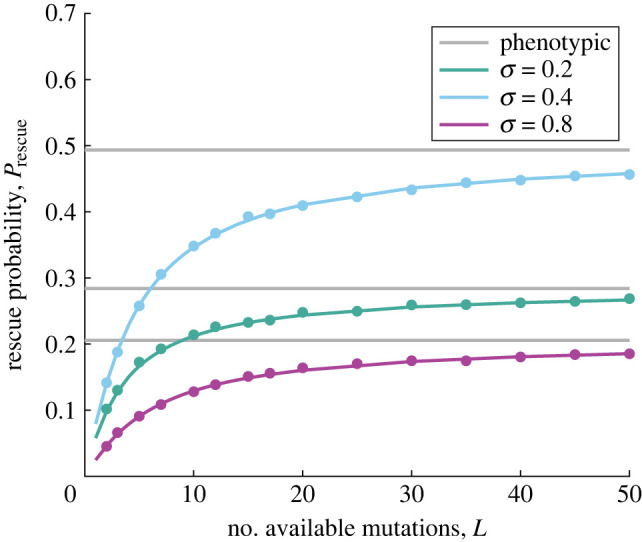
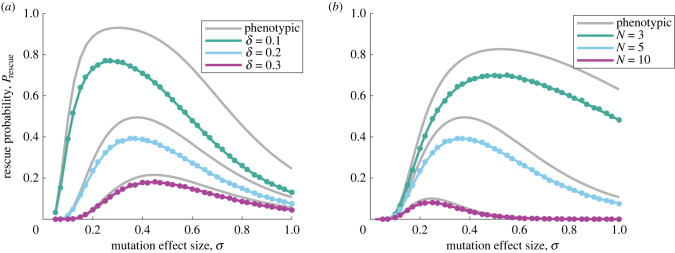
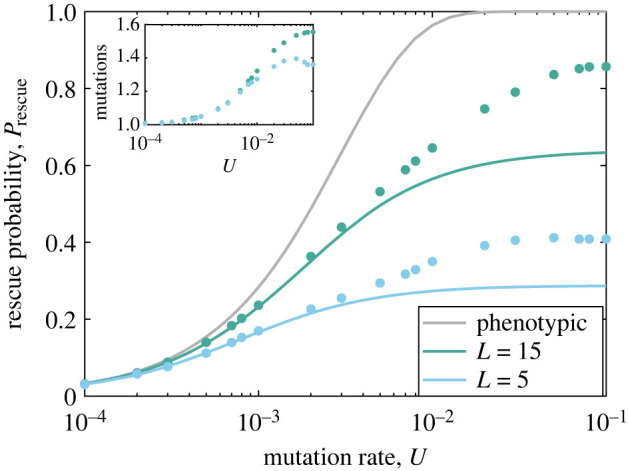
Populations facing adverse environments, novel pathogens or invasive competitors may be destined to extinction if they are unable to adapt rapidly. Quantitative predictions of the probability of survival through adaptation, evolutionary rescue, have been previously developed for one of the most natural and well-studied mappings from an organism's traits to its fitness, Fisher's geometric model (FGM). While FGM assumes that all possible trait values are accessible via mutation, in many applications only a finite set of rescue mutations will be available, such as mutations conferring resistance to a parasite, predator or toxin. We predict the probability of evolutionary rescue, via de novo mutation, when this underlying genetic structure is included. We find that rescue probability is always reduced when its genetic basis is taken into account. Unlike other known features of the genotypic FGM, however, the probability of rescue increases monotonically with the number of available mutations and approaches the behaviour of the classical FGM as the number of available mutations approaches infinity.

Keywords: Fisher's geometric model; evolutionary rescue; moving optimum; stochastic process.


Conflict of interest statement

We declare we have no competing interests.

Figures

Figure 1.
Figure 1.
Fisher’s geometric model defines fitness (coloured surface) as a function of trait values, illustrated here for N = 2. The peak fitness Wmax occurs at the optimal trait values, shown here as 0. In an evolutionary rescue scenario, the wild-type phenotype, Q, has fitness W0 < 1. Mutations occur as displacement vectors, η. In this example, if mutation η1 occurs, fitness is reduced. However if η2 occurs, trait values move closer to the optimum and fitness is greater than unity (stars and black crosses indicate fitness values >1 and <1 respectively.) In the classic version of FGM, mutations can move the phenotype Q to any point in trait space. In contrast in the genotypic realization, the phenotype Q can only ‘jump’ by additive combinations of a finite set of ηi. An illustration for two traits, N = 2, and sequence size L = 3 is provided in the inset. Here the phenotype associated with genotype 011 is obtained from 000 by additively combining η2 and η3.
Figure 2.
Figure 2.
Rescue probability versus mutation effect size. The probability of evolutionary rescue for the classic, phenotypic FGM (grey lines, equation (3.6)) and for the genotypic model (equation (3.12)) is plotted versus the mutation effect size, σ. We find that the rescue probability is reduced in the genotypic model, decreasing with the number of available mutations, L (L=15,10and5 plotted in green, blue and purple, respectively). Filled circles are simulation results (error bars are similar to or smaller than symbol heights and have been omitted). Other parameters are: N = 5, U = 10−3, δ = 0.2, ρ = 1.
Figure 3.
Figure 3.
Rescue probability versus the number of available mutations. The probability of evolutionary rescue for the classic, phenotypic FGM (grey lines, equation (3.6)) and for the genotypic model (equation (3.12)) is plotted versus the number of available mutations, L. We find that the rescue probability is reduced in the genotypic model, but approaches the prediction for the phenotypic model as L grows large. Filled circles are simulation results (error bars are similar to or smaller than symbol heights and have been omitted). Results are shown for different values of mutation size effect, σ, as indicated in the legend. Other parameters are: N = 5, U = 10−3, δ = 0.2, ρ = 1.
Figure 4.
Figure 4.
Rescue probability versus mutation effect size as the distance to the fitness optimum or the dimensionality of trait space varies. The probability of evolutionary rescue for the classic, phenotypic FGM (grey lines, equation (3.6)) and for the genotypic model (equation (3.12)) is plotted versus the mutation effect size, σ. Again the rescue probability is reduced in the genotypic model, but retains the overall behaviour of the phenotypic model. In (b), note that the magnitude of each mutation vector is not rescaled as N varies; the average magnitude thus increases with N for a fixed σ. This explains the left shift in the optimal value of σ for higher N. Filled circles are simulation results (error bars are similar to or smaller than symbol heights and have been omitted). Other parameters are: N = 5 (a), δ = 0.2 (b), U = 10−3, ρ = 1 and L = 15.
Figure 5.
Figure 5.
Rescue probability versus mutation rate. The probability of evolutionary rescue for the classic, phenotypic FGM (grey line, equation (3.6)) and for the genotypic model at L = 5 and L = 15 (equation (3.12)) is plotted versus the mutation rate, U. Filled circles are simulation results (error bars are similar to or smaller than symbol heights and have been omitted). The inset shows the number of mutations present, on average, in individuals with positive growth rates at the end of the simulation. As U increases, multiple mutations contribute to the rescue process, and the analytical approximation fails. However, again we see that rescue is reduced in the genotypic model, and increases with L. Other parameters are: σ = 0.2, N = 5, δ = 0.2 and ρ = 1.
Figure 6.
Figure 6.
Distribution of rescue probabilities across 1000 distinct draws of the mutational vectors, with the rescue scenario simulated 1000 times per set. The mean rescue probability was 0.355 (vertical line) with standard deviation 0.349. Note that the y-scale is broken for clarity. The parameters values are: σ = 0.2, L = 10, N = 5, δ = 0.2 and ρ = 1.

Similar articles

Cited by

References

    1. Gomulkiewicz R, Holt RD. 1995. When does evolution by natural selection prevent extinction? Evolution 49, 201-207. (10.2307/2410305) - DOI - PubMed
    1. Alexander HK, Martin G, Martin OY, Bonhoeffer S. 2014. Evolutionary rescue: linking theory for conservation and medicine. Evol. Appl. 7, 1161-1179. (10.1111/eva.12221) - DOI - PMC - PubMed
    1. Bell G. 2017. Evolutionary rescue. Ann. Rev. Ecol. Evol. Syst. 48, 605-627. (10.1146/annurev-ecolsys-110316-023011) - DOI
    1. Uecker H, Hermisson J. 2011. On the fixation process of a beneficial mutation in a variable environment. Genetics 188, 915-930. (10.1534/genetics.110.124297) - DOI - PMC - PubMed
    1. Bell G, Gonzalez A. 2009. Evolutionary rescue can prevent extinction following environmental change. Ecol. Lett. 12, 942-948. (10.1111/j.1461-0248.2009.01350.x) - DOI - PubMed

Publication types

LinkOut - more resources