. 2024 Feb 7;44(6):e0703232023.
doi: 10.1523/JNEUROSCI.0703-23.2023.

Neuronal Population Encoding of Identity in Primate Prefrontal Cortex

Affiliations

Neuronal Population Encoding of Identity in Primate Prefrontal Cortex

K K Sharma et al. J Neurosci. .

Abstract

The ventrolateral prefrontal cortex (VLPFC) shows robust activation during the perception of faces and voices. However, little is known about what categorical features of social stimuli drive neural activity in this region. Since perception of identity and expression are critical social functions, we examined whether neural responses to naturalistic stimuli were driven by these two categorical features in the prefrontal cortex. We recorded single neurons in the VLPFC, while two male rhesus macaques (Macaca mulatta) viewed short audiovisual videos of unfamiliar conspecifics making expressions of aggressive, affiliative, and neutral valence. Of the 285 neurons responsive to the audiovisual stimuli, 111 neurons had a main effect (two-way ANOVA) of identity, expression, or their interaction in their stimulus-related firing rates; however, decoding of expression and identity using single-unit firing rates rendered poor accuracy. Interestingly, when decoding from pseudo-populations of recorded neurons, the accuracy for both expression and identity increased with population size, suggesting that the population transmitted information relevant to both variables. Principal components analysis of mean population activity across time revealed that population responses to the same identity followed similar trajectories in the response space, facilitating segregation from other identities. Our results suggest that identity is a critical feature of social stimuli that dictates the structure of population activity in the VLPFC, during the perception of vocalizations and their corresponding facial expressions. These findings enhance our understanding of the role of the VLPFC in social behavior.

Keywords: expression; face; macaque; multisensory; prefrontal; vocalization.


Conflict of interest statement

The authors declare no competing financial interests.

Figures

Figure 1.
Figure 1.
Naturalistic expression presentation task. Two macaque subjects viewed movie clips (audio and video) of vocalization–expressions from unknown conspecifics. A, Stimulus presentation was initiated by the subject by fixating on a central dot for 500 ms. An audiovisual expression was subsequently presented (900 ms mean length) and a reward was given if fixation was maintained on the stimulus through its length. B, Matrix of stimuli showing that movie clips of three conspecifics (PH, BK, and ST) making aggressive (AGG; pant threat, bark), affiliative (AFL; coo), or neutral (NEU; grunt) expressions were presented pseudo-randomly. Two lists were constructed with these parameters and alternated between recording sessions.
Figure 2.
Figure 2.
Single units exhibit heterogeneous responses. Representative responses to multiple repetitions of all nine expressions are grouped in columns by expression. Responses to identity PH are in gold, BK in purple, and ST in teal. Raster plots for each trial are presented above with corresponding spike density functions below, color-coded by identity. 0 ms represents the onset time of the stimuli. Because these stimuli were naturalistic expressions, consisting of a video and audio component, the duration of the stimuli varied from 400 to 1,500 ms. A, Identity was a significant modulator of the firing rate for this unit, as well as the interaction between identity and expression (two-way ANOVA identity × expression; p < 0.005 for identity; p = 0.154 for expression; p < 0.005 for interaction). B, Another responsive unit. In this case, identity, expression, and their interaction significantly modulated the firing rate (two-way ANOVA identity × expression; p < 0.005 for identity; p = 0.025 for expression; p < 0.005 for interaction).
Figure 3.
Figure 3.
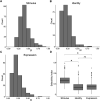
Selectivity index distributions. A selectivity index was calculated for all 285 units with regard to selectivity for one of nine stimuli, one of three identities, or one of three expressions. The plots above depict the counts of cells at each tier of selectivity index (in bins of size 0.1), with regard to selectivity for stimuli (A), identity (B), and expression (C). The mean of each distribution was significantly different from 0 (3 Wilcox tests; p < 0.005 for stimuli, identity, and expression means compared with 0). Boxplots in D depict a comparison between means of SI for each factor of interest. The population was more selective for specific stimuli (0.41 ±0.13) compared with identity (0.22 ± 0.13) and expression (0.23 ± 0.13) (Kruskal–Wallis; df = 2; p < 0.001 followed by pairwise Wilcoxon rank sum; p < 0.001; Bonferroni corrected). While these units are not uniformly responsive, they are also not highly selective for specific stimuli, identities, or expressions.
Figure 4.
Figure 4.
Two-way ANOVA of single-cell firing rates. Two-way ANOVA of EXP, ID, or the INT of both. A, Of the 285 responsive units, 111 were statistically significant (p < 0.05) for at least one ANOVA factor (in orange), indicating an influence of EXP, ID, or INT. B, The counts of units with significant effects for each factor or interaction in this analysis. Eighty units were significant for ID, 56 for EXP, and 66 for INT. C, The units from B represent an overlapping population that can have multiple significant factors. Thus, there are seven possible classifications for each unit and the distribution of these classifications is shown in the Venn diagram. Lighter shades indicate higher counts. Percentages represent a proportion of the 111 two-way ANOVA positive units in A. Overall, a co-occurrence of significant effects of ID, EXP, and INT was the highest portion in the two-way ANOVA positive population, indicating influences of both ID and EXP as well as specific stimuli. Examples such units with these effects are shown in Figure 5.
Figure 5.
Figure 5.
Firing rate by stimulus for two units with effects of ID, EXP, and INT. Two units with box and whisker representations of firing rates for each stimulus [horizontal bar = median; box = interquartile range (IQR); stems = 1.5*IQR]. Boxplot line boarders correspond to expression, and boxplot fill colors correspond to identity. In both A and B, both units had significant effects of expression, identity, and interaction in two-way ANOVA analysis. A, An SI calculated by stimulus is provided and the y-axis is scaled to a relevant range for each unit. In A, a unit with firing rate trends for expressions and identity also has a single stimulus (BK-NEU) for which there is a markedly different firing rate distribution than all others. B, A similar trend as in A for a unit with a higher SI. In this case, stimulus ST-AFL had a markedly higher firing rate than others.
Figure 6.
Figure 6.
Weak decoding of identity and expression from single-unit firing rates. For each single unit, we classified single trials based on the firing rate similarity (Euclidean distance) to 5–21 nearest neighbors in training sets (KNN model, threefold CV, 5 repeats). The maximum decoding accuracy across 5–21 nearest neighbors was used as the single-unit decoding accuracy. The mean decoding accuracies of expression (0.37 ± 0.05 SD) and identity (0.38 ± 0.06) were not significantly different from the empirical chance value of 0.37, nor were they significantly different from each other (p > 0.016; Wilcoxon signed-rank; Bonferroni-corrected p-threshold).
Figure 7.
Figure 7.
Pseudo-populations of single units facilitate better decoding of identity and expression. Pseudo-populations of sizes 2–280 were constructed from random samples of the 280 units. A KNN decoder was used to classify the single trials by their nearest neighbors (Euclidean distance). The maximum accuracy from classification using five, seven, or nine neighbors was used as the accuracy metric. At each pseudo-population size, 50 repetitions of twofold CV were conducted (each repetition with a random selection of units) and averaged to produce the mean and standard error for the population size. The data was randomized and decoding was re-run to derive an empirical chance value (black line). Dots represent the mean decoding accuracy at a given population size for a particular variable, error bars represent the 95% confidence interval of the mean (±1.96 × standard error). Decoding accuracies for both variables increase as population size increases, with identity increasing faster and ultimately having higher accuracy at larger populations than expression.
Figure 8.
Figure 8.
Sliding bin decoding analysis reveals early peak of identity decoding. A decoding analysis was performed on 285 unit pseudo-population firing rates in 200 ms bins, across the response period. The data was randomized and decoding was re-run to derive an empirical chance value (black line). Dots represent the mean decoding accuracy for the variable of interest across 50 iterations of fivefold CV. Dots represent the center of the bin (i.e., a dot at 50 ms represents a bin from −50 to 150 ms). Error bars represent the 95% confidence interval of the mean (1.96 * standard error). Peak decoding of identity was higher and occurred earlier than that for expression. Additionally, the mean decoding accuracy for identity was greater than expression for all bins after stimulus onset.
Figure 9.
Figure 9.
The PCA population responses to identity are closer than expressions. The mean firing rates over 0–1,500 ms for each stimulus, for all 285 responsive units, were analyzed using PCA. A, The population responses to each of the 9 stimuli are reconstructed in PC1 and PC2. Population responses are colored by identity, to highlight that identities appear to occupy nonoverlapping portions of the overall response space. B, The distances between population responses to similar identities (ID), expressions (EXP), or mismatching stimuli (OTHER) were measured and grouped together in reconstructed spaces preserving PCs 1–8. There were significant effects of PCs preserved (p < 0.005) and group (p < 0.005) in a two-way ANOVA (adjusted for unbalanced groups). Tukey’s HSD testing showed significant differences between ID-EXP (p < 0.005) and ID-OTHER (p < 0.005). The difference between EXP-OTHER was not significant (p = 0.95).
Figure 10.
Figure 10.
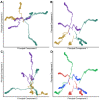
The PCA population responses to naturalistic stimuli follow identity-based trajectories. The positions of the population response to each stimulus through time were projected onto the 0–1,500 ms firing rate PCA space from Figure 9. Coloring of identities is the same as the previous figure; markers have been adjusted to reflect the same identity as well. Each marker represents the position of the population at a point in time, for a given stimulus. The transparency of the marker is proportional to the time point, wherein very transparent markers represent firing rates across the early response period (e.g., 0–150 ms) and less transparent markers represent firing rates across a longer response period (e.g., 0–1,200 ms). Trajectories are connected by lines for ease of following. A, A view of the population mean trajectories from PC1 and PC2. B, PC1 and PC3. C, PC2 and PC3. D, The same as B, recolored to group expressions rather than identities (red = aggressive, blue = affiliative, green = neutral). The trajectories emanate from a central region and the trajectories of the same identity appear to move toward a common subspace.

Similar articles

Cited by

References

    1. Abbott LF, Dayan P (1999) The effect of correlated variability on the accuracy of a population code. Neural Comput 11:91–101. 10.1162/089976699300016827 - DOI - PubMed
    1. Averbeck BB, Latham PE, Pouget A (2006) Neural correlations, population coding and computation. Nat Rev Neurosci 7:358–366. 10.1038/nrn1888 - DOI - PubMed
    1. Averbeck BB, Lee D (2006) Effects of noise correlations on information encoding and decoding. J Neurophysiol 95:3633–3644. 10.1152/jn.00919.2005 - DOI - PubMed
    1. Barak O, Rigotti M, Fusi S (2013) The sparseness of mixed selectivity neurons controls the generalization–discrimination trade-off. J Neurosci 33:3844–3856. 10.1523/JNEUROSCI.2753-12.2013 - DOI - PMC - PubMed
    1. Barat E, Wirth S, Duhamel J-R (2018) Face cells in orbitofrontal cortex represent social categories. Proc Natl Acad Sci U S A 115:E11158–E11167. 10.1073/pnas.1806165115 - DOI - PMC - PubMed

Publication types

LinkOut - more resources