. 2023 Nov 14;14(1):7289.
doi: 10.1038/s41467-023-42000-3.

Mechanistic insights into glycoside 3-oxidases involved in C-glycoside metabolism in soil microorganisms

Affiliations

Mechanistic insights into glycoside 3-oxidases involved in C-glycoside metabolism in soil microorganisms

André Taborda et al. Nat Commun. .

Abstract

C-glycosides are natural products with important biological activities but are recalcitrant to degradation. Glycoside 3-oxidases (G3Oxs) are recently identified bacterial flavo-oxidases from the glucose-methanol-coline (GMC) superfamily that catalyze the oxidation of C-glycosides with the concomitant reduction of O2 to H2O2. This oxidation is followed by C-C acid/base-assisted bond cleavage in two-step C-deglycosylation pathways. Soil and gut microorganisms have different oxidative enzymes, but the details of their catalytic mechanisms are largely unknown. Here, we report that PsG3Ox oxidizes at 50,000-fold higher specificity (kcat/Km) the glucose moiety of mangiferin to 3-keto-mangiferin than free D-glucose to 2-keto-glucose. Analysis of PsG3Ox X-ray crystal structures and PsG3Ox in complex with glucose and mangiferin, combined with mutagenesis and molecular dynamics simulations, reveal distinctive features in the topology surrounding the active site that favor catalytically competent conformational states suitable for recognition, stabilization, and oxidation of the glucose moiety of mangiferin. Furthermore, their distinction to pyranose 2-oxidases (P2Oxs) involved in wood decay and recycling is discussed from an evolutionary, structural, and functional viewpoint.


Conflict of interest statement

The authors declare no competing interests.

Figures
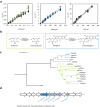
Fig. 1
Fig. 1. Reaction scheme of PsG3Ox, phylogenetic analysis of P2Oxs/G3Oxs and PsG3Ox C-deglycosilation gene cluster.
a Transient-state kinetics for the reductive half-reaction using d-Glc (left) or Mang (middle) as electron donor and the oxidative half-reaction (right). All transient-state data were obtained using a stopped-flow apparatus under an anaerobic atmosphere at 25 °C. The routine buffer was 100 mM sodium phosphate buffer with 200 mM NaCl at pH 7.5. Independent experiments (n = 3) are evidenced in different color shades. Source data are provided as a Source Data file. Some traces for both half-reactions are shown in Supplementary Fig. 1. b The reaction catalyzed by PsG3Ox to convert d-Glc to 2-keto-d-Glc and the conversion of Mang to 3-keto-Mang. c Maximum likelihood phylogenetic relationship between characterized POxs; cholesterol oxidase sequence, ChOx, from Streptomyces sp. was used as outgroup. The blue cluster represent the bacterial enzymes that shows higher specificity for glycosides and the green cluster group the dimeric bacterial enzyme (KaP2Ox) and the tetrameric fungal enzymes that display higher specificity towards d-Glc. The phylogenetic tree was generated using Molecular Evolutionary Genetics analysis (MEGA 11) software and the input sequences are provided in the Source Data file. d The gene coding for PsG3Ox is part of a putative C-deglycosylation catabolic pathway. Four proteins with similarity to known C-glycoside deglycosydases (CGDs) are encoded in close vicinity to the psg3ox gene in P. siccitolerans 4J27 genome: PsCGD_C1 and PsCGD_C2 display 37%, and 33% identity compared to CarC and PsCGD_B1 and PsCGD_B2 which displayed 49% and 38% identity compared to CarB present from Microbacterium sp. 5-2b.
Fig. 2
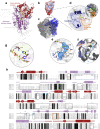
Fig. 2. The structural fold of bacterial PsG3Ox.
a The overall structure of PsG3Ox displays the flavin- and substrate-binding domains highlighted in dark red and purple, respectively. The monomer of TmP2Ox (PDB 1TT0, light gray) is superimposed. The solvent-accessible surface of PsG3Ox (b) and of one subunit of TmP2Ox (c) are represented according to the a.d.p values, blue (6 Å2) to red (107 Å2). d Structural elements that surround the FAD cavity in PsG3Ox and delimiting amino acid residues (defined using a 1.4-Å rolling probe). e Tunnel that connect the surface to FAD is represented in blue mesh. The delimiting residues in blue and in orange belong to the insertion-1 and substrate loop, respectively. f Representation of the accessible surface area that define a tunnel that can route the molecular oxygen to the FADN5 (blue arrow), and the active site cavity that can be the preferred pathway for the hydrogen peroxide elimination (orange arrow). g Comparison of PsG3Ox (residues in green) and TmP2Ox (PDB 2IGK, residues in purple) flavinylation site. The H bonds are shown as black dashed lines. In all structures, the FAD is shown as sticks in yellow color. h Amino acid sequence alignment of bacterial and fungal POxs based on 3D superpositions of the crystal structure. The α-helices or β-chains are numbered and colored as in (a). Catalytic residues are highlighted with *. The flavinylation motif and the substrate loop in fungal P2Oxs are marked with light green and orange boxes, respectively. The insertions and deletions regions are highlighted with dashed boxes. The cyan-marked residues correspond to the non-visible regions. Strictly conserved amino acids are represented on black background, whereas dark gray represents the most conserved residues among the selected sequences.
Fig. 3
Fig. 3. Conformational changes of PsG3Ox upon substrate binding.
X-ray structure of a substrate-free PsG3Ox, b PsG3Ox-Glc, and c PsG3Ox-Mang complexes with thickness proportional to a.d.p. values, color-coded from blue (6 Å2) to red (107 Å2). Regions without electron density are highlighted near the structures. Structural models of d substrate-free PsG3Ox, e PsG3Ox-Glc, and f PsG3Ox-Mang with the non-visible regions in the crystal structure modeled by Rosetta. The insertion-1 and substrate loop (including the modeled segments) are colored dark blue and orange, respectively. Cartoon representation of the active site highlighting the insertion-1 and the conformation of the substrate loop (residues 346–354) in g substrate-free PsG3Ox, h PsG3Ox-Glc, and i PsG3Ox-Mang complexes. The catalytic residues are shown as sticks colored in dark red or blue for the crystal structures or models. The residues in the substrate loop are shown as sticks in gray color and orange for crystal structures and models. The purple triangles represent the interatomic distances between the catalytic pair and the residue P348 of the substrate loop. In all structures, the FAD and the substrates d-Glc and Mang are shown as sticks and colored yellow, green, and cyan, respectively.
Fig. 4
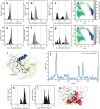
Fig. 4. Conformational transitions of loops close to PsG3Ox active site.
Histograms of the substrate-loop distance to FAD (A352-FADN5) in GaMD simulations run (black and gray represent different replicates) for a Model I, which has no substrate and starts with a closed loops conformation, b Model II, which contains d-Glc and starts at semi-open conformation; and for c Model III*, that starts at open conformation and has no substrate. d Projection of the Model III* first trajectory onto the two first principal components obtained by PCA analysis, colored according to the A352-FADN5 distance, two main areas of structures are populated along PC1, which roughly correspond to the closed (blue) and open (green) conformations of substrate loop. Histograms of the insertion-1 distance to FAD (G84-FADN5) in GaMD simulations run (black and gray represent different replicates) for e Model I, f Model II, and g Model III*. h Projection of the Model III* first trajectory onto the two first principal components obtained by PCA analysis, colored accordingly to G84-FADN5 distance, two main areas of structures are populated along PC1, which roughly correspond to the closed (blue) and open (green) conformations of the insertion 1. In all histograms of GaMD simulations, the black and gray colors represent two distinct simulations of 600 ns. i Cartoon representation of the first and last (600 ns) frames of the GaMD simulation of Model III*. The transition from open to closed state of substrate loop and insertion-1 are represented by a black arrow. FAD is colored yellow. j r.m.s.f. of Model III* GaMD. Histograms of the k substrate-loop and l insertion-1 distances to FADN5 in cMD simulation for Model IV that contains Mang and starts with open loops conformations. m Visual representation of the final frame (400 ns) of the corresponding simulation, where residues are colored according to hydrophobicity (white to red). Source data is provided as a Source Data file.
Fig. 5
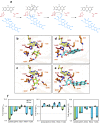
Fig. 5. Interactions of PsG3Ox with substrates.
a Proposed reaction mechanism of the mangiferin oxidation where the proton abstraction by H440 occur after hydride transfer (adapted from Wongnate et al. ). Binding of d-Glc in PsG3Ox-Glc crystal structure (b) and docking model (c). Binding of Mang in PsG3Ox-Mang crystal structure (d) and in docking model (e). The catalytic residues (H440 and N484) are shown as sticks colored in dark-red and the non-catalytic interacting residues are colored in orange. The FAD and the substrates d-Glc and Mang are shown as sticks and colored in yellow, green, and cyan, respectively. The hydrogen bonds are shown as black dashed lines. f Fold-change of the catalytic parameters compared with the wild-type PsG3Ox for the alanine mutants at the non-catalytic interacting residues. The catalytic parameters for d-Glc were estimated using the HRP-AAP/DCHBS coupled assay, whereas reactions with Mang were monitored by oxygen consumption in an Oxygraph. The bars and error bars represent the mean ± SD while the overlaid points represent the values for all the independent assays (n = 3). All reactions were performed in 100 mM sodium phosphate buffer at pH 7.5 at 37 °C. The kinetic parameters were determined by fitting the data directly on the Michaelis-Menten equation using OriginLab (see Supplementary Table 6). Triplicates were performed for all kinetic measurements. Source data is provided as a Source Data file.

References

    1. Hultin PG. Bioactive C-glycosides from bacterial secondary metabolism. Curr. Top. Med. Chem. 2005;5:1299–1331. doi: 10.2174/156802605774643015. - DOI - PubMed
    1. Zhang YQ, Zhang M, Wang ZL, Qiao X, Ye M. Advances in plant-derived C-glycosides: Phytochemistry, bioactivities, and biotechnological production. Biotechnol. Adv. 2022;60:108030. doi: 10.1016/j.biotechadv.2022.108030. - DOI - PubMed
    1. Yang Y, Yu B. Recent advances in the chemical synthesis of C-glycosides. Chem. Rev. 2017;117:12281–12356. doi: 10.1021/acs.chemrev.7b00234. - DOI - PubMed
    1. Bililign T, Griffith BR, Thorson JS. Structure, activity, synthesis and biosynthesis of aryl-C-glycosides. Nat. Prod. Rep. 2005;22:742–760. doi: 10.1039/b407364a. - DOI - PubMed
    1. Kytidou K, Artola M, Overkleeft HS, Aerts JMFG. Plant glycosides and glycosidases: a treasure-trove for therapeutics. Front. Plant Sci. 2020;11:357. doi: 10.3389/fpls.2020.00357. - DOI - PMC - PubMed

Publication types