. 2023 Nov 14;14(1):7349.
doi: 10.1038/s41467-023-42913-z.

TLR7 promotes smoke-induced experimental lung damage through the activity of mast cell tryptase

Affiliations

TLR7 promotes smoke-induced experimental lung damage through the activity of mast cell tryptase

Gang Liu et al. Nat Commun. .

Abstract

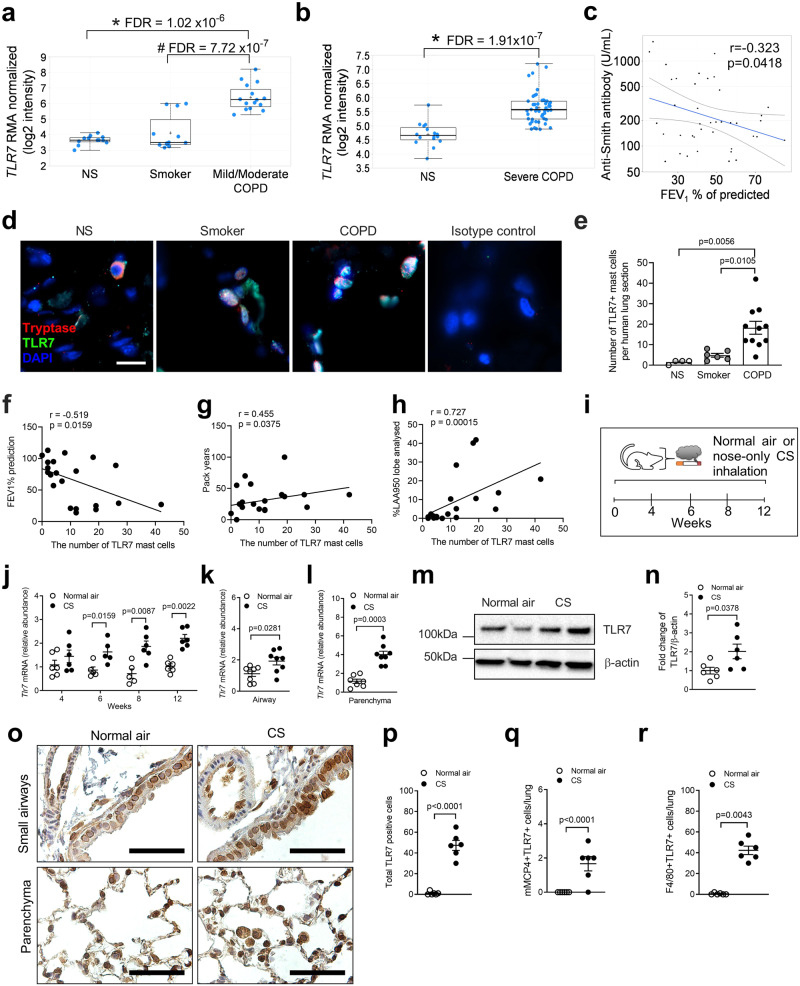
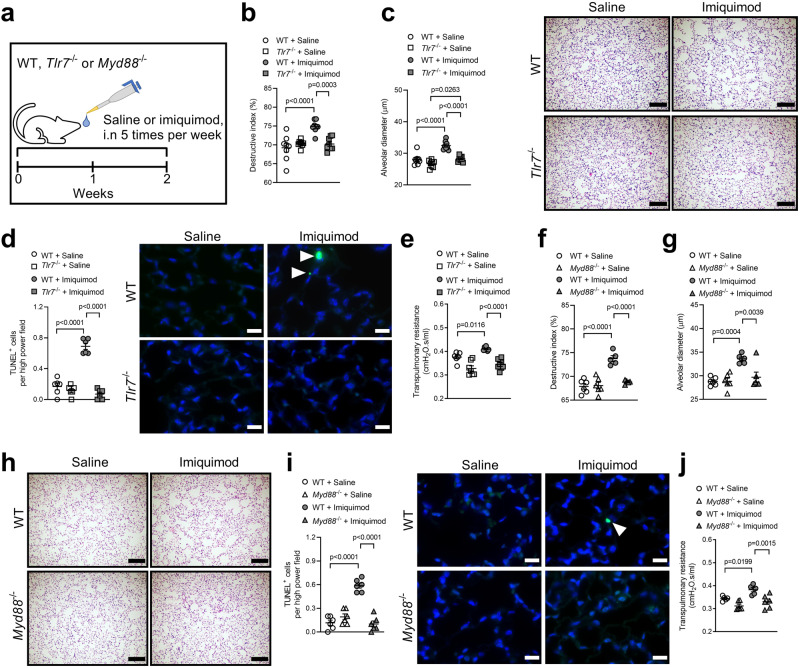
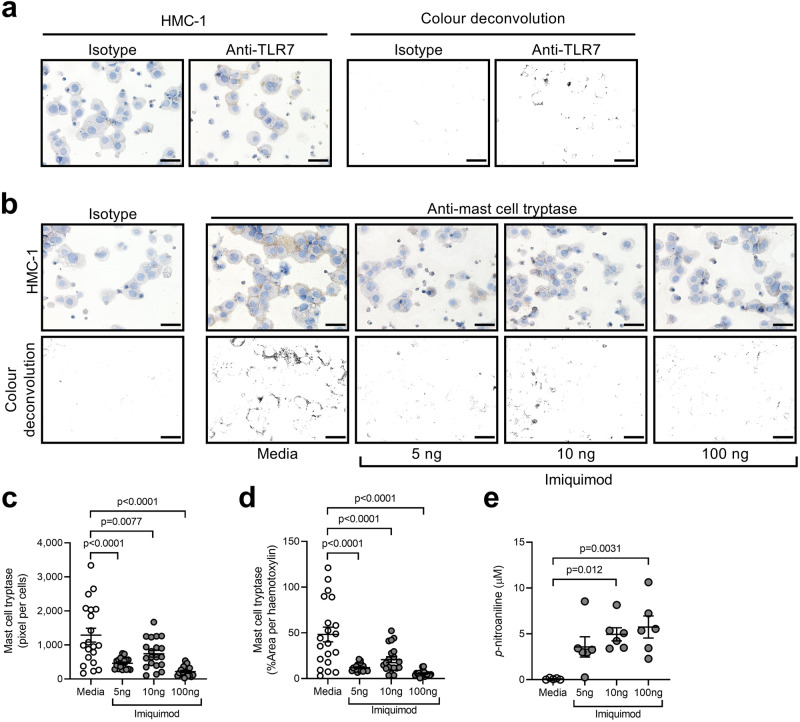
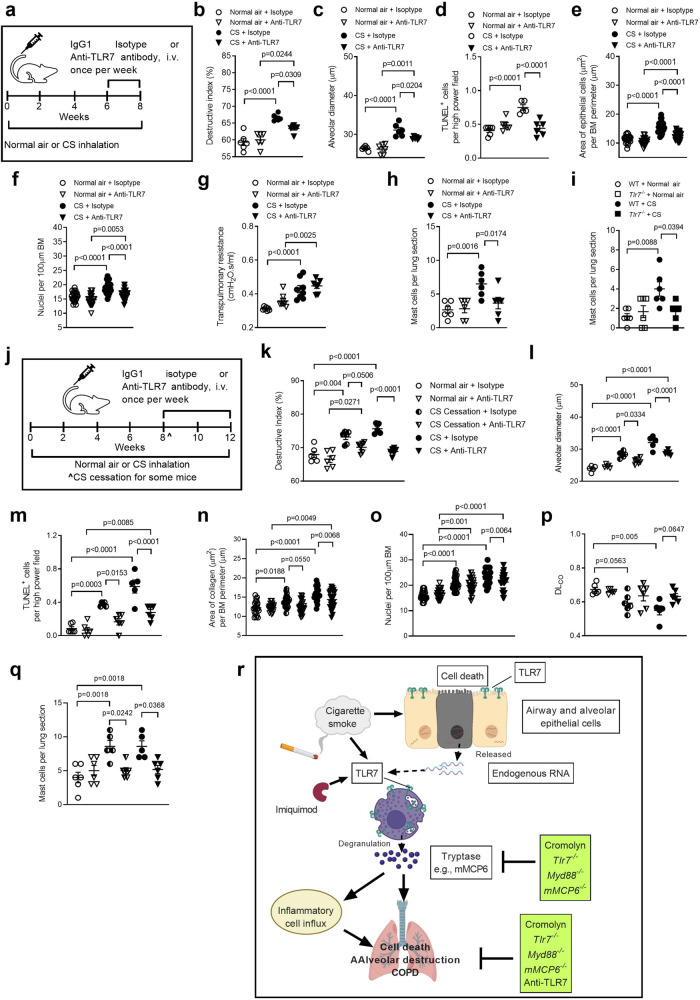
Toll-like receptor 7 (TLR7) is known for eliciting immunity against single-stranded RNA viruses, and is increased in both human and cigarette smoke (CS)-induced, experimental chronic obstructive pulmonary disease (COPD). Here we show that the severity of CS-induced emphysema and COPD is reduced in TLR7-deficient mice, while inhalation of imiquimod, a TLR7-agonist, induces emphysema without CS exposure. This imiquimod-induced emphysema is reduced in mice deficient in mast cell protease-6, or when wild-type mice are treated with the mast cell stabilizer, cromolyn. Furthermore, therapeutic treatment with anti-TLR7 monoclonal antibody suppresses CS-induced emphysema, experimental COPD and accumulation of pulmonary mast cells in mice. Lastly, TLR7 mRNA is increased in pre-existing datasets from patients with COPD, while TLR7+ mast cells are increased in COPD lungs and associated with severity of COPD. Our results thus support roles for TLR7 in mediating emphysema and COPD through mast cell activity, and may implicate TLR7 as a potential therapeutic target.


Conflict of interest statement

The authors declare no competing interests.

Figures

Fig. 1
Fig. 1. TLR7 is increased in human and experimental COPD.
a TLR7 mRNA levels in airway epithelial brushings from non-smokers (NS), healthy smokers without COPD (Smoker) and COPD patients with Global Initiative for Chronic Obstructive Lung Disease (GOLD) stage I (mild) or II (moderate) disease (n = 12 NS; n = 12 Smokers; n = 15 mild or moderate COPD). b TLR7 mRNA levels in lung parenchyma cores from NS and COPD patients with GOLD stage IV (severe) disease (n = 16 NS; n = 48 severe COPD). Differential gene expression analysis was performed using published microarray datasets (GEO accession numbers GSE5058 and GSE27597) and the numbers in panels a and b represent the false discovery rate (FDR), whereby *denotes FDR of COPD vs. NS; and # denotes FDR of COPD vs. Smoker. The data are presented as box and whiskers with min to max showing all points. c Correlation analysis of anti-Smith antibody levels in serum and forced expiratory volume in 1 second (FEV1) of mild-to-moderate COPD patients (n = 40). d Human lung sections stained with tryptase, TLR7 and DAPI by immunofluorescence, and e TLR7+ mast cells were enumerated in sections from NS controls (n = 4), smoker (n = 6) and COPD patients (n = 11). The numbers of TLR7+ mast cells correlated with f FEV1% predicted, g pack years of cigarettes, and h low attenuation areas less than a threshold of −950 Hounsfield units (%LAA950) in NS, smoker, and COPD patients. i Induction of experimental COPD where wild-type (WT) BALB/c mice (female, 6–8 weeks old) were exposed to nose-only inhalation of cigarette smoke (CS) for up to 12 weeks, controls received normal air. j Tlr7 mRNA levels in whole lungs of WT mice exposed to normal air or CS after 4, 6, 8, and 12 weeks (n = 6 mice per group). Tlr7 mRNA levels in blunt-dissected k airways and l lung parenchyma after 8 weeks of CS exposure (n = 6 mice per group). Wild-type (WT) BALB/c mice (n = 6) were exposed to CS for 8 weeks to induce experimental COPD, controls were exposed to normal air. m TLR7 protein was assessed in mouse lungs by immunoblot, and n quantitated by densitometry analysis of fold change normalised to β-actin (n = 6 mice per group). o Representative micrographs (n = 3 mice per group) of TLR7 immunostaining in small airways (top) and lung parenchyma (bottom) of WT mice exposed to normal air (left) or CS (right) for 8 weeks. Scale bars, 50 µm. WT BALB/c mice were exposed to 8 weeks of CS, control mice breathed normal air. p Total TLR7+ cells, q mMCP4+TLR7+ mast cells and r F4/80+TLR7+ macrophages enumerated in whole lung sections (n = 6 mice per group). All data are presented as means ± s.e.m. and are representative of two independent experiments. For panel c, fh, correlation analyzes were performed using Spearman’s rank correlation coefficient test. For panel e, compared to NS or smokers using one-way ANOVA with Bonferroni’s multiple comparison test. The rest of the panels compared COPD to normal air-exposed controls using a two-tailed Mann–Whitney test. Source data are provided as a Source Data file.
Fig. 2
Fig. 2. TLR7 promotes emphysema-like alveolar enlargement, airway remodeling and apoptosis in experimental COPD.
Wild-type (WT) BALB/c mice and Tlr7−/− mice (female, 6–8 weeks old) were exposed to cigarette smoke (CS) or normal air for 8 weeks. a Quantification of destructive index (n = 6 per group). b Representative micrographs (left) of hematoxylin and eosin-stained lung sections from WT (top panels) and Tlr7−/− (bottom panels) mice exposed to normal air (left panels) or CS (right panels). Scale bars, 200 µm. Quantification of mean linear intercept (right, n = 6 per group). c Representative micrographs (left) of TUNEL-stained lung sections from WT (top panels) and Tlr7−/− (bottom panels) mice exposed to normal air (left panels) or CS (right panels). Arrows indicate TUNEL+ cells. Scale bars, 20 µm. Quantification of apoptotic cells (right, n = 5 per group). d Quantification of small airway epithelial cell area per µm of basement membrane (BM) perimeter and e nuclei numbers per 100 µm of BM perimeter of normal air- or CS-exposed WT and Tlr7−/− mice (4 small airways per mouse, n = 6 per group). f Mouse lung sections were stained with Sirius red and fast green. Scale bar=50 um. g Quantification of collagen around the small airways of air- or CS-exposed WT and Tlr7−/− mice (4 small airways per mouse, n = 6 per group). h Lung sections were stained with fibronectin by immunohistochemistry. Scale bar=50 um and i quantification of fibronectin around the small airways of air- or CS-exposed WT and Tlr7−/− mice (4 small airways per mouse, n = 6 per group). j Transpulmonary resistance of normal air- or CS-exposed WT and Tlr7−/− BALB/c mice (n = 6 per group). All data are presented as means ± s.e.m. and are representative of two independent experiments. Statistical analysis was performed using one-way ANOVA with Bonferroni’s multiple comparison test. ns, not significant. Source data are provided as a Source Data file.
Fig. 3
Fig. 3. Pulmonary administration of the synthetic TLR7 agonist imiquimod induces emphysema-like alveolar enlargement and apoptosis and impairs lung function in mice.
a Wild-type (WT) BALB/c mice (female, 6–8 weeks old) were administered low-dose imiquimod (50 μg in 50 μl sterile saline), intranasally (i.n.) 5 times per week, for 8 weeks. Controls received sterile saline. b Quantification of destructive index (n = 6 mice per group) of saline- or imiquimod-administered WT mice. c Quantification of mean linear intercept (n = 6 mice per group) and representative micrographs (right) of hematoxylin and eosin (H&E)-stained lung sections from saline (top panel)- or imiquimod (bottom panel)-administered WT mice. Scale bars, 200 µm. d Quantification of apoptotic cells (n = 6 mice per group) and representative micrographs (right) of TUNEL-stained lung sections from saline (top panel)- or imiquimod (bottom panel)-administered WT mice. Arrows indicate TUNEL+ cells. Scale bars, 20 µm. e Transpulmonary resistance of saline- or imiquimod-administered WT mice (n = 6 mice per group). WT BALB/c mice (female, 6–8 weeks old, n = 8) were challenged with high-dose imiquimod (100 μg in 50 μl sterile saline) intranasally, 5 times per week, for 2 weeks. Controls were challenged with sterile saline. f Total leukocytes, g macrophages, and h lymphocytes in bronchoalveolar lavage fluid (BALF, n = 6 mice per group). mRNA expression of i Cxcl1, j Tnf, k Infar1 were assess in lungs by qPCR (n = 6 mice per group). l Lungs were stained with H&E (scale bar = 50 μm) and m alveolar diameter was assessed (n = 6 mice per group). n Lung function, in terms of transpulmonary resistance was assessed using the flexiVent system (n = 6 mice per group). WT BALB/c mice were administered 5×10⁵ bone-marrow-derived mast cells intranasally from either WT or Tlr7−/− mice. o Neutrophils and p mast cells were counted in BALF 3 days after receiving mast cells (n = 5 mice per group). q WT BALB/c mice were exposed to normal air or CS for 8 weeks and some groups were administered imiquimod (50 μg in 50 μl sterile saline), i.n. 5 times per week, between Week 6 to 8 (for 2 weeks). Controls received sterile saline. r Quantification of the destructive index (n = 6 mice per group) of saline- or imiquimod-administered WT mice exposed to normal air or CS for 8 weeks. s Quantification of mean linear intercept (n = 6 mice per group) and representative micrographs (right) of H&E-stained lung sections from saline (top panel)- or imiquimod (bottom panel)-administered WT mice exposed to normal air (left panel) or CS (right panel) for 8 weeks. Scale bars, 200 µm. t Quantification of apoptotic cells (n = 6 mice per group) and representative micrographs (right) of TUNEL-stained lung sections from saline (top panel)- or imiquimod (bottom panel)-administered WT mice exposed to normal air (left panel) or CS (right panel) for 8 weeks. Arrows indicate TUNEL+ cells. Scale bars, 20 µm. u Transpulmonary resistance of saline- or imiquimod-administered WT mice exposed to normal air or CS for 8 weeks (n = 8 mice per group). All data are presented as means ± s.e.m. and are representative of two independent experiments. For panels bn statistical analysis was performed using two-tailed Mann–Whitney test. For the rest of the panels, statistical analysis was performed using one-way ANOVA with Bonferroni’s multiple comparison test. Source data are provided as a Source Data file.
Fig. 4
Fig. 4. Imiquimod induces emphysema in a TLR7- and MyD88-dependent manner.
a Wild-type (WT) or TLR7-deficient (Tlr7−/−) or MyD88-deficient (Myd88−/−) BALB/c mice (female, 6–8 weeks old) were administered imiquimod (50 μg in 50 μl sterile saline), intranasally (i.n.) 5 times per week, for 2 weeks. Controls received sterile saline. b Quantification of destructive index (n = 8 mice per group) of saline- or imiquimod-administered WT and Tlr7−/− mice. c Quantification of mean linear intercept (n = 8 mice per group) and representative micrographs (right) of hematoxylin and eosin (H&E)-stained lung sections from WT (top panels) and Tlr7−/− (bottom panels) mice administered saline (left panels) or imiquimod (right panels). Scale bars, 200 µm. d Quantification of apoptotic cells (n = 6 mice per group) and representative micrographs (right) of TUNEL-stained lung sections from WT (top panels) and Tlr7−/− (bottom panels) mice administered saline (left panels) or imiquimod (right panels). Arrows indicate TUNEL+ cells. Scale bars, 20 µm. e Transpulmonary resistance of saline- or imiquimod-administered WT and Tlr7−/− mice (n = 8 mice per group). f Quantification of destructive index (n = 6 mice per group) of saline- or imiquimod-administered WT and Myd88−/− mice. g Quantification of mean linear intercept (n = 6 mice per group) and h representative micrographs of H&E-stained lung sections from WT (top panels) and Myd88−/− (bottom panels) mice administered saline (left panels) or imiquimod (right panels). Scale bars, 200 µm. i Quantification of apoptotic cells (n = 6 mice per group) and representative micrographs (right) of TUNEL-stained lung sections from WT (top panels) and Myd88−/− (bottom panels) mice administered saline (left panels) or imiquimod (right panels). Arrows indicate TUNEL+ cells. Scale bars, 20 µm. j Transpulmonary resistance of saline- or imiquimod-administered WT and Myd88−/− mice (n = 6 mice per group). All data are presented as means ± s.e.m. Statistical analysis was performed using one-way ANOVA with Bonferroni’s multiple comparison test. Source data are provided as a Source Data file.
Fig. 5
Fig. 5. Imiquimod induces pulmonary mast cell influx and imiquimod-induced emphysema is reduced in mice treated with the mast cell stabilizer cromolyn or deficient in the mast cell tryptase mMCP6.
a Quantification of mast cells in lung sections from wild type (WT) BALB/c mice (female, 6–8 weeks old, n = 6 mice per group) administered imiquimod or vehicle for 8 weeks. Quantification of mast cells in lung sections from b WT, TLR7- (Tlr7−/−) or c MyD88-deficient (Myd88−/−) BALB/c mice (female, 6–8 weeks old) administered imiquimod or vehicle for 2 weeks (n = 8 mice per group). d Quantification of mast cells in lung sections from WT BALB/c mice exposed to normal air or CS for 8 weeks and administered imiquimod or vehicle from weeks 6–8 (n = 6 mice per group). e WT mice were first administered cromolyn (50 mg/kg body weight) or vehicle (sterile water), and after 2 h, were administered imiquimod (50 μg) or vehicle. Cromolyn, imiquimod, and vehicle were delivered intranasally (i.n.) 5 times per week, for 2 weeks. f Quantification of the destructive index (n = 8 mice per group) of vehicle- or imiquimod-administered mice with or without cromolyn treatment. g Quantification of mean linear intercept (n = 8 mice per group) and representative micrographs (right) of hematoxylin and eosin (H&E)-stained lung sections from vehicle (top panels) and cromolyn (bottom panels) mice administered vehicle (left panels) or imiquimod (right panels). Scale bars, 200 µm. h Quantification of apoptotic cells (n = 6 mice per group). i Transpulmonary resistance of saline- or imiquimod-administered mice with or without cromolyn treatment (n = 8 mice per group). j WT or mouse mast cell protease-6-deficient (mmcp6−/−) C57BL/6 mice were administered imiquimod (50 μg in 50 μl sterile saline), intranasally 5 times per week, for 2 weeks. Controls received sterile saline. k Quantification of destructive index (n = 6 mice per group) of saline- or imiquimod-administered WT and mmcp6−/− mice. l Quantification of mean linear intercept (n = 6 mice per group) and representative micrographs (right) of H&E-stained lung sections from WT (top panels) and mmcp6−/− (bottom panels) mice administered saline (left panels) or imiquimod (right panels). Scale bars, 200 µm. m Quantification of apoptotic cells (n = 6 mice per group). n Transpulmonary resistance of saline- or imiquimod-administered WT and mmcp6−/− mice (n = 6 mice per group). All data are presented as means ± s.e.m. For panel a, statistical differences were determined by two-tailed Mann–Whitney test. For rest of panels, statistical analysis was performed using one-way ANOVA with Bonferroni’s multiple comparison test. Source data are provided as a Source Data file.
Fig. 6
Fig. 6. Challenge with human tryptase-β induces inflammation and experimental COPD.
Mice (6–8 weeks old, female) were challenged with recombinant human tryptase-β (20 μg in 50 μL PBS/mouse) intranasally for 7 days, control mice received equal volumes of PBS. Tryptase-β challenge increased the influx of a total leukocytes, b macrophages and c neutrophils in the airways (bronchoalveolar lavage fluid, BALF, n = 5 per group). d Lung sections were stained with hematoxylin and eosin (H&E, scale bar = 50 um), and e alveolar diameter was assessed using the mean linear intercept as a measure of emphysema. f Lung function, in terms of elastance (Ers, n = 5 mice per group). Results are mean ± s.e.m. Statistical analysis was performed using the two-tailed Mann–Whitney test. Source data are provided as a Source Data file.
Fig. 7
Fig. 7. Treatment with a mast cell degranulation stabilizer completely inhibits the development of experimental COPD and increases in the levels of mast cell tryptase.
Wild-type BALB/c mice (6–8 weeks old, female) were exposed to cigarette smoke (CS) for 8 weeks and treated with disodium cromoglycate (DSCG) intranasally from weeks 6–8. control mice received equal volumes of vehicle. DSCG completely inhibited the development of chronic airway inflammation, emphysema and impaired lung function in CS exposed mice. a Total leukocyte, b macrophage and c neutrophil numbers in bronchoalveolar lavage fluid (BALF) after 8 weeks of CS exposure (n = 8 per group). d Lung sections were stained with hematoxylin and eosin (scale bar = 50 μm), and e alveolar diameter was assessed as a measure of emphysema (n = 8 per group). f Lung function, in terms of transpulmonary resistance (n = 8 per group). g mMCP6 protein was assessed in whole mouse lung tissues by immunoblot (n = 8 per group), and h fold change of densitometry analysis of mMCP6 protein was normalized to β-actin. Results are mean ± s.e.m, Statistical differences were determined using one-way ANOVA followed by Bonferroni post-test. Source data are provided as a Source Data file.
Fig. 8
Fig. 8. Imiquimod induces the release of mast cell tryptase from human mast cells.
a Representative micrographs (top panels, n = 3) and color deconvolution of isotype control (left panels) and TLR7 (right panels) immunostaining of HMC-1 human mast cells. Scale bars, 50 µm. b Representative micrographs (top panels, n = 3) and color deconvolution (bottom panels) of isotype control (left panel) and mast cell tryptase (right panels) immunostaining of HMC-1 cells incubated with media or imiquimod (5, 10 or 100 ng) for 1 h, Scale bars, 50 µm. Quantification of mast cell tryptase in cells (10 random fields per sample, n = 3 per group) normalized to c number of cells or d area of hematoxylin of HMC-1 cells incubated with media or imiquimod (5, 10 or 100 ng) for 1 h. e Quantification of mast cell tryptase activity (n = 6 per group) in terms of p-nitroaniline levels in culture supernatants from HMC-1 cells incubated with media or imiquimod (5, 10, or 100 ng) for 1 h. Throughout, data are presented as means ± s.e.m. Statistical analysis was performed using one-way ANOVA with Bonferroni’s multiple comparison test. Source data are provided as a Source Data file.
Fig. 9
Fig. 9. Therapeutic treatment with anti-TLR7 monoclonal antibody reduces CS-induced emphysema and mast cell influx in experimental COPD.
a Wild-type (WT) BALB/c mice (female, 6–8 weeks old) were exposed to normal air or CS for 8 weeks and treated with neutralizing anti-TLR7 monoclonal antibody or isotype control, intravenously (i.v.) once per week for 2 weeks, from weeks 6–8. b Quantification of destructive index (n = 6 mice per group) in lungs of isotype- or anti-TLR7-treated WT mice exposed to normal air or CS for 8 weeks. c Quantification of mean linear intercept (n = 6 mice per group) of isotype or anti-TLR7 -treated WT mice exposed to normal air or CS for 8 weeks. d Quantification of apoptotic cells (n = 6 mice per group) in TUNEL-stained lung sections from isotype or anti-TLR7 treated WT mice exposed to normal air or CS for 8 weeks. Quantification of e small airway epithelial cell area per µm of basement membrane (BM) perimeter and f nuclei numbers per 100 µm of BM perimeter of isotype- or anti-TLR7-treated WT mice exposed to normal air or CS for 8 weeks (4 small airways per mouse, n = 6 mice per group). g Transpulmonary resistance of isotype- or anti-TLR7-treated WT mice exposed to normal air or CS for 8 weeks (n = 6 mice per group). h Quantification of mast cells in lung sections from isotype- or anti-TLR7-treated WT mice exposed to normal air or CS for 8 weeks (n = 6 mice per group). i Quantification of mast cells in lung sections from WT and Tlr7−/− mice exposed to normal air or CS for 8 weeks (n = 6 mice per group). j WT BALB/c mice (female, 6–8 weeks old) were exposed to normal air or CS for 12 weeks and treated with neutralizing anti-TLR7 monoclonal antibody or isotype control, i.v. once per week, from weeks 8–12 (for 4 weeks). Some mice had CS cessation others continued CS exposure after 8 weeks prior to anti-TLR7 treatment. k Quantification of destructive index, l mean linear intercept and m apoptotic cells (n = 6 mice per group) in lungs of isotype- or anti-TLR7-treated WT mice exposed to normal air or CS with CS cessation or continued CS exposure from 8–12 weeks. Quantification of n small airway epithelial cell area per µm of basement membrane (BM) perimeter and o nuclei numbers per 100 µm of BM perimeter of isotype- or anti-TLR7-treated WT mice exposed to normal air or CS with CS cessation or continued CS exposure from 8–12 weeks (4 small airways per mouse, n = 6 mice per group). p Measurement of diffusing lung capacity for carbon monoxide (DLCO) of isotype- or anti-TLR7-treated WT mice exposed to normal air or CS with CS cessation or continued CS exposure from 8–12 weeks (n = 6 mice per group). q Quantification of mast cells in lung sections from isotype- or anti-TLR7-treated WT mice exposed to normal air or CS with CS cessation or continued CS exposure from 8–12 weeks (n = 6 mice per group). r Schematic representation of proposed mechanisms of how TLR7 contributes to CS-induced apoptosis and emphysema-like alveolar enlargement in experimental COPD in a mast cell-specific tryptase-dependent manner. All data are presented as means ± s.e.m. Statistical analysis was performed using one-way ANOVA with Bonferroni’s multiple comparison test. Source data are provided as a Source Data file.

References

    1. Lozano R, et al. Global and regional mortality from 235 causes of death for 20 age groups in 1990 and 2010: a systematic analysis for the Global Burden of Disease Study 2010. Lancet. 2012;380:2095–2128. doi: 10.1016/S0140-6736(12)61728-0. - DOI - PMC - PubMed
    1. Han MK, et al. Chronic obstructive pulmonary disease phenotypes: the future of COPD. Am. J. Respir. Crit. Care Med. 2010;182:598–604. doi: 10.1164/rccm.200912-1843CC. - DOI - PMC - PubMed
    1. Keely S, Talley NJ, Hansbro PM. Pulmonary-intestinal cross-talk in mucosal inflammatory disease. Mucosal Immunol. 2012;5:7–18. doi: 10.1038/mi.2011.55. - DOI - PMC - PubMed
    1. Miller M, et al. Persistent airway inflammation and emphysema progression on CT scan in ex-smokers observed for 4 years. Chest. 2011;139:1380–1387. doi: 10.1378/chest.10-0705. - DOI - PMC - PubMed
    1. Willemse BW, Postma DS, Timens W, ten Hacken NH. The impact of smoking cessation on respiratory symptoms, lung function, airway hyperresponsiveness and inflammation. Eur. Respir. J. 2004;23:464–476. doi: 10.1183/09031936.04.00012704. - DOI - PubMed

Publication types

Associated data