. 2023 Nov 14;14(1):7237.
doi: 10.1038/s41467-023-42056-1.

Mechanical loading and hyperosmolarity as a daily resetting cue for skeletal circadian clocks

Affiliations

Mechanical loading and hyperosmolarity as a daily resetting cue for skeletal circadian clocks

Michal Dudek et al. Nat Commun. .

Abstract

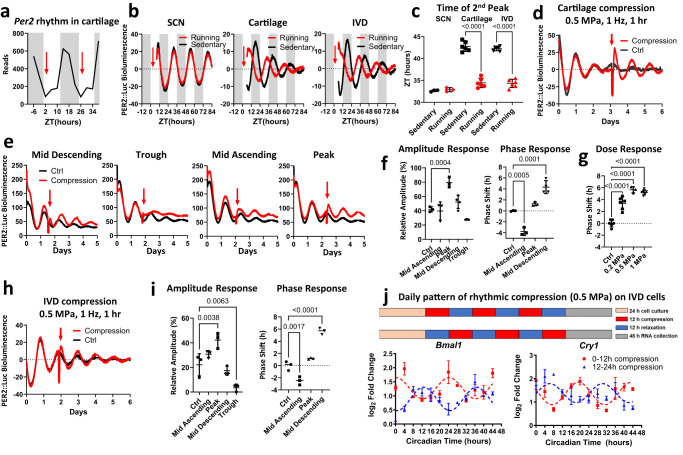
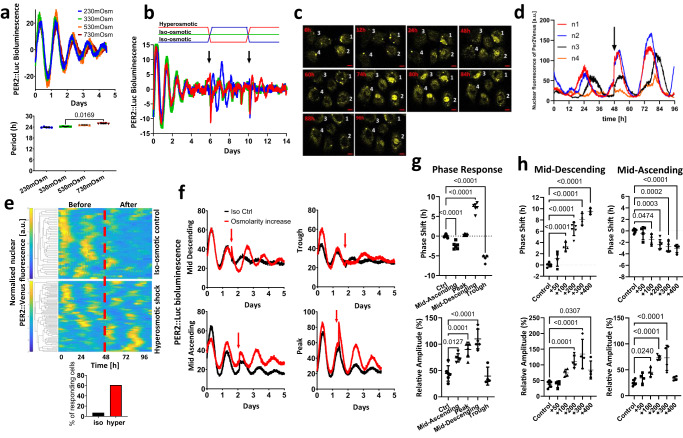
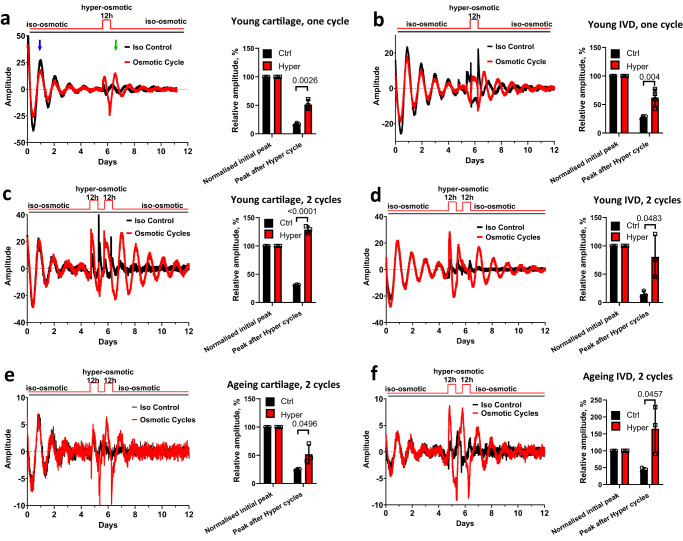
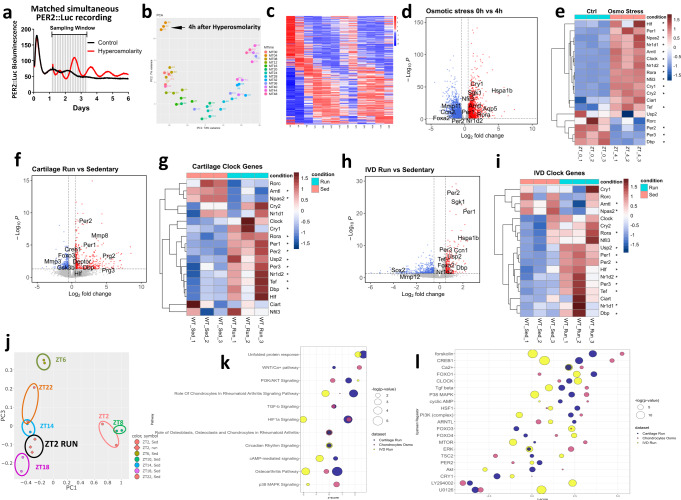
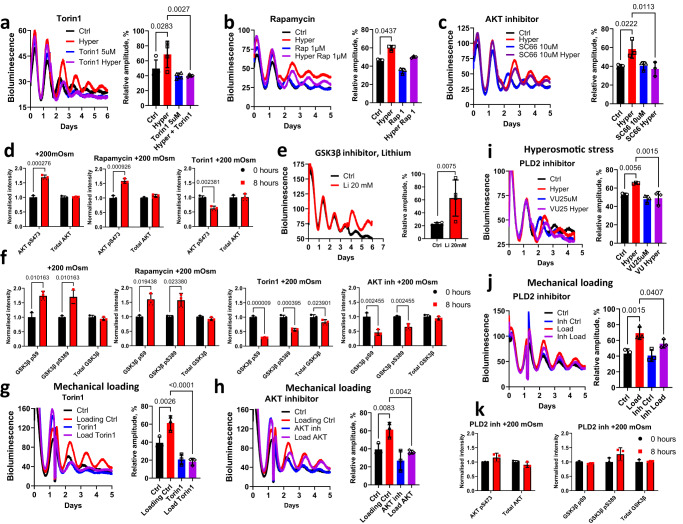
Daily rhythms in mammalian behaviour and physiology are generated by a multi-oscillator circadian system entrained through environmental cues (e.g. light and feeding). The presence of tissue niche-dependent physiological time cues has been proposed, allowing tissues the ability of circadian phase adjustment based on local signals. However, to date, such stimuli have remained elusive. Here we show that daily patterns of mechanical loading and associated osmotic challenge within physiological ranges reset circadian clock phase and amplitude in cartilage and intervertebral disc tissues in vivo and in tissue explant cultures. Hyperosmolarity (but not hypo-osmolarity) resets clocks in young and ageing skeletal tissues and induce genome-wide expression of rhythmic genes in cells. Mechanistically, RNAseq and biochemical analysis revealed the PLD2-mTORC2-AKT-GSK3β axis as a convergent pathway for both in vivo loading and hyperosmolarity-induced clock changes. These results reveal diurnal patterns of mechanical loading and consequent daily oscillations in osmolarity as a bona fide tissue niche-specific time cue to maintain skeletal circadian rhythms in sync.


Conflict of interest statement

The authors declare no competing interests.

Figures

Fig. 1
Fig. 1. Mechanical loading resets the circadian clock in PER2::Luc cartilage and IVDs in vivo and ex vivo.
a Per2 mRNA expression in mouse hip cartilage from RNAseq timeseries. Gray background denotes night (mouse active phase), red arrows indicate timing of treadmill running in relation to circadian phase. b PER2::Luc bioluminescence from mouse tissues after treadmill running (red) and sedentary control (black). Red arrow indicates time of exercise (ZT2, i.e. 2 h into resting phase). Each trace represents the mean of 3 (SCN) and 6 (cartilage, IVD) explants. c Quantification of phase shift between running and sedentary mice in B. d Bioluminescence recordings of PER2::Luc femoral head cartilage explants. Red arrow indicates time of ex vivo compression (0.5 MPa, 1 Hz, 1 h). Each trace represents the mean of 3 explants. e Recordings of PER2::Luc cartilage explants subjected to mechanical loading (red arrow) at 6 h intervals, starting at mid-descending phase. Each trace is the mean of 4 explants. f Quantification of the PER2::Luc amplitude change in (e), expressed as % of the amplitude of the peak before loading and quantification of phase shifts in (e). g Quantification of phase shifts in cartilage exposed to increasing magnitude of compression applied at mid descending phase (n = 6 per condition). h Recordings of PER2::Luc IVDs subjected to compression (0.5 MPa, 1 Hz, 1 h). Each trace is the mean of 3 explants. i Quantification of the PER2::Luc amplitude change and phase shifts. j mRNA expression of Bmal1 and Cry1 in a rat IVD cell line following 3 cycles of oppositely phased compression (12 h at 0.5 MPa /12 h at 0 MPa). Mean ± SD of 3 cultures with 24-h cosinor curve fitting to highlight the anti-phasic nature of the gene expression profiles following the oppositely phased loading cycles. Statistical analysis was performed using one-way ANOVA. P values were adjusted for multiple comparisons using Dunnett’s multiple comparisons test. Source data are provided as a Source Data file.
Fig. 2
Fig. 2. Hyperosmolarity resets the circadian clock in IVDs and cartilage in a phase and dose dependent manner.
a Oscillations and period of PER2::Luc IVD explants cultured in varying baseline osmotic conditions. Mean ± SD, n = 5. b Oscillations of PER2::Luc cartilage with media changes. Conditioned media were swapped between explants in iso- and hyper- osmotic conditions on day 6, then swapped back on day 10. Control cultures were undisturbed (n = 3). c Confocal microscopy images of representative mouse articular chondrocytes expressing PER2::Venus (displayed in hours at indicated times). Cells were cultured under normal osmolarity conditions for 48 h, after which osmolarity was increased by +200 mOsm using sorbitol. Scale bar 20 μm. d Individual nuclear PER2::Venus trajectories of 4 single cells from (c) were plotted in the graph. e Heat maps of PER2::Venus single-cell trajectories before and after hyperosmotic treatment normalized to the area under the curve of the first 48 h. The red dotted line indicates time of treatment. Cells were monitored for up to 96 h, n = 78 cells per condition. Bottom bar graph shows the percentage of cells in the cell population responding to osmotic treatment. A cell was classified as responding if the amplitude of the peak following treatment was higher than the amplitude of the peak preceding the treatment. f Effects of hyperosmolarity (+200 mOsm, applied at 6 h intervals indicated by red arrow) on PER2::Luc IVD oscillations (n = 6). g Quantification of phase shift and amplitude induction in (f). h Quantification of dose-dependent phase shift and amplitude induction in IVD explants treated with increasing osmolarity (+50 to +400 mOsm) at mid-descending and mid-ascending phase of PER2::Luc oscillation (n = 4). Statistical analysis was performed using one-way ANOVA. P values were adjusted for multiple comparisons using Dunnett’s multiple comparisons test. Source data are provided as a Source Data file.
Fig. 3
Fig. 3. Osmotic cycles synchronize circadian clocks in young and aging cartilage and IVDs.
a, b Effects of one cycle of osmotic changes on PER2::Luc cartilage explants (a) and IVDs (b) from 2-month old mice. At day 6 explants were exposed to 12 h of +100 mOsm hyperosmotic medium then returned to iso-osmotic media. The amplitude of the peak after osmotic cycle (green arrow) was quantified as % of the peak 24 h after start of recording (blue arrow). cf Effects of two cycles of hyperosmotic challenges (12 h of +200 mOsm/12 h of iso-osmotic media) on cartilage (c, e) and IVDs (d, f) from 2-month old (c, d) or 12-month old (e, f) PER2::Luc mice. n = 3 in all experiments except 3b n = 4. Statistical analysis was performed using two-tailed unpaired t test. Bars represent mean and SD. Source data are provided as a Source Data file.
Fig. 4
Fig. 4. Hyperosmolarity and treadmill running induce transcriptome-wide changes in gene expression.
a Bioluminescence recording of primary chondrocytes isolated from PER2::Luc mice. Cells were not synchronized at the beginning of the experiment. After 30 h, media osmolarity was increased by +200 mOsm. Parallel samples were harvested every 4 h for RNA isolation and RNAseq analysis. b Principal component analysis (PCA) showing a correlation between RNAseq replicates and a developing trend over time. c Heatmap showing gene expression patterns of 254 rhythmic genes (BHQ < 0.05) following increase of osmolarity. d Volcano plot showing differentially expressed genes between timepoint 0 (T0) and 4 h (T4) after osmotic stress. 630 were up regulated and 927 downregulated at Adj p < 0.05 and Log2FC = 1 cut off. e Heatmap of circadian clock genes at T0 and T4 after osmotic stress. *p < 0.05. fi Volcano plot showing differentially expressed genes between sedentary and treadmill running mice in cartilage (f) and IVD (h) at Adj p < 0.05 and Log2FC = 0.5 cut off. Heatmaps depicts circadian clock genes in cartilage (g) and IVDs (i) from sedentary and treadmill-running mice. The asterisk denotes significant changes, *p < 0.05. j PCA of treadmill-regulated rhythmic genes at ZT2 vs. circadian time series rhythmic genes in cartilage. k, l Bubble plots showing significant canonical pathways (k) and upstream regulators (l) by Ingenuity Pathway Analysis in RNAseq datasets from osmotic stress (0 h vs. 4 h) and treadmill exercise (running vs. sedentary cartilage and IVD). P values were adjusted for multiple comparisons from DESeq2 (di) and IPA analysis (k, l) were used to generate the plots. Source data are provided in Supplementary Data.
Fig. 5
Fig. 5. The PLD2-mTORC2-AKT-GSK3β pathway is a convergent mechanism mediating the loading and hyperosmolarity elicited clock entrainment.
ac Effects of mTORC1/2 inhibitor Torin1 (a), mTORC1 inhibitor Rapamycin (b) and AKT inhibitor SC66 (c) on blocking the hyperosmolarity (+200 mOsm) -induced clock amplitude in PER2::Luc cartilage explants. d WB quantification showing the effect of Rapamycin or Torin1 on total and phosphorylation levels of AKT at Ser473 in mouse primary chondrocytes 8 h after increased osmolarity. e Bioluminescence recording and amplitude quantification of PER2::Luc IVD explants treated with 20 mM lithium (an inhibitor of GSK3β). f Effects of Torin1, Rapamycin and the AKT inhibitor SC66 on blocking the hyperosmolarity-induced phosphorylation of GSK3β at Ser9 and Ser379 in mouse primary chondrocytes. g, h Effects of Torin1 (g) and SC66 (h) on blocking the loading (0.5 MPa, 1 Hz, 1 h) induced clock amplitude change in PER2::Luc cartilage explants. i, j Effect of PLD2 inhibitor on blocking osmolarity (i) and mechanical loading (j) induced increase in PER2::Luc bioluminescence in mouse cartilage. k WB quantification showing the effect of PLD2 inhibitor pre-treatment on total and phosphorylation levels of AKT (at Ser473) and GSK3β (at Ser9 and Ser379) in mouse primary chondrocytes 8 h after increased osmolarity. n = 3 in all bioluminescence recording experiments except an n = 4. Statistical analysis was performed using one-way ANOVA for (ac, gi, j) (P values were adjusted for multiple comparisons using Dunnett’s multiple comparisons test) and Two-tailed unpaired t test for (df, k). Source data are provided as a Source Data file.

References

    1. Reppert SM, Weaver DR. Coordination of circadian timing in mammals. Nature. 2002;418:935–941. doi: 10.1038/nature00965. - DOI - PubMed
    1. Takahashi JS. Transcriptional architecture of the mammalian circadian clock. Nat. Rev. Genet. 2017;18:164–179. doi: 10.1038/nrg.2016.150. - DOI - PMC - PubMed
    1. Hastings MH, Reddy AB, Maywood ES. A clockwork web: circadian timing in brain and periphery, in health and disease. Nat. Rev. Neurosci. 2003;4:649–661. doi: 10.1038/nrn1177. - DOI - PubMed
    1. Cederroth CR. Medicine in the fourth dimension. Cell Metab. 2019;30:238–250. doi: 10.1016/j.cmet.2019.06.019. - DOI - PMC - PubMed
    1. Zeng H, Qian Z, Myers MP, Rosbash M. A light-entrainment mechanism for the Drosophila circadian clock. Nature. 1996;380:129–135. doi: 10.1038/380129a0. - DOI - PubMed

Publication types

LinkOut - more resources