. 2023 Nov 14;14(1):7346.
doi: 10.1038/s41467-023-43158-6.

CHEX-seq detects single-cell genomic single-stranded DNA with catalytical potential

Affiliations

CHEX-seq detects single-cell genomic single-stranded DNA with catalytical potential

Youtao Lu et al. Nat Commun. .

Abstract

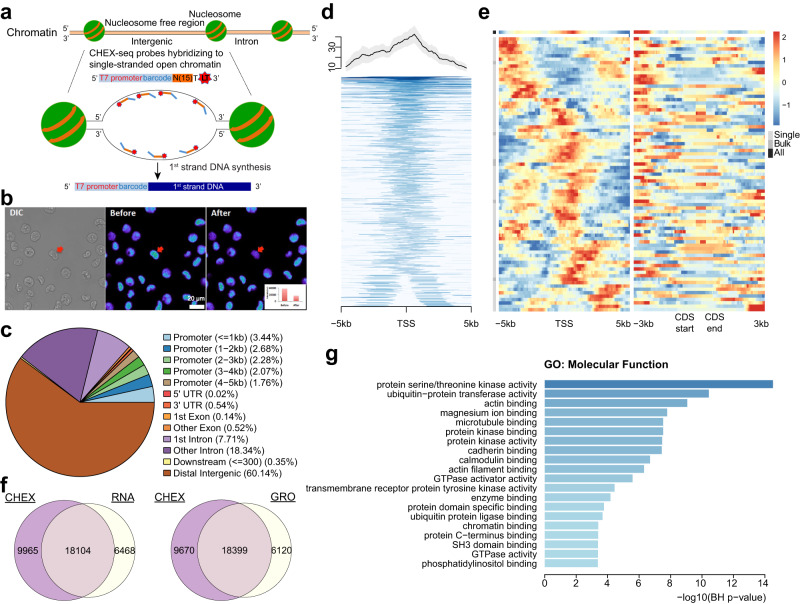
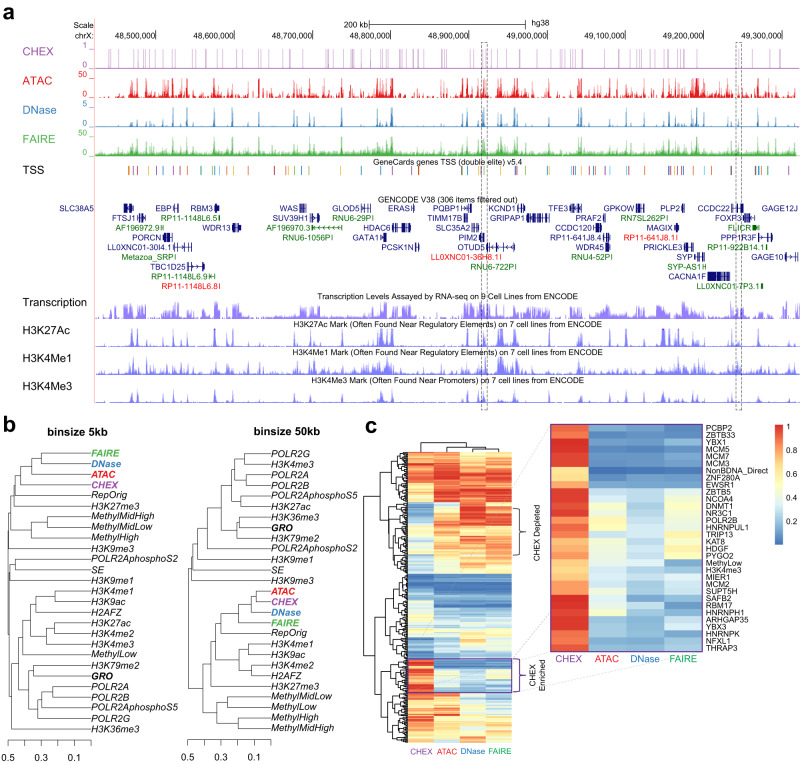
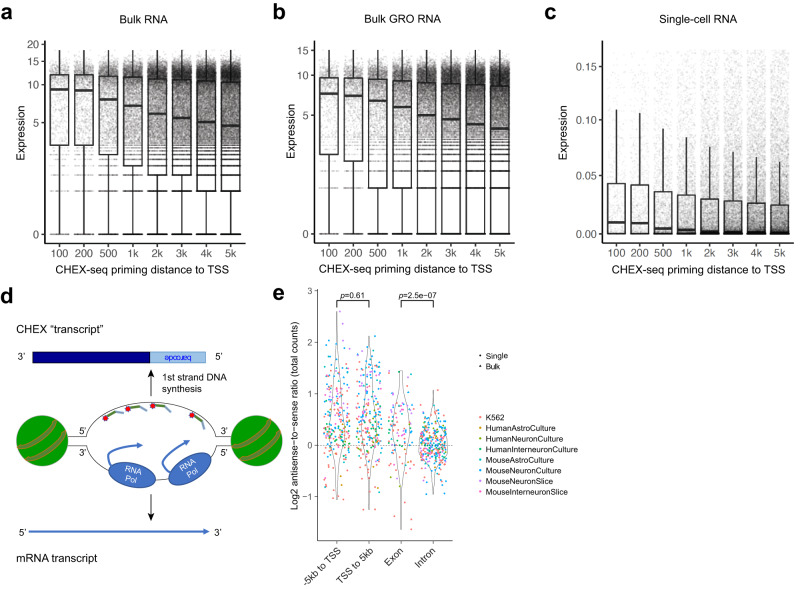
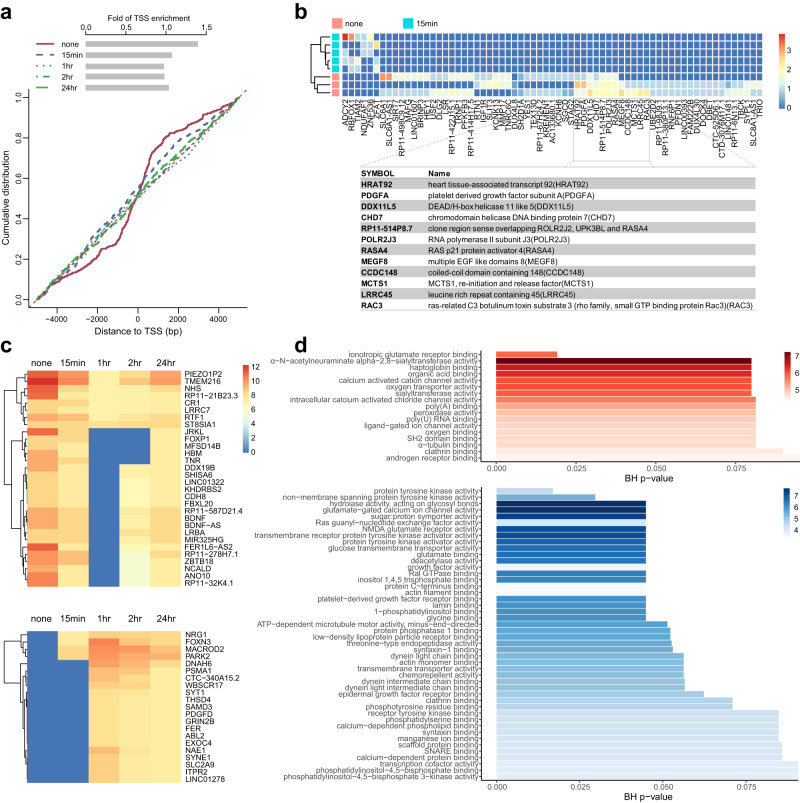
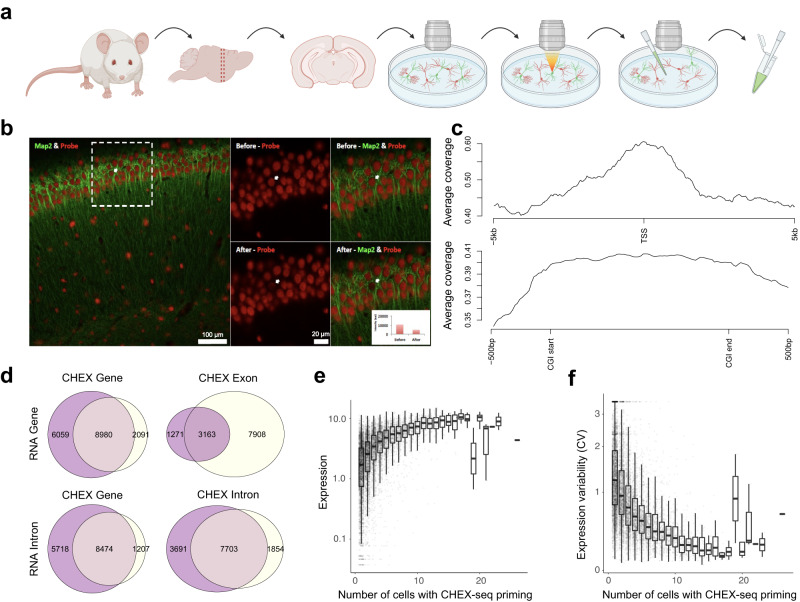
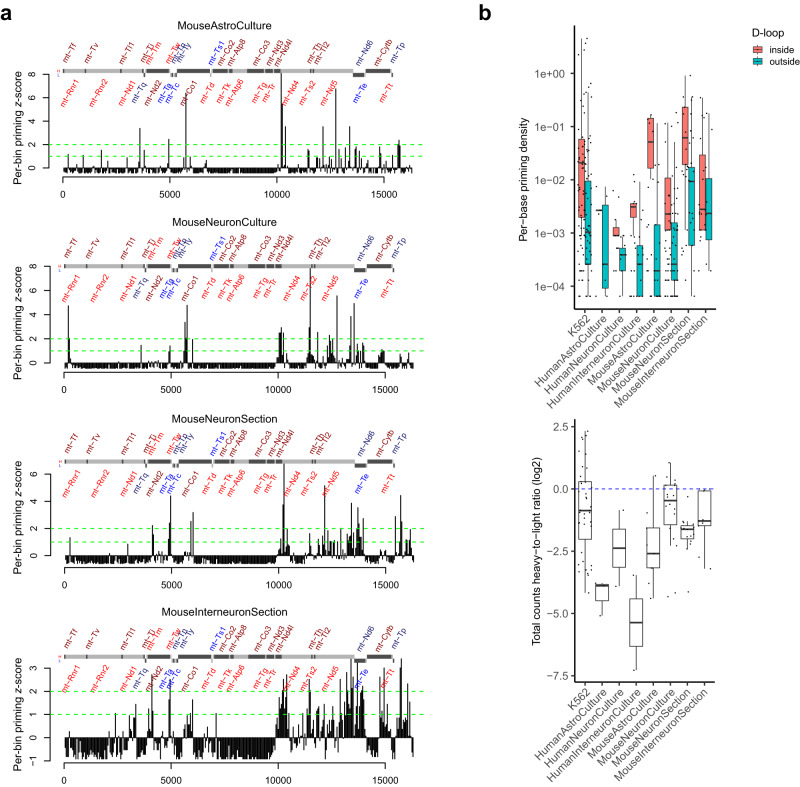
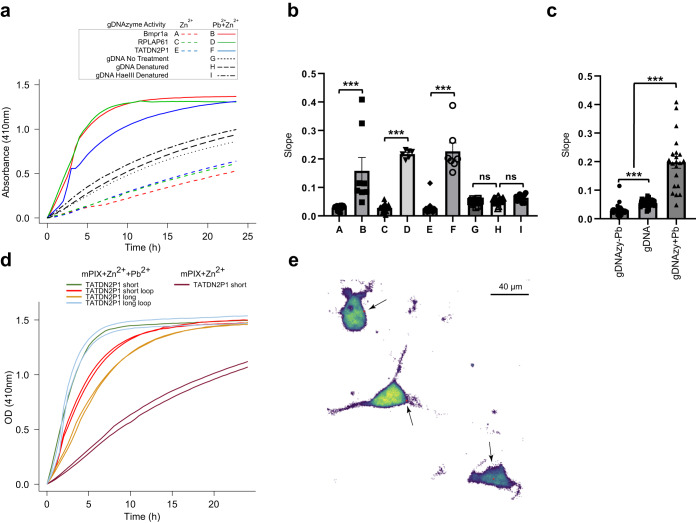
Genomic DNA (gDNA) undergoes structural interconversion between single- and double-stranded states during transcription, DNA repair and replication, which is critical for cellular homeostasis. We describe "CHEX-seq" which identifies the single-stranded DNA (ssDNA) in situ in individual cells. CHEX-seq uses 3'-terminal blocked, light-activatable probes to prime the copying of ssDNA into complementary DNA that is sequenced, thereby reporting the genome-wide single-stranded chromatin landscape. CHEX-seq is benchmarked in human K562 cells, and its utilities are demonstrated in cultures of mouse and human brain cells as well as immunostained spatially localized neurons in brain sections. The amount of ssDNA is dynamically regulated in response to perturbation. CHEX-seq also identifies single-stranded regions of mitochondrial DNA in single cells. Surprisingly, CHEX-seq identifies single-stranded loci in mouse and human gDNA that catalyze porphyrin metalation in vitro, suggesting a catalytic activity for genomic ssDNA. We posit that endogenous DNA enzymatic activity is a function of genomic ssDNA.


Conflict of interest statement

The Authors declare the following competing interests. J.E., J.Y.K., Y.L., S.F., J. Li, are co-inventors on a published patent application (20200216841) covering the CHEX-seq technology applied for by the University of Pennsylvania and Agilent Technologies. J.E., Y.L., J.Y.K., S.R.A., S.V. are co-inventors on a provisional patent application (63/511,984) covering gDNAzymes applied for by the University of Pennsylvania. The remaining authors declare no competing interests. This work was funded in part by NIH U01MH098953 (J.E., J.K.) and RM1HG010023 (J.K., J.E.), and by R01MH110185 (S.A).

Figures

Fig. 1
Fig. 1. CHEX-seq experimental design, K562 priming location characterization, and overlap with K562 transcriptome.
a Schematic of CHEX-seq assay; b Photoactivation at a specific site in the nucleus of K562; inset shows reduction in fluorescence upon photoactivation for a single nucleus but has been done every time the CHEXseq probe is activated in a single dispersed cell, n > 100. c Statistics of CHEX-seq priming sites with respect to genomic regions; d TSS proximal (+/− 5 kb) coverage of K562 samples (all positive non-outlier samples aggregated, top 1%-tile genes shown); the shade presents the mean ± SEM; e Z-scored coverage at TSS (+/−5kb) and CDS (+/−3kb) proximity at single-cell level; Single: single-cell samples, Bulk: multi-cell samples, All: aggregates of Single and Bulk; f Overlap between CHEX-seq primed genes (extended gene body > 0) and RNA-seq highly expressed genes (counts > median); g GO functional enrichment results (top 20 significant terms) of the CHEX-RNA overlapping genes (f, left), x-axis, -log10 of the p-value from hypergeometric test after Benjamini-Hochberg correction.
Fig. 2
Fig. 2. Genomic comparison of CHEX-seq with other open-chromatin assays (ATAC-, DNase-, FAIRE-seq), transcriptome (GRO-seq), and epigenomes (RRBS DNA methylation, histone modifications, super enhancer [SE]).
a UCSC Genome Browser track view comparing the coverage of CHEX- (purple) against ATAC- (red), DNase- (blue) and FAIRE-seq (green) at locus OTUD5. Below four assays is the GeneCards TSS track. The last four tracks are transcriptome and three histone marks. Dashed-line boxes highlight two loci shared by all four open-chromatin assays; b Hierarchical clustering of open-chromatin assays, transcriptome, and epigenomes at 5 kb (left) or 50 kb (right) resolution, using binarized coverage and Jaccard distance; c Hierarchical clustering of CHEX-, ATAC-, DNase- and FAIRE-seq by the similarity with an extended set of 284 K562 epigenomes. Color indicates quantile normalized fold of enrichment given a particular assay (0 means the lowest enrichment and 1 means the highest enrichment).
Fig. 3
Fig. 3. Expression levels of genes with TSS priming stratified by the distance to TSS (maximum 2.5 kb to either direction).
a Bulk K562 RNA-seq; b Bulk K562 GRO-seq; c K562 scRNA-seq, single cells aggregated. Y-axis, gene expressions (capped at 90%-tile); x-axis, distance (bp) to TSS from CHEX-seq priming sites; n = 81 biologically independent samples. The bounds of the box represent the 1st and the 3rd quartile; the thick bar represents the median; the whiskers extend 1.5 times the interquartile range (IQR); the dots represent all data points including maxima and minima. de CHEX-seq unique property: detecting open chromatin’s strandedness. d Schematic showing the hypothesis that CHEX-seq reads should have opposite strandedness than sense-strand mRNA transcripts; e Testing the hypothesis in (d). X-axis, sub-genic regions; y-axis, ratio of the number of antisense-stranded over sense-stranded CHEX-seq reads, samples with less than 5 counts discarded; significance by Wilcoxon rank-sum test (two-sided).
Fig. 4
Fig. 4. TPA-induced dynamics in distribution of ssDNA throughout the genome.
a Changes in the distribution of CHEX-seq priming location (relative to TSS) upon TPA perturbation. Y-axis: cumulative empirical distribution of CHEX-seq priming sites with the distance to TSS; x-axis: distance to TSS (bp); b Differentially primed genes in acute response to TPA treatment. The heatmap color indicates the priming counts in log2; c Genes losing (top) or gaining (bottom) TSS single-strandedness in concert to the TSS enrichment changes. The heatmap color indicates the priming counts in log2. d Top 50 GO (Molecular Function) terms enriched in the genes losing TSS single-strandedness; significance by hypergeometric test.
Fig. 5
Fig. 5. CHEX-seq applied to mouse neuronal samples (fixed tissue section and dispersed culture).
a Schematic of CHEX-seq applied to mouse brain tissue section using cell-specific markers; b Photoactivation of CHEX-seq probes (red) at single neuronal cell stained with the marker Map2 (green) in mouse brain section; inset shows reduction in fluorescence upon photoactivation for a single nucleus but has been done every time the CHEX-seq probe is activated on tissue sections, n > 30. c TSS ( ± 5 kb) (top) and CpG island flanking (±500 bp) (bottom) CHEX-seq coverage in mouse brain section; d Overlap between CHEX-seq primed genes (>0) and RNA-seq highly expressed genes (counts > median). Rows are RNA-seq in whole gene body or intronic regions, columns are CHEX-seq in whole gene body, exonic or intronic regions. e Correlation between CHEX-seq intronic priming frequency and transcriptional activity (RNA-seq intronic counts) in mouse brain section, n = 26 biologically independent cells; f Correlation between CHEX-seq intronic priming frequency and transcriptional variability (RNA-seq intronic counts) in mouse brain section, n = 26 biologically independent cells. The bounds of the box represent the 1st and the 3rd quartile; the thick bar represents the median; the whiskers extend 1.5 times the IQR; the dots represent all data points including maxima and minima.
Fig. 6
Fig. 6. CHEX-seq unveiling the mitochondrial ssDNA in mouse brain.
a Mitochondrial single-stranded hotspots found in mouse astrocytes and neurons in primary cultures, and mouse neuron and interneuron in brain sections. X-axis: coordinate (bp) of the mitochondrial genome; y-axis: per-bin priming counts (z-scored, bin size 50 bp). Green dashed lines highlight where z-score equals to 1 or 2. The red font indicates the heavy-strand genes (upper gray boxes), and the blue font indicates the light-strand genes (lower gray boxes); the dark-light alternating font color corresponds to the shade of the gray boxes, to make adjacent genes more discernible; b Top: CHEX-seq priming density (y-axis) inside (red) or outside (green) the D-loop; bottom: CHEX-seq priming bias as measured as the ratio of the heavy-strand counts to the light-strand counts (y-axis); n = 81, 7, 12, 20, 38, 114, 28, 21 biologically independent samples for each group (left to right), respectively. The bounds of the box represent the 1st and the 3rd quartile; the thick bar represents the median; the vertical line extends 1.5 times the IQR; the dots represent all data points including maxima and minima.
Fig. 7
Fig. 7. Genomic ssDNA regions can catalyze porphyrin metalation in vitro.
a Insertion of Zn2+ into mesoporphyrin IX (mPIX) catalyzed by candidate ssDNA regions of human or mouse gDNA. The plots represent the time course of the absorbance at 410 nm corresponding to the characteristic peak (Soret band) of Zn-mPIX (normalized by the porphyrin concentration). Spectra were captured every 30 min. Solid line: Zn2++Pb2+, dashed line: Zn2+ only. Red: Bmpr1a (A,B), green: RPL7AP61 (C,D), blue: TATDN2P1 (E,F); native gDNA (G), denatured gDNA (H), denatured HaeIII cut gDNA (I); b Slopes of catalytic activity curves. Data are presented as mean ± SEM. Wilcoxon rank-sum test (two-sided). ns, not significant. ***, p < 0.001, 3 independent experiments; c Comparison of catalytic activity slopes for gDNAzyme w/ and w/o Pb2+ cofactor, and mouse genomic DNA. Data are presented as mean ± SEM. Wilcoxon rank-sum test (two-sided). ***, p < 0.001, n = 3 independent experiments; d Catalytic activity of TATDN2P1 DNAzyme in various conformations. Green: single-stranded short sequence, Orange: single-stranded long sequence, Red: long sequence constrained to form a short loop, Blue: long sequence constrained to form a long loop; Dark red: single-stranded short sequence but w/o Pb2+; e Mouse cortical neurons in primary cell culture interrogated with FRET-FISH. Black arrows point to the single-stranded DNA areas that contain sequences capable of acting catalytically from the Bmpr1a locus identified by FRET-FISH signal which are visualized with pseudo-colored red dots that are on the periphery of neuronal nucleus. Calibration bar = 20 μm.

Similar articles

Cited by

References

    1. Kouzine F, et al. Permanganate/S1 Nuclease Footprinting Reveals Non-B DNA Structures with Regulatory Potential across a Mammalian Genome. Cell Syst. 2017;4:344–356.e7. doi: 10.1016/j.cels.2017.01.013. - DOI - PMC - PubMed
    1. Sharma S. Non-B DNA Secondary Structures and Their Resolution by RecQ Helicases. J. Nucleic Acids. 2011;2011:724215. doi: 10.4061/2011/724215. - DOI - PMC - PubMed
    1. Bieberstein NI, Carrillo Oesterreich F, Straube K, Neugebauer KM. First exon length controls active chromatin signatures and transcription. Cell Rep. 2012;2:62–68. doi: 10.1016/j.celrep.2012.05.019. - DOI - PubMed
    1. Barnes CO, et al. Crystal Structure of a Transcribing RNA Polymerase II Complex Reveals a Complete Transcription Bubble. Mol. Cell. 2015;59:258–269. doi: 10.1016/j.molcel.2015.06.034. - DOI - PMC - PubMed
    1. Zhou Y, Paull TT. Direct measurement of single-stranded DNA intermediates in mammalian cells by quantitative polymerase chain reaction. Anal. Biochem. 2015;479:48–50. doi: 10.1016/j.ab.2015.03.025. - DOI - PubMed

Publication types