. 2023 Nov 14;14(1):7013.
doi: 10.1038/s41467-023-42551-5.

Evidence of an upper ionospheric electric field perturbation correlated with a gamma ray burst

Mirko Piersanti #  1   2 Pietro Ubertini #  3 Roberto Battiston #  4   5 Angela Bazzano #  3 Giulia D'Angelo #  3 James G Rodi #  3 Piero Diego #  3 Zhima Zeren  6 Roberto Ammendola  7 Davide Badoni  7 Simona Bartocci  7 Stefania Beolè  8 Igor Bertello  3 William J Burger  5 Donatella Campana  9 Antonio Cicone  3   10 Piero Cipollone  7 Silvia Coli  8 Livio Conti  7   11 Andrea Contin  12   13 Marco Cristoforetti  5   14 Fabrizio De Angelis  3 Cinzia De Donato  7 Cristian De Santis  7 Andrea Di Luca  4   5 Emiliano Fiorenza  3 Francesco Maria Follega  4   5 Giuseppe Gebbia  4   5 Roberto Iuppa  4   5 Alessandro Lega  4   5 Mauro Lolli  13 Bruno Martino  3   15 Matteo Martucci  7 Giuseppe Masciantonio  7 Matteo Mergè  7   16 Marco Mese  9   17 Alfredo Morbidini  3 Coralie Neubüser  5 Francesco Nozzoli  5 Fabrizio Nuccilli  3 Alberto Oliva  12   13 Giuseppe Osteria  9 Francesco Palma  7 Federico Palmonari  12   13 Beatrice Panico  9   17 Emanuele Papini  3 Alexandra Parmentier  3   7 Stefania Perciballi  8 Francesco Perfetto  9 Alessio Perinelli  4   5 Piergiorgio Picozza  7   18 Michele Pozzato  13 Gianmaria Rebustini  7 Dario Recchiuti  3   4 Ester Ricci  4   5 Marco Ricci  19 Sergio B Ricciarini  20 Andrea Russi  3 Zuleika Sahnoun  13 Umberto Savino  8 Valentina Scotti  9   17 Xuhui Shen  21 Alessandro Sotgiu  7 Roberta Sparvoli  7   18 Silvia Tofani  3 Nello Vertolli  3 Veronica Vilona  4 Vincenzo Vitale  7 Ugo Zannoni  3 Simona Zoffoli  16 Paolo Zuccon  4   5
Affiliations

Evidence of an upper ionospheric electric field perturbation correlated with a gamma ray burst

Mirko Piersanti et al. Nat Commun. .

Erratum in

  • Author Correction: Evidence of an upper ionospheric electric field perturbation correlated with a gamma ray burst.
    Piersanti M, Ubertini P, Battiston R, Bazzano A, D'Angelo G, Rodi JG, Diego P, Zeren Z, Ammendola R, Badoni D, Bartocci S, Beolè S, Bertello I, Burger WJ, Campana D, Cicone A, Cipollone P, Coli S, Conti L, Contin A, Cristoforetti M, De Angelis F, De Donato C, De Santis C, Di Luca A, Fiorenza E, Follega FM, Gebbia G, Iuppa R, Lega A, Lolli M, Martino B, Martucci M, Masciantonio G, Mergè M, Mese M, Morbidini A, Neubüser C, Nozzoli F, Nuccilli F, Oliva A, Osteria G, Palma F, Palmonari F, Panico B, Papini E, Parmentier A, Perciballi S, Perfetto F, Perinelli A, Picozza P, Pozzato M, Rebustini G, Recchiuti D, Ricci E, Ricci M, Ricciarini SB, Russi A, Sahnoun Z, Savino U, Scotti V, Shen X, Sotgiu A, Sparvoli R, Tofani S, Vertolli N, Vilona V, Vitale V, Zannoni U, Zoffoli S, Zuccon P. Piersanti M, et al. Nat Commun. 2023 Dec 21;14(1):8513. doi: 10.1038/s41467-023-44224-9. Nat Commun. 2023. PMID: 38129406 Free PMC article. No abstract available.

Abstract

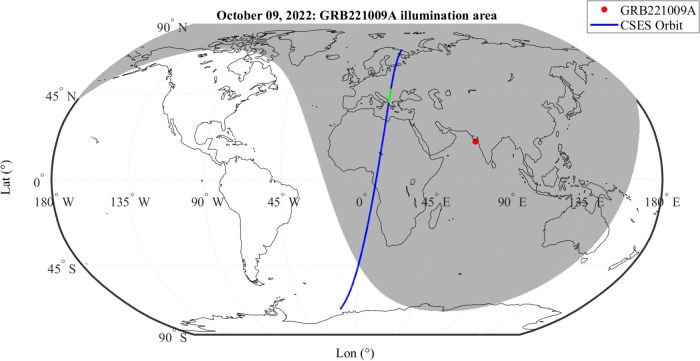
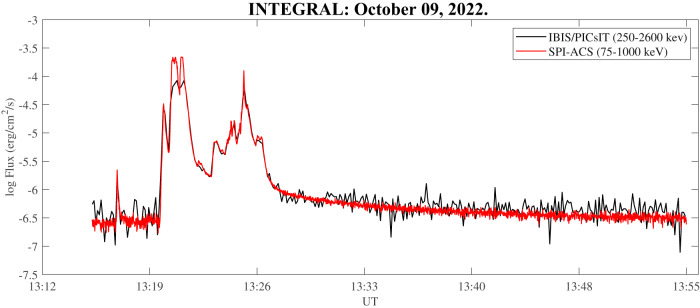
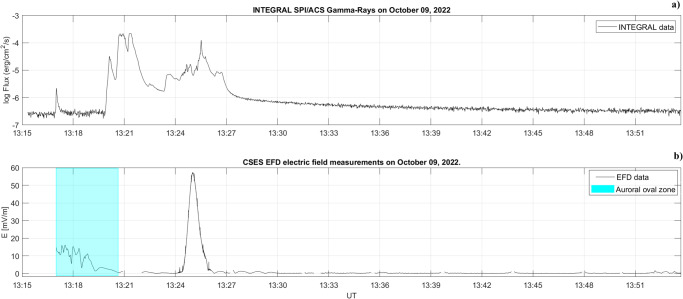
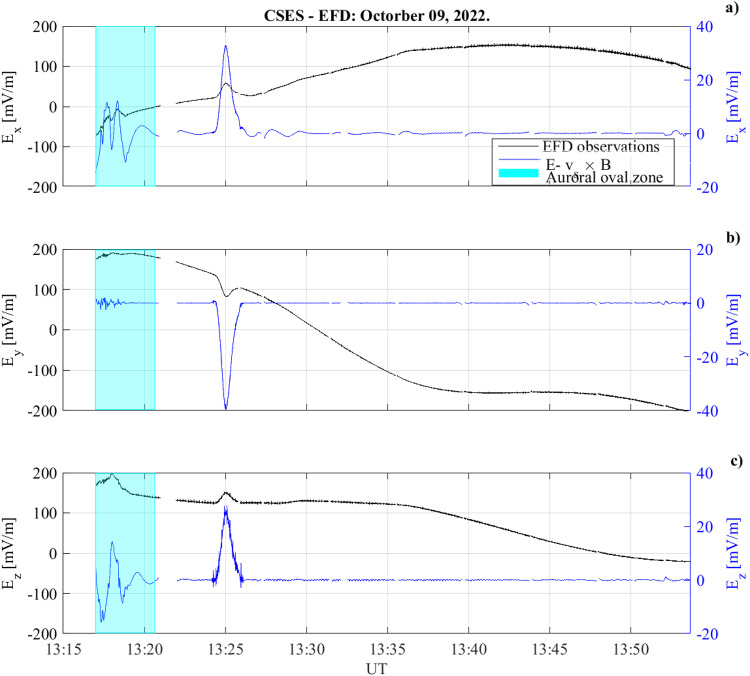
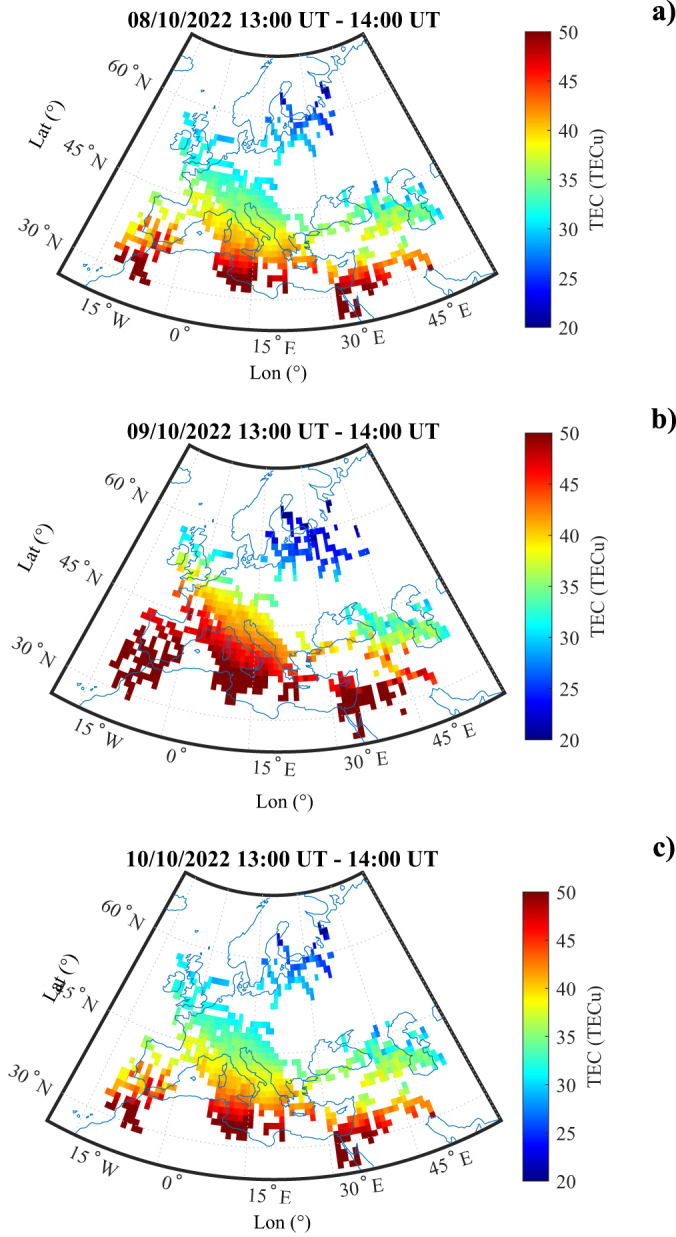
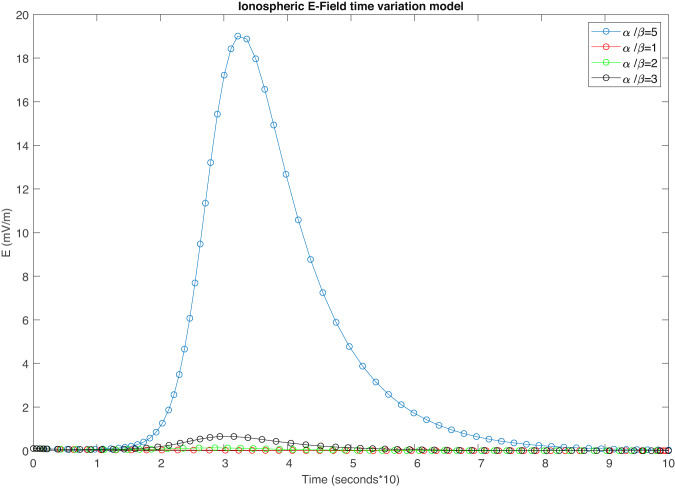
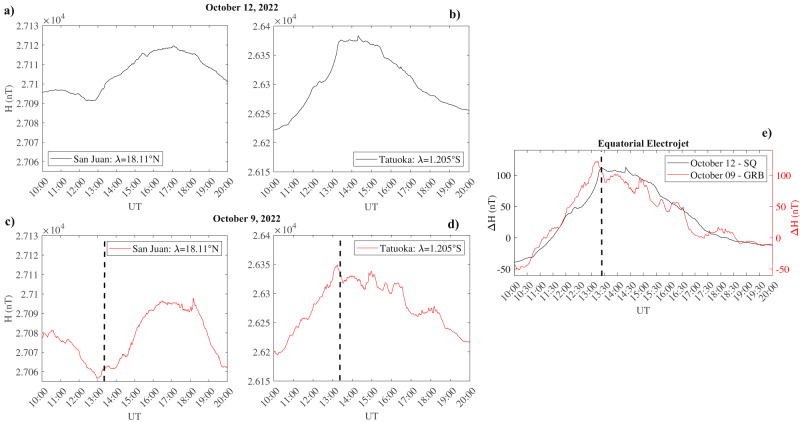
Earth's atmosphere, whose ionization stability plays a fundamental role for the evolution and endurance of life, is exposed to the effect of cosmic explosions producing high energy Gamma-ray-bursts. Being able to abruptly increase the atmospheric ionization, they might deplete stratospheric ozone on a global scale. During the last decades, an average of more than one Gamma-ray-burst per day were recorded. Nevertheless, measurable effects on the ionosphere were rarely observed, in any case on its bottom-side (from about 60 km up to about 350 km of altitude). Here, we report evidence of an intense top-side (about 500 km) ionospheric perturbation induced by significant sudden ionospheric disturbance, and a large variation of the ionospheric electric field at 500 km, which are both correlated with the October 9, 2022 Gamma-ray-burst (GRB221009A).


Conflict of interest statement

This research received no external funding. The authors declare no competing interests.

Figures

Fig. 1
Fig. 1. Superposition of the GRB illumination area and CSES satellite orbit.
A map of the Earth with the CSES satellite orbit trace shown in blue. The green-colored part along the orbit marks the time of the electric field variation triggered by the GRB and detected by EFD. The gray shaded area shows the estimated illumination area of GRB221009A impinged at a latitude of 19.8 and a longitude of 71 (red circle).
Fig. 2
Fig. 2. Light curves from INTEGRAL satellite observations.
Time profile of GRB221009A detected by INTEGRAL, scaled for background. The red curve shows the SPI/ACS count rate on 1s time-bin plotted in erg/cm2/s in the energy range 75-1000 keV; the black curve shows the IBIS/PICsIT data in the energy range 0.25–2.60 MeV. The differences between the two light curves are due to: i) difference in computing the two energy bands, ii) statistical fluctuations (IBIS/PICSiT is less sensitive in this case because of the partial shield absorption to low energy photons), iii) instrument saturation and/or telemetry loss due to the exceptionally strong photon flux from GRB221009A.
Fig. 3
Fig. 3. Comparison of INTEGRAL gamma-ray and CSES electric field measurements.
Comparison between the SPI gamma-ray flux (panel a) and the ionospheric electric field observed by the CSES satellite (panel b), after the subtraction of the vs × B induced electric field (vs and B are the spacecraft speed and the local magnetic field, respectively). The blue-shaded region corresponds to the CSES flight over the Auroral Region. The CSES electric field observations were measured at an altitude of 507 km.
Fig. 4
Fig. 4. Ionospheric Electric field observations from CSES satellite.
CSES electric field waveform as function of time during the GRB221009A occurrence for the three components Ex (panel a), Ey (panel b) and Ez (panel c) with (black curve) and without (blue curve) the vs × B induced electric field component. The blue-shaded region corresponds to the CSES flight over the Auroral Region. The CSES electric field observations were measured at an altitude of 507 km.
Fig. 5
Fig. 5. TEC map over Europe during the GRB occurrence.
Map of the vertical total electron content (TEC) around the CSES satellite position one day before (panel a), at the moment of (panel b) and one day after (panel c) the GRB occurrence. All the maps have been averaged over 1 hour, between 13:00 UT and 14:00 UT. Colors are representative of the TEC value.
Fig. 6
Fig. 6. Modelling of ionospheric electric field variation induced by a GRB.
Model results of top-side ionospheric electric field time variation induced by a impulsive photon source. Colours are representative of different photon production/absorption rate ratio.
Fig. 7
Fig. 7. Comparison between Equatorial Electrojet during quiet period and GRB occurrence.
Estimation of the Equatorial Electrojet for the a solar quiet day of October 2022 (black line) and for the day of the GRB occurrence (red line): panel a) and c) show original observations of the H component of the geomagnetic field from San Juan magnetometer station during quiet and GRB day, respectively; panel b) and d) show original observations of the H component of the geomagnetic field from Tatuoka magnetometer station during quiet and GRB day, respectively; panel e) shows the EEJ results in terms of ΔH. Black dashed lines represent the time occurrence of the first peak of the GRB.

References

    1. Fishman G, Inan U. Observation of an ionospheric disturbance caused by a gamma-ray burst. Nature. 1988;331:418–420. doi: 10.1038/331418a0. - DOI
    1. Hargreaves, J. K. The upper atmosphere and solar-terrestrial relations - An introduction to the aerospace environment (Cambridge University Press, 1979).
    1. Tanaka Y, et al. First very low frequency detection of short repeated bursts from magnetar sgr j1550- 5418. Astrophys. J. Lett. 2010;721:L24. doi: 10.1088/2041-8205/721/1/L24. - DOI
    1. Inan, U. S. et al. Massive disturbance of the daytime lower ionosphere by the giant γ-ray flare from magnetar sgr 1806-20. Geophys. Res. Lett. 34 (2007).
    1. Maeda, K. et al. Ionospheric effects of the cosmic gamma ray burst of 29 march 2003. Geophys. Res. Lett. 32, 10.1029/2005GL023525 (2005).