. 2023 Nov 14;14(1):7362.
doi: 10.1038/s41467-023-43004-9.

Multiplexed detection of viral antigen and RNA using nanopore sensing and encoded molecular probes

Affiliations

Multiplexed detection of viral antigen and RNA using nanopore sensing and encoded molecular probes

Ren Ren et al. Nat Commun. .

Abstract

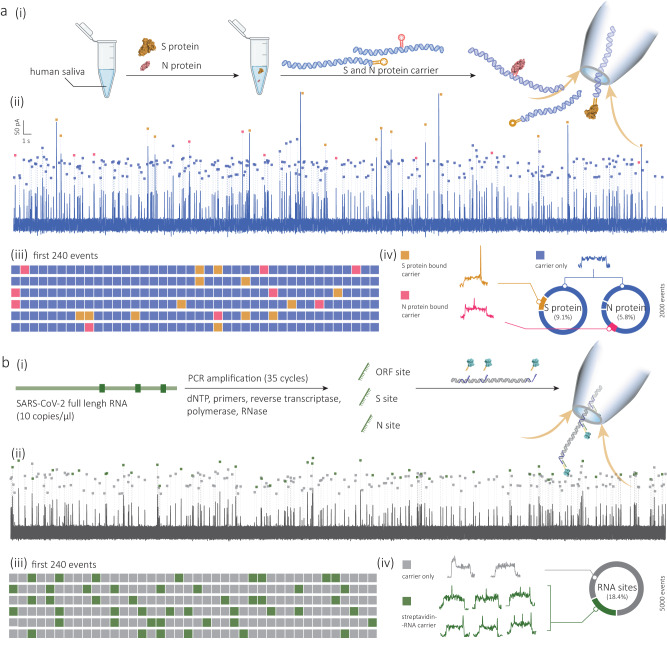
We report on single-molecule nanopore sensing combined with position-encoded DNA molecular probes, with chemistry tuned to simultaneously identify various antigen proteins and multiple RNA gene fragments of SARS-CoV-2 with high sensitivity and selectivity. We show that this sensing strategy can directly detect spike (S) and nucleocapsid (N) proteins in unprocessed human saliva. Moreover, our approach enables the identification of RNA fragments from patient samples using nasal/throat swabs, enabling the identification of critical mutations such as D614G, G446S, or Y144del among viral variants. In particular, it can detect and discriminate between SARS-CoV-2 lineages of wild-type B.1.1.7 (Alpha), B.1.617.2 (Delta), and B.1.1.539 (Omicron) within a single measurement without the need for nucleic acid sequencing. The sensing strategy of the molecular probes is easily adaptable to other viral targets and diseases and can be expanded depending on the application required.


Conflict of interest statement

The authors declare no competing interests.

Figures

Fig. 1
Fig. 1. Multiplexed sensing of SARS-CoV-2 S, N proteins and RNA fragments.
a Schematic of multiplexed detection of viral proteins and RNAs from patients’ samples. SARS-CoV-2 virus is lysed into S protein, N protein, and RNA fragments, which can be selectively determined by the nanopore when bound to their corresponding encoded DNA molecular probes. b Schematic and representative ion current-time traces for the translocation of 10 kbp dsDNA probes encoded with S protein binding aptamer (SBA), without (i) and with (ii) bound S protein (b). c Schematic and representative single-molecule ion current-time signatures for the translocation of 10 kbp dsDNA probes encoded with N protein binding aptamer (NBA) without (i) and with (ii) bound N protein (c). Bound S protein induces a distinguishable secondary peak at the end (b) while the N protein binding results in a secondary peak in the middle (c). d Schematic representations of a DNA probe (9.1 kbp) that has been encoded with 3 ssDNA sequences complementary to chosen regions in the ORF1b, S, and N genes of viral RNA. Sequence-specific binding of viral RNA fragments is identified by the presence of secondary peaks and their position in the ion current single molecule signature. Peaks are further enhanced by adding streptavidin-tagged biotinylated-ssDNA probes for signal enhancement with sequences complementary to the chosen regions in ORF1b, S, and N genes.
Fig. 2
Fig. 2. Detection of S protein.
a Representative current-time traces for the translocation of SBA encoded 10 kbp DNA molecular probe (end-modified) in the absence (i) and presence (ii) of S protein (20 nM). Zoom-in views of typical translocation events are shown below current-time traces. b Representative current-time traces for concentration-dependent experiments with the addition of S protein of 0.2, 2, 20, 200 pM, 2, 20, and 200 nM, respectively. c Density scatter plots of dwell time versus peak current amplitude for the translocation of the molecular probe only (blue, n = 1023) and protein/DNA conjugates (orange, n = 123). d Binding curve of molecular probe incubated with S protein ranging from 0 to 200 nM. e Comparison of the detection of S protein (200 nM) from SARS-CoV-2 virus, HCoV-NL63 and HCoV-OC43. All translocation experiments were performed with 200 pM molecular probe in 2 M LiCl buffer (5 mM MgCl2, 10 mM Tris–HCl, 1 mM EDTA, pH = 8) at an applied potential bias of 300 mV. Error bars in d and e represent the standard deviation of three independent replicates and the measure of the centre represents their corresponding mean value. Source data are provided as a Source Data file.
Fig. 3
Fig. 3. Nanopore detection of N protein.
a Schematics of NBA modified 10 kbp DNA molecular probe and its binding to N protein. Representative translocation events are shown underneath. Upon binding, the N protein produces a secondary peak superimposed on the dsDNA level at a fractional position of ≈0.43 for a typical event. b Binding curve of molecular probe incubated with N protein ranging from 0 to 20 nM. c Comparison of the detection of N protein (20 nM) from SARS-CoV-2 virus and seasonal flu virus of HCoV-229E and HCoV-OC43. d, e Scatter plots of secondary peak amplitude versus dwell time (d) or fractional position (e) and corresponding statistics (n = 107). All the translocation experiments were performed with 200 pM molecular probe in 2 M LiCl, 5 mM MgCl2, 10 mM Tris–HCl, 1 mM EDTA, and pH 8 solution at an applied bias of 300 mV. Error bars in b and c represent the standard deviation of three independent experimental repeats and the measure of the centre represents their corresponding mean value. Source data are provided as a Source Data file.
Fig. 4
Fig. 4. Multiplexed detection of SARS-CoV-2 RNA fragments.
a Genome map showing the full length with annotated regions of SARS-CoV-2. Position of sequences in the ORF1b, S and N genes that have been chosen for detection are marked in magenta. b (i) Schematic representations of a 3-site DNA molecular probe (9.1 kbp) and the binding to ORF1b, S, and N gene targets, respectively. The probe for an individual target is assigned to a specific position along the dsDNA and bound to the first half of the target RNA sequence. A biotinylated sequence is used as a signal enhancement probe to bind the second half of the target sequence, and streptavidin is used to enhance the signal. Sequences for the selected ORF1b, S, and N gene targets are shown, and the binding segment of the dsDNA carrier and biotinylated probe are highlighted in orange and blue, respectively. (ii) Representative events are shown for the individual genome target binding with secondary peaks and are observed at the respective position. (iii) histogram of the normalised frequency of the fractional secondary peak position for each binding genome fragment (n = 100). The detailed secondary peak information is shown in Supplementary Fig. S21. c Schematics for the 3-site molecular probe binding to two (i-iii) or three (iv) target gene fragments and the resulting translocation events are shown in the bottom panel. d Statistics for simultaneous detection of the three RNA targets range from 0.2 pM to 2 nM. e Calibration curve for the N gene binding ratio and the target RNA concentration. All the translocation experiments were performed with 200 pM of molecular probe in 2 M LiCl buffer (5 mM MgCl2, 10 mM Tris–HCl, 1 mM EDTA, pH = 8) at an applied potential bias of 300 mV. Error bars in e represent the standard deviation of three independent experimental repeats and the measure of the centre represents their corresponding mean value. Source data are provided as a Source Data file.
Fig. 5
Fig. 5. Rapid differentiation of SARS-CoV-2 variants.
a, b Schematic illustration showing the strategy used to identify the single-nucleotide mutant of D614G mutation (a) and SARS-CoV-2 virus wild-type (b). The molecular probe and the signal enhancement probe are encoded to bind the D614G mutation sequence but not the corresponding sequence fragment in the wild-type. c Sequence information for three vital mutations of SARS-CoV-2: D614G, Y144 deletion, and G446S. d Design of two molecular probes encoded for mutations of Y114del/G446S, D614G, and N gene at sites 1, 2, and 3. e List of the mutation sites for the wild-type, Alpha, Delta, and Omicron variants as well as the corresponding mutations they contain. Fractional secondary peak positions were recorded for wild-type, Alpha, Delta, and Omicron variants. Molecular probe 1 was tested for wild-type, Alpha, and Delta variants, and molecular probe 2 was tested for wild-type, Delta, and Omicron variants. All the translocation experiments were performed with 200 pM of molecular probe in 2 M LiCl buffer (5 mM MgCl2, 10 mM Tris–HCl, 1 mM EDTA, pH = 8) at an applied bias of 300 mV. Source data are provided as a Source Data file.
Fig. 6
Fig. 6. Digitally multiplexed sensing of S and N proteins in saliva and full-length RNA of SARS-CoV-2.
a Sensing of S and N proteins in human saliva. (i) Schematic showing the workflow of multiplexed S and N protein detection in human saliva. 20 nM S and N proteins are added in pooled human saliva (>3 people, 1:20) solution and incubated with the prepared SBA and NBA molecular probes, and nanopore measurements are performed. A representative current-time trace for the detection is shown with the molecular probes marked with blue squares, N protein binding events marked with red squares, and S protein binding events marked with orange squares (ii). The classification of the first 240 detected probes is shown in a colour-coded pixel grid (iii), and the breakdown of a total of 2000 detected probes is shown in (iv). b Multiplexed sensing of viral genes from full-length synthetic RNA of SARS-CoV-2. (i) Schematic showing the workflow of detecting viral RNA. Target gene sites (i.e., ORF, S, and N gene) are pre-amplified from the whole viral RNA through a 35-cycle PCR by adding corresponding primers and enzymes. The amplified genome fragments are then incubated with the prepared 3-site molecular probe and detected by nanopore sensing. A representative current-time trace for the detection is shown with the molecular probes marked with grey squares, and the bound target RNA events are marked with magenta squares (ii). The classification of the first 240 detected probes is shown in a colour-coded pixel grid (iii), and the classification of a total of 5,000 detected probes is shown in (iv). All the translocation experiments were performed with 200 pM molecular probes in 2 M LiCl buffer (5 mM MgCl2, 10 mM Tris–HCl, 1 mM EDTA, pH = 8) at an applied bias of 300 mV. Error bars represent the standard deviation of three independent experimental repeats.
Fig. 7
Fig. 7. Validation with clinical samples of different SARS-CoV-2 variants.
a Box plots and a colour map showing the binding ratio for the overall S and N protein (i) and the N gene (ii) from samples of healthy controls (n = 5), and patients infected by the wild-type (n = 5), Delta (n = 5), and Omicron (n = 5) variants. Box plots in (i) show the binding ratio for S and N proteins individually for each cohort of patients. Box plots in (ii) show the binding ratio for the N gene and mutation of D614G and G339D individually for each cohort of patients. Each patient sample was tested independently 3 times. For all boxes, the black central line represents the median, the square represents the mean, the bottom and top edges mark the 25th and 75th percentiles. Whiskers denote the intervals between the 5th and 95th percentiles. b, Bar charts of the binding ratio of S/N protein (i) and G339D, D614G and N gene (ii) for one typical patient from each cohort. Statistical significance was tested using a two-tailed Student’s t-test. *P < 0.05; **P < 0.01; ***P < 0.001, the detailed P-value information is shown in Supplementary Table 10. c Overall test results of S and N protein, G339D, G614G mutation, and N gene for each patient. All translocation experiments were performed with 200 pM molecular probes in 2 M LiCl buffer (5 mM MgCl2, 10 mM Tris–HCl, 1 mM EDTA, pH = 8) at an applied bias of 300 mV. Error bars in e represent 1 × σ obtained from three different nanopore measurements (n = 3). Source data are provided as a Source Data file.

References

    1. World Health Organization. WHO Coronavirus (COVID-19) Dashboardhttps://covid19.who.int/ (2023).
    1. Feikin DR, et al. Duration of effectiveness of vaccines against SARS-CoV-2 infection and COVID-19 disease: results of a systematic review and meta-regression. The Lancet. 2022;399:924–944. doi: 10.1016/S0140-6736(22)00152-0. - DOI - PMC - PubMed
    1. Wadman M. New Omicron begins to take over, despite late start. Science. 2022;375:480–481. doi: 10.1126/science.ada0852. - DOI - PubMed
    1. Andrews N, et al. Covid-19 vaccine effectiveness against the Omicron (B.1.1.529) Variant. New Engl. J. Med. 2022;386:1532–1546. doi: 10.1056/NEJMoa2119451. - DOI - PMC - PubMed
    1. Planas D, et al. Considerable escape of SARS-CoV-2 Omicron to antibody neutralization. Nature. 2022;602:671–675. doi: 10.1038/s41586-021-04389-z. - DOI - PubMed

Publication types

Supplementary concepts

LinkOut - more resources