. 2023 Nov 14;7(1):120.
doi: 10.1038/s41698-023-00471-z.

Multi-omic profiling reveals discrepant immunogenic properties and a unique tumor microenvironment among melanoma brain metastases

Affiliations

Multi-omic profiling reveals discrepant immunogenic properties and a unique tumor microenvironment among melanoma brain metastases

Gino K In et al. NPJ Precis Oncol. .

Abstract

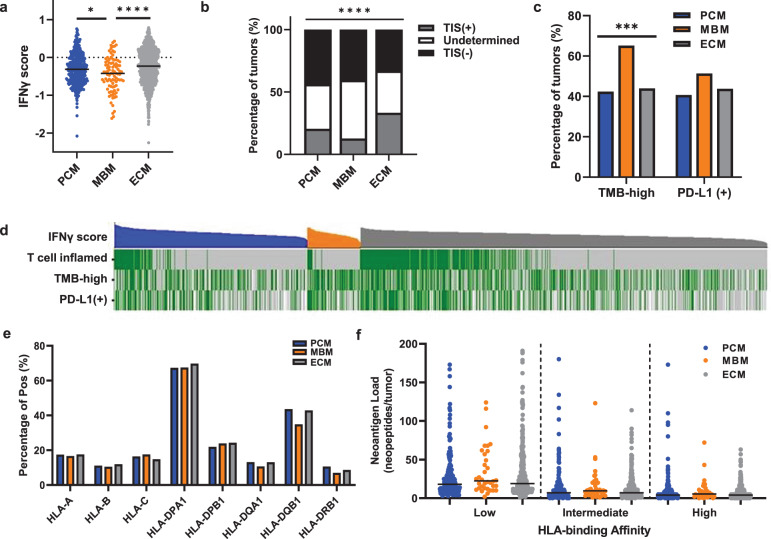
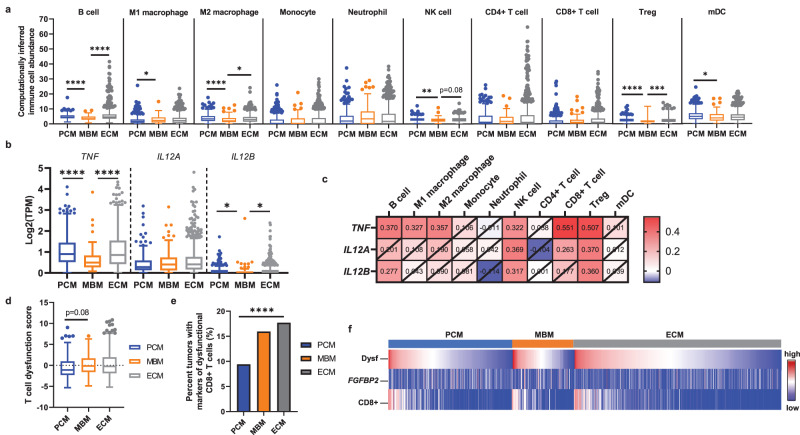
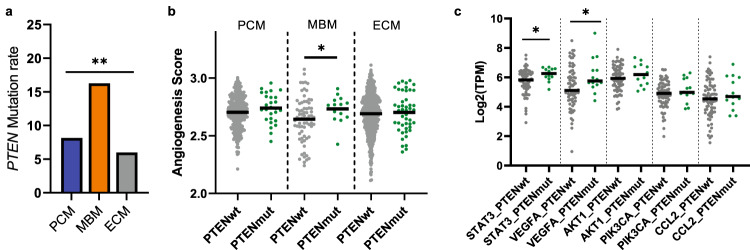
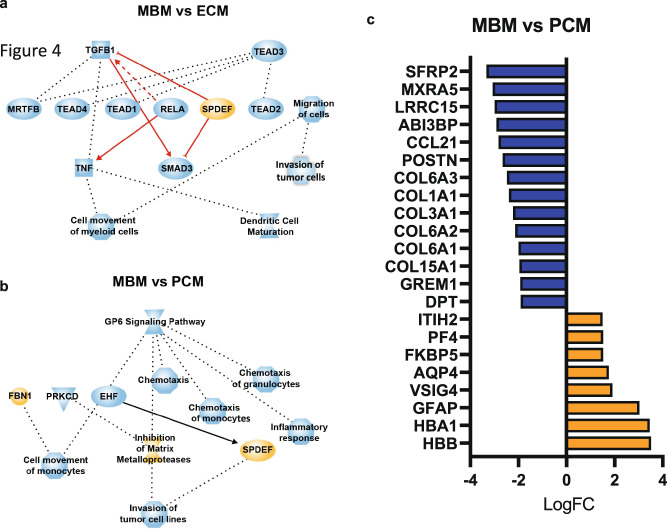
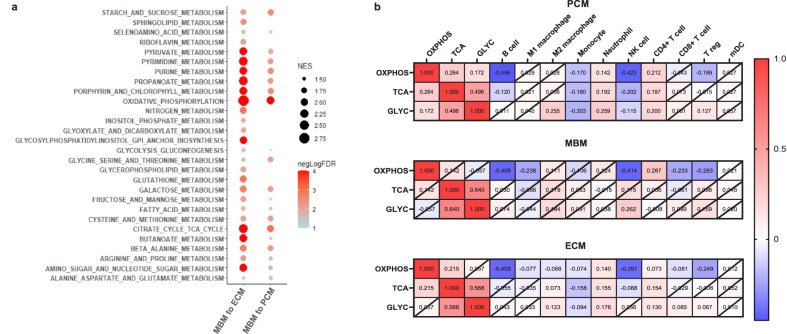
Melanoma brain metastases (MBM) are clinically challenging to treat and exhibit variable responses to immune checkpoint therapies. Prior research suggests that MBM exhibit poor tumor immune responses and are enriched in oxidative phosphorylation. Here, we report results from a multi-omic analysis of a large, real-world melanoma cohort. MBM exhibited lower interferon-gamma (IFNγ) scores and T cell-inflamed scores compared to primary cutaneous melanoma (PCM) or extracranial metastases (ECM), which was independent of tumor mutational burden. Among MBM, there were fewer computationally inferred immune cell infiltrates, which correlated with lower TNF and IL12B mRNA levels. Ingenuity pathway analysis (IPA) revealed suppression of inflammatory responses and dendritic cell maturation pathways. MBM also demonstrated a higher frequency of pathogenic PTEN mutations and angiogenic signaling. Oxidative phosphorylation (OXPHOS) was enriched in MBM and negatively correlated with NK cell and B cell-associated transcriptomic signatures. Modulating metabolic or angiogenic pathways in MBM may improve responses to immunotherapy in this difficult-to-treat patient subset.


Conflict of interest statement

G.K.I.: Research funding (paid to institution): Regeneron, Array, Idera, Genentech, Replimune, Xencor, InstilBio, Pfizer, Checkmate Pharmaceuticals; Consulting or Advisory role: Bristol Myers Squibb, Regeneron, Sanofi, Replimune, Pfizer, Novartis. J.Y., J.X., J.R.R., and A.M.V.: employees of Caris Life Sciences. S.D.: Oncolens, Bayer, and BostonGene. A.K.S.S.: Research funding (paid to institution): Ascentage, Bristol Myers Squibb, Ideaya, Immunocore, Merck, Olatec Therapeutics, Regeneron, Replimune, Seagen; consultant or advisory role: Bristol Myers Squibb, Iovance, Regeneron, Replimune, Novartis, Pfizer. J.C.M.: Research funding (paid to institution): NovoCure (Inst), Genentech, Alpine Immune Sciences, Amgen, Trishula Therapeutics, BioEclipse Therapeutics, FujiFilm, ImmuneSensor, Simcha, Repertoire Immune Sciences, Nektar Therapeutics, Synthorx Inc, Istari Oncology, Ideaya Biosciences, Rubius, University of Arizona, Senwha, Storm Therapeutics, Werewolf Therapeutics, Fate Therapeutics, Y-Mab, Agenus; consultant or advisory role: BMS, Amunix, Thirona Bio, Adagene, Imaging Endpoints, Boxer Capitol, Oberland Capital, IQVIA, Caris Life Sciences, Genome Insight; speakers Bureau: Caris Life Sciences, Immunocore. S.J.P.: Advisory role: Regeneron. B.I.: Consulting fees/honoraria: Volastra Therapeutics Inc, Merck, AstraZeneca, Eisai and Janssen Pharmaceuticals; research funding (paid to institution): Agenus, Alkermes, Arcus Biosciences, Checkmate Pharmaceuticals, Compugen, Immunocore, and Synthekine.

Figures

Fig. 1
Fig. 1. MBM with comparable HLA homozygosity and neoantigen load are less immunogenic than PCM or ECM.
a IFNγ scores for PCM (blue, n = 350), MBM (orange, n = 94) and ECM (gray, n = 870). Black lines indicate median IFNγ score values. Kruskal–Wallis test with Benjamini-Hochberg correction; ****, corrected p < 0.0001; *, corrected p < 0.05. b PCM, MBM, and ECM were evaluated and classified by T cell-inflamed signature. The percentages of tumors with T cell-inflamed signatures (TIS(+); gray), undetermined (white), and lacking a T cell-inflamed signature (TIS(-); black). Chi-square test; ****p < 0.0001. c The percentage of PCM (n = 276), MBM (n = 72), and ECM (n = 681) that are TMB-high and PD-L1(+). Chi-square test; ***, p < 0.0005. d Oncoplot including IFNγ scores (top, highest to lowest within PCM, blue; MBM, orange; ECM, gray), T cell-inflamed signature (green, T cell-inflamed tumors; gray, others), TMB (high, green; low, gray; white, data not available) and PD-L1 IHC staining (positive, green; negative, gray; white, data not available). e Percentage of tumors that are homozygous at HLA-I (HLA-A, HLA-B, and HLA-C) and HLA-II (HLA-DPA1, HLA-DPB1, HLA-DQB1, and HLA-DRB1) loci in PCM, MBM, and ECM. Chi-square test, not significant (p > 0.05). f Assessment of neoantigen load with low (left), intermediate (middle), and high (right) HLA-binding affinity for PCM (blue), MBM (orange), and ECM (gray). Kruskal–Wallis test; not significant (p > 0.05).
Fig. 2
Fig. 2. MBM have significantly fewer computationally inferred immune cell infiltrates and more T cell dysfunction.
a Box plots showing computationally inferred immune cell abundance in PCM, MBM, and ECM using quanTIseq analysis. The data is displayed using the Tukey method for box and whiskers, with the center line indicating the median. Kruskal-Wallis test with Benjamini-Hochberg correction; *, corrected p < 0.05; **, corrected p < 0.005; ***, corrected p < 0.0005; ****, corrected p < 0.0001. b The mRNA levels of TNF, IL12A, and IL12B were compared between PCM, MBM, and ECM tumor samples. The data is displayed using the Tukey method for box and whiskers, with the center line indicating the median. Kruskal–Wallis test with Benjamini-Hochberg correction; **, corrected p < 0.005; ****, corrected p < 0.0001 c Heat map of Spearman rank correlation coefficients between TNF, IL12A, and IL12B mRNA and immune cell infiltrates calculated from bulk transcriptomic data in MBM. The numbers in each box show the correlation coefficient, where crossed boxes indicate non-significant correlation values (p > 0.05). d Box plots of T cell exhaustion scores in PCM, MBM, and ECM. The data is displayed using the Tukey method for box and whiskers. Kruskal–Wallis test with Benjamini–Hochberg correction. e Percentage of PCM, MBM, and ECM with CD8 + T cells that have high dysfunction scores (composite z-score > 1.0) but low FGFBP2 mRNA levels (less than the median for the whole cohort). χ2 test; ****p < 0.0001. f Oncoplot with T cell dysfunction score (top, highest to lowest within PCM, blue; MBM, orange; ECM, gray), FGFBP2 mRNA levels (middle), and CD8 + T cell abundance (bottom).
Fig. 3
Fig. 3. Association of angiogenic factors with PTEN mutations in MBM.
a The percentage of PCM (blue, n = 332), MBM (orange, n = 86), and ECM (gray, n = 801) with PTEN mutations. Chi-square test; **p < 0.005. b ssGSEA analysis for normalized enrichment scores (NES) of hallmark angiogenesis pathway comparing tumors with PTEN mutations (green) and without PTEN mutations (gray) within PCM, MBM, and ECM groups. Black line indicates median. Mann-Whitney test; *p < 0.05. c The mRNA levels of key regulatory genes (STAT3, VEGFA, AKT1, PIK3CA, and CCL2) in the angiogenesis pathway were cross compared between MBM tumors with PTEN mutations (green) and without PTEN mutations (gray). Black line indicates median. Mann-Whitney test; *p < 0.05.
Fig. 4
Fig. 4. Differentially expressed genes in MBM compared to PCM and ECM.
Ingenuity pathway analysis (IPA) shows a significant enrichment of pathways in MBM compared to ECM (a) and PCM (b). Orange node, enrichment in MBM; blue node, enrichment in ECM or PCM. c Differentially expressed genes (Log2FC; adjusted p < 0.01) in MBM compared to PCM. Only genes that were differentially expressed in MBM compared to both PCM and ECM are shown. Orange bars indicate genes that were upregulated in MBM and blue bars indicate genes that were downregulated in MBM.
Fig. 5
Fig. 5. MBM show enrichment in oxidative phosphorylation, TCA cycle, and glycolysis gluconeogenesis pathways.
a GSEA analysis demonstrates a significant enrichment in of KEGG metabolic pathways in MBM versus PCM (left lane) or ECM (right lane). The normalized enrichment score (NES) is indicated by the size of the dot and the -log10 p value (cut off FDR < 0.05) is indicated by the color of the dot. b Heat maps of Spearman rank correlations between NES of OXPHOS, TCA cycle (TCA), and glycolysis (GLYC) determined from ssGSEA and computationally inferred immune cell abundance in PCM, MBM, and ECM. The numbers in each box show the correlation coefficient, where crossed boxes indicate non-significant correlation values (p > 0.05).

References

    1. Siegel RL, Miller KD, Fuchs HE, Jemal A. Cancer statistics, 2022. CA Cancer J. Clin. 2022;72:7–33. doi: 10.3322/caac.21708. - DOI - PubMed
    1. Gutzmer R, et al. Melanoma brain metastases - Interdisciplinary management recommendations 2020. Cancer Treat. Rev. 2020;89:102083. doi: 10.1016/j.ctrv.2020.102083. - DOI - PubMed
    1. Janavicius M, Lachej N, Anglickiene G, Vincerzevskiene I, Brasiuniene B. Outcomes of treatment for melanoma brain metastases. J. Skin Cancer. 2020;2020:7520924. doi: 10.1155/2020/7520924. - DOI - PMC - PubMed
    1. Tawbi HA, et al. Combined nivolumab and ipilimumab in melanoma metastatic to the brain. N. Engl. J. Med. 2018;379:722–730. doi: 10.1056/NEJMoa1805453. - DOI - PMC - PubMed
    1. Larkin J, et al. Combined nivolumab and ipilimumab or monotherapy in untreated melanoma. N. Engl. J. Med. 2015;373:23–34. doi: 10.1056/NEJMoa1504030. - DOI - PMC - PubMed