. 2023 Nov 14;6(1):1162.
doi: 10.1038/s42003-023-05541-3.

Propagation of PrPSc in mice reveals impact of aggregate composition on prion disease pathogenesis

Affiliations

Propagation of PrPSc in mice reveals impact of aggregate composition on prion disease pathogenesis

Sheng Chun Chang et al. Commun Biol. .

Abstract

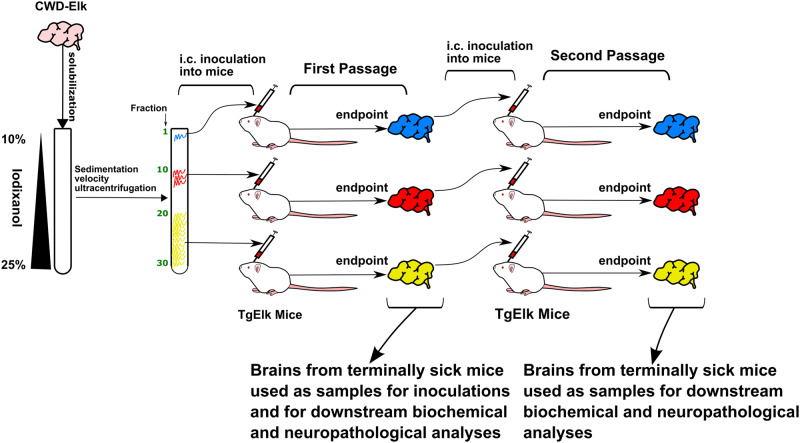
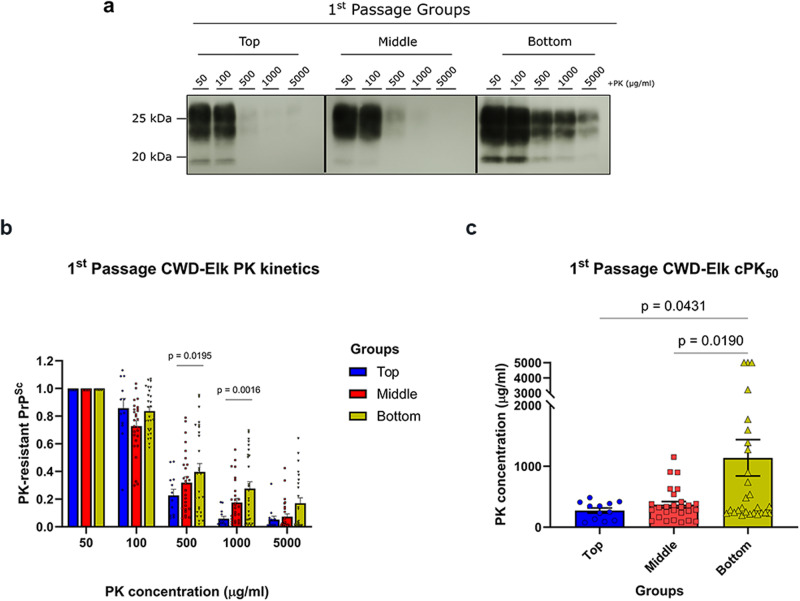
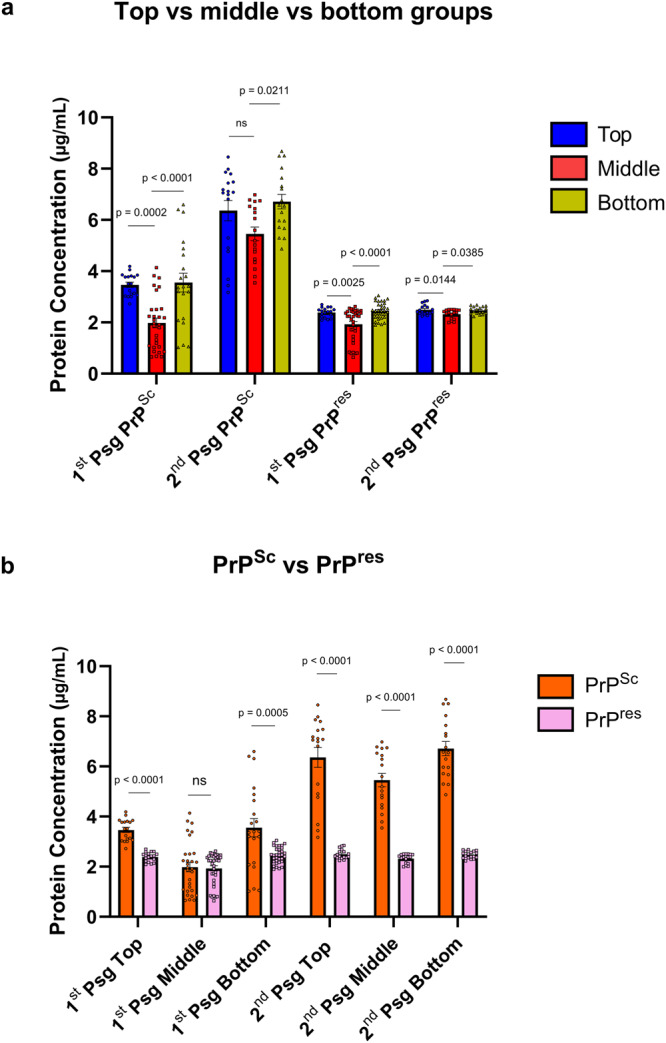
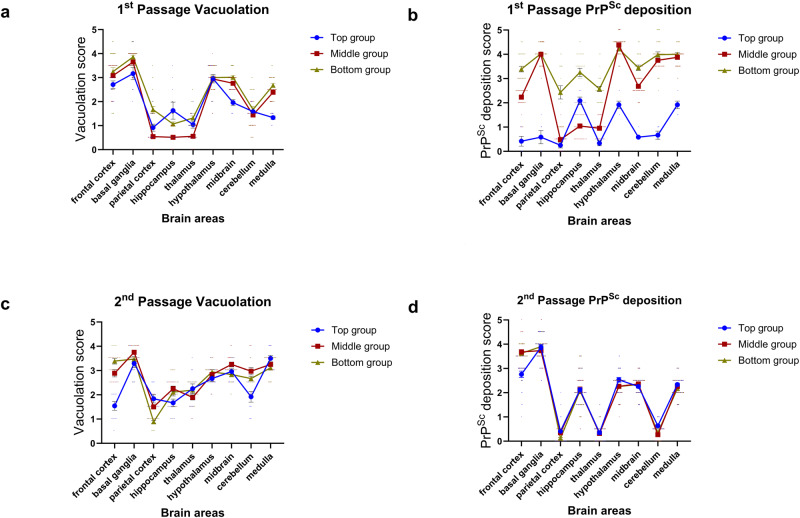
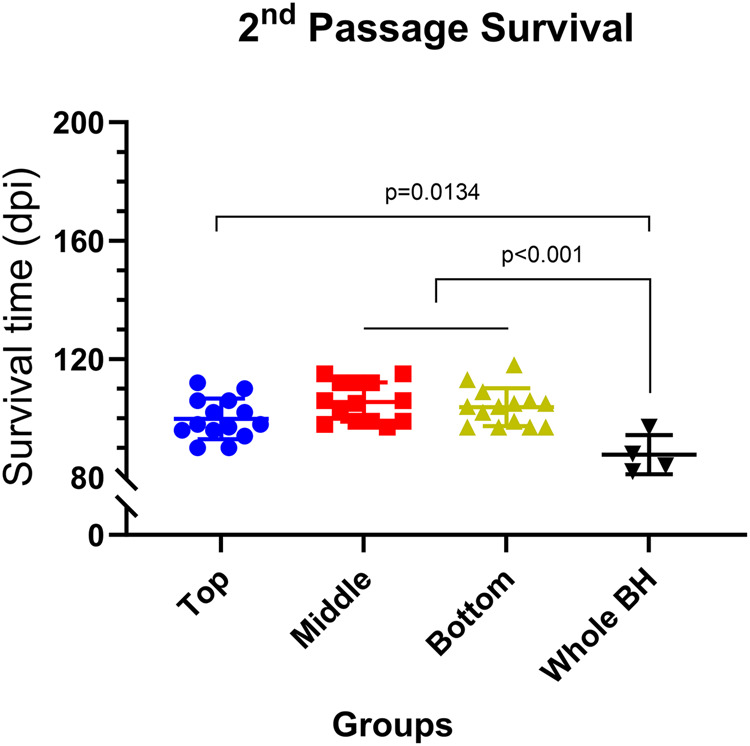
Infectious prions consist of PrPSc, a misfolded, aggregation-prone isoform of the host's prion protein. PrPSc assemblies encode distinct biochemical and biological properties. They harbor a specific profile of PrPSc species, from small oligomers to fibrils in different ratios, where the highest infectivity aligns with oligomeric particles. To investigate the impact of PrPSc aggregate complexity on prion propagation, biochemical properties, and disease pathogenesis, we fractionated elk prions by sedimentation velocity centrifugation, followed by sub-passages of individual fractions in cervidized mice. Upon first passage, different fractions generated PrPSc with distinct biochemical, biophysical, and neuropathological profiles. Notably, low or high molecular weight PrPSc aggregates caused different clinical signs of hyperexcitability or lethargy, respectively, which were retained over passage, whereas other properties converged. Our findings suggest that PrPSc quaternary structure determines an initial selection of a specific replication environment, resulting in transmissible features that are independent of PrPSc biochemical and biophysical properties.


Conflict of interest statement

The authors declare no competing interest.

Figures

Fig. 1
Fig. 1. Schematic outline of the study.
Homogenized and solubilized CWD-Elk prion brain samples were subjected to sedimentation velocity ultracentrifugation that results in the smaller aggregates to be found near the top, medium-sized aggregates to be found in the middle, and large aggregates to be found near the bottom of the gradient. Even fractions, were intracerebrally inoculated into transgenic mice expressing elk PrPC and their brains were harvested at endpoint. These samples, denoted first passage, were used for downstream experiments, namely PK digestion, sedimentation analysis, ELISA, histopathology, and immunohistochemistry (Figs. 3–6). The samples were also further inoculated into transgenic mice, and these animals’ brains were harvested at endpoint. These subsequent samples, denoted second passage, were used for downstream experiments (Figs. 4, 6–9).
Fig. 2
Fig. 2. Sedimentation velocity gradient and bioassay in tgElk mice.
CWD-Elk prions were solubilized and fractionated through sedimentation velocity ultracentrifugation, and alternating fractions (even-numbered) were inoculated into tgElk mice. a Fractions collected were quantified by Western blot for total PrP (-PK; black line) or PrPres (+PK; green line) (mean ± SEM; -PK n = 5, +PK n = 7 independent experiments), and for survival times of inoculated tgElk (orange line) (mean ± SD; n = 2 for fraction 2, n = 3–5 for other fractions). Western blot signals in each fraction from each replicate are calculated as a ratio of the sum of all signals from the respective replicate. b ELISA quantification of total PrP (black) or PrPres content (red) (mean ± SEM; n = 3 replicates). c SD50/ng PrP contained in each fraction (mean ± standard error, n = 8–12 replicates across 3 independent experiments). d Survival times of the tgElk mice inoculated with fractions from the top (blue), middle (red), or bottom (green) of the gradient, or unfractionated CWD-Elk brain homogenate. Each point corresponds to the survival of an individual animal. Mean ± SD; top group n = 12, middle group n = 28, bottom group n = 27, whole BH group n = 5 animals.
Fig. 3
Fig. 3. Biochemical analyses of tgElk brain homogenates inoculated with CWD-Elk fractions (first passage).
a Representative blots of PrPSc digested with various concentrations of PK from the top, middle, and bottom groups from the first passage. b Densitometric analysis of the PrPres signals. Signals were quantified as a ratio of the baseline signal at 50 μg/ml. Statistical analysis was performed with two-way ANOVA followed by Tukey’s post-hoc multiple comparison test. c cPK50 analysis of the PrPres signals of the three groups. The PK concentration required to degrade 50% of the signal was obtained from the baseline signal of 50 μg/ml digestion. Mean ± SEM; top group n = 12, middle and bottom groups n = 27 replicates with at least three biologically independent samples.
Fig. 4
Fig. 4. PrPSc and PrPres levels in the 1st and 2nd passage brain samples quantified using ELISA.
a PrP concentration compared between top (blue), middle (red), and bottom (green) groups in first and second passages. Statistical analysis was performed using one-way ANOVA followed by post-hoc analysis with Tukey’s multiple comparison test. b Comparison of levels of PrPSc (orange) with respect to PrPres (pink) between top, middle, and bottom groups upon first and second passages. Statistical analysis was performed with unpaired Student’s t-test. Mean ± SEM; 2nd passage PrPres top and middle groups n = 17; 1st passage PrPSc top group, all 2nd passage PrPSc groups, 1st passage PrPres top group, and 2nd passage PrPres bottom group n = 18; 1st passage PrPSc bottom group n = 21; 1st passage PrPSc middle group n = 30; 1st passage PrPres bottom group n = 33; 1st passage PrPres middle group n = 36 replicates; all experiments involve at least three biologically independent samples.
Fig. 5
Fig. 5. Sedimentation profiles of top, middle, and bottom groups in first passage.
Brain homogenates from top (a), middle (b) and bottom (c) groups were solubilized and fractionated by SV. Fractions collected from the gradients were quantified for PrP content (-PK; black line; +PK; blue, red and green, respectively for top, middle and bottom groups). The +PK signals at the top (d), middle (e), and bottom (f) of the gradient denoted respectively as fractions 1–7, 8–19, and 20–30 were depicted as the average signal per fraction in each group to indicate the trend of greater amounts of +PK signals in the top fraction compared to the bottom fractions. Mean ± SEM; n = 5–8 independent experiments with at least three biologically independent samples.
Fig. 6
Fig. 6. Brain vacuolation and PrPSc deposition scorings in tgElk mice inoculated with CWD-Elk fractions.
Brain vacuolation was semi-quantified (scored) to compare first passage (a) to second passage (c). The y-axis represents vacuolation scores in a range of 0 (none) to 5 (severe). The x-axis represents the nine brain areas scored. Abnormal PrP deposition was scored to compare first passage (b) to second passage (d). The y-axis represents scoring of abnormal PrP-deposits on a range of 0 (none) to 5 (severe). The x-axis represents the nine brain areas scored. Mean ± SEM; 1st passage vacuolation top n = 12, middle n = 36, bottom n = 36; 1st passage PrPSc deposition top n = 6, middle n = 36, bottom n = 36; 2nd passage vacuolation top n = 12, middle = 18, bottom = 18; 2nd passage PrPSc deposition top n = 33, middle = 39, bottom = 39 individual scores. Scores were derived from a minimum of three biologically independent samples.
Fig. 7
Fig. 7. Survival times of tgElk mice upon second passage.
TgElk mice were inoculated with the first passage prion material from the top (blue), middle (red), and bottom (green) groups as well as from control unfractionated (whole BH) group. Each point corresponds to the survival of an individual animal. Mean ± SEM; top, middle, and bottom groups n = 14, whole BH group n = 4 animals.
Fig. 8
Fig. 8. Biochemical analyses of PrPSc upon second passage in tgElk.
a Representative Western blot of the PrP digested at various concentrations of PK from the top, middle, and bottom groups from the second passage. b Densitometric analysis of PrPres signals. The signals were quantified as a ratio of the baseline signal at 50 μg/ml. Statistical analysis was performed with two-way ANOVA followed by Tukey’s post-hoc multiple comparison test. c cPK50 analysis of the PrPres signals, with the PK concentration required to degrade 50% of the signal obtained from the baseline signal of 50 μg/ml digestion. Mean ± SEM; top group n = 21, middle group n = 25, bottom group n = 26 independent experiments with a minimum of nine biologically independent samples.
Fig. 9
Fig. 9. Sedimentation profiles of top, middle, and bottom groups in second passage.
Second passage samples were solubilized and subjected to sedimentation velocity ultracentrifugation. Brain homogenates from top (a), middle (b), and bottom (c) groups were solubilized and fractionated by SV. Fractions collected from the gradients were quantified for PrP content (-PK; black line (ac); +PK; blue (a), red (b), and green (c), respectively for top, middle, and bottom groups). To quantify and compare the PrPres content, the +PK signals at the top (d), middle (e), and bottom (f) of the gradient denoted respectively as fractions 1–7, 8–19, and 20–30 were depicted as the average signal per fraction in each group. Mean ± SEM; n = 11–12 independent experiments with a minimum of four biologically independent samples.

References

    1. Collinge J. Prion diseases of humans and animals: their causes and molecular basis. Annu. Rev. Neurosci. 2001;24:519–550. doi: 10.1146/annurev.neuro.24.1.519. - DOI - PubMed
    1. Prusiner SB. Novel proteinaceous infectious particles cause scrapie. Science. 1982;216:136–144. doi: 10.1126/science.6801762. - DOI - PubMed
    1. Colby DW, Prusiner SB. De novo generation of prion strains. Nat. Rev. Microbiol. 2011;9:771–777. doi: 10.1038/nrmicro2650. - DOI - PMC - PubMed
    1. Supattapone S. Synthesis of high titer infectious prions with cofactor molecules. J. Biol. Chem. 2014;289:19850–19854. doi: 10.1074/jbc.R113.511329. - DOI - PMC - PubMed
    1. Prusiner SB. Prions. Proc. Natl Acad. Sci. USA. 1998;95:13363–13383. doi: 10.1073/pnas.95.23.13363. - DOI - PMC - PubMed

Publication types