

3D patient-specific modeling and structural finite element analysis of atherosclerotic carotid artery based on computed tomography angiography
- PMID: 37964071
- PMCID: PMC10645924
- DOI: 10.1038/s41598-023-46949-5
3D patient-specific modeling and structural finite element analysis of atherosclerotic carotid artery based on computed tomography angiography
Abstract
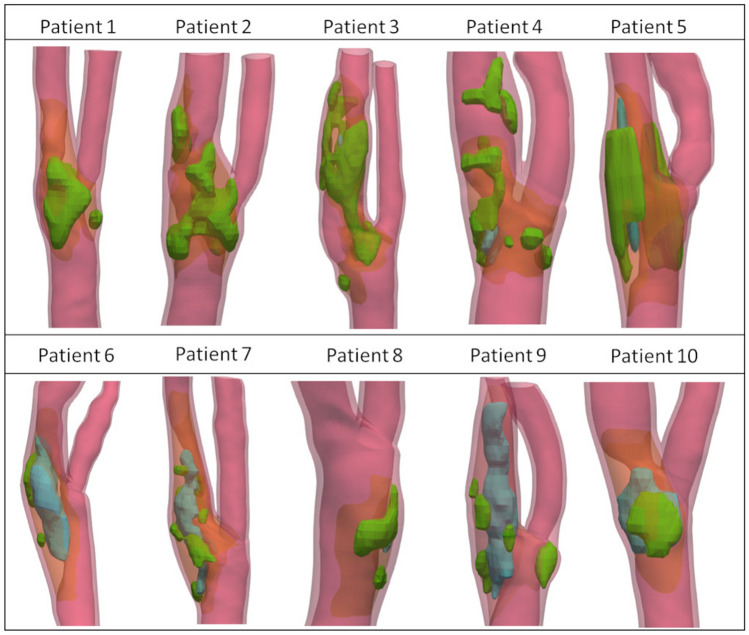
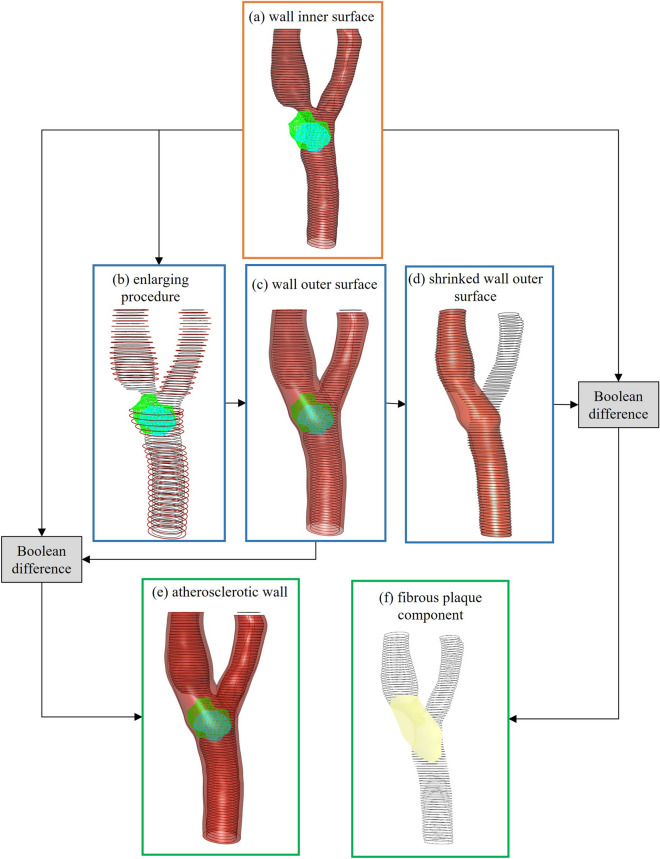
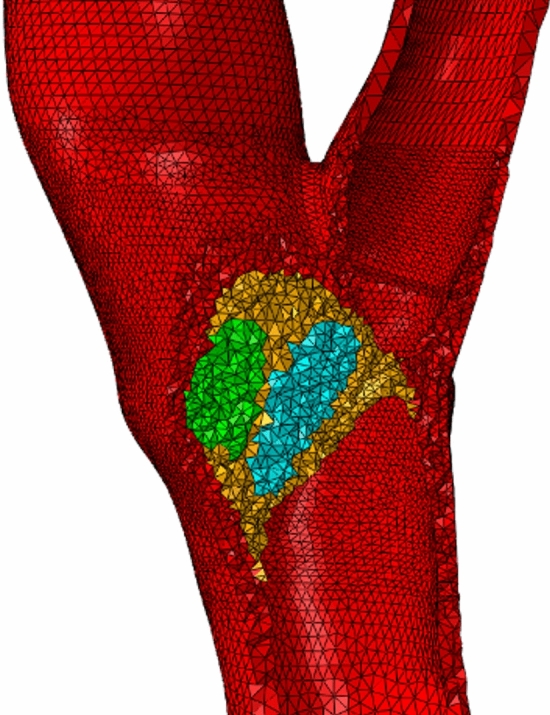
The assessment of carotid plaque vulnerability is a relevant clinical information that can help prevent adverse cerebrovascular events. To this aim, in this study, we propose a patient-specific computational workflow to quantify the stress distribution in an atherosclerotic carotid artery, by means of geometric modeling and structural simulation of the plaque and vessel wall. Ten patients were involved in our study. Starting with segmentation of the lumen, calcific and lipid plaque components from computed tomography angiography images, the fibrous component and the vessel wall were semi-automatically reconstructed with an ad-hoc procedure. Finite element analyses were performed using local pressure values derived from ultrasound imaging. Simulation outputs were analyzed to assess how mechanical factors influence the stresses within the atherosclerotic wall. The developed reconstruction method was first evaluated by comparing the results obtained using the automatically generated fibrous component model and the one derived from image segmentation. The high-stress regions in the carotid artery wall around plaques suggest areas of possible rupture. In mostly lipidic and heterogeneous plaques, the highest stresses are localized at the interface between the lipidic components and the lumen, in the fibrous cap.
© 2023. The Author(s).
Conflict of interest statement
The authors declare no competing interests.
Figures


Similar articles
-
Impact of plaque haemorrhage and its age on structural stresses in atherosclerotic plaques of patients with carotid artery disease: an MR imaging-based finite element simulation study.Int J Cardiovasc Imaging. 2011 Mar;27(3):397-402. doi: 10.1007/s10554-010-9679-z. Epub 2010 Aug 11. Int J Cardiovasc Imaging. 2011. PMID: 20700655
-
Case Report: Evaluating Biomechanical Risk Factors in Carotid Stenosis by Patient-Specific Fluid-Structural Interaction Biomechanical Analysis.Cerebrovasc Dis. 2021;50(3):262-269. doi: 10.1159/000514138. Epub 2021 Mar 19. Cerebrovasc Dis. 2021. PMID: 33744885
-
Morphometric and Mechanical Analyses of Calcifications and Fibrous Plaque Tissue in Carotid Arteries for Plaque Rupture Risk Assessment.IEEE Trans Biomed Eng. 2021 Apr;68(4):1429-1438. doi: 10.1109/TBME.2020.3038038. Epub 2021 Mar 18. IEEE Trans Biomed Eng. 2021. PMID: 33186100
-
Review: Mechanical Characterization of Carotid Arteries and Atherosclerotic Plaques.IEEE Trans Ultrason Ferroelectr Freq Control. 2016 Oct;63(10):1613-1623. doi: 10.1109/TUFFC.2016.2572260. Epub 2016 May 26. IEEE Trans Ultrason Ferroelectr Freq Control. 2016. PMID: 27249826 Review.
-
Contemporary carotid imaging: from degree of stenosis to plaque vulnerability.J Neurosurg. 2016 Jan;124(1):27-42. doi: 10.3171/2015.1.JNS142452. Epub 2015 Jul 31. J Neurosurg. 2016. PMID: 26230478 Review.
Cited by
-
Combining Computational Fluid Dynamics, Structural Analysis, and Machine Learning to Predict Cerebrovascular Events: A Mild ML Approach.Diagnostics (Basel). 2024 Oct 2;14(19):2204. doi: 10.3390/diagnostics14192204. Diagnostics (Basel). 2024. PMID: 39410608 Free PMC article.
-
Circular RNA role in Atherosclerosis Development and Progression.Curr Atheroscler Rep. 2025 Jun 3;27(1):60. doi: 10.1007/s11883-025-01306-x. Curr Atheroscler Rep. 2025. PMID: 40459649 Free PMC article. Review.
-
Biomechanical assessment of vulnerable plaque: from histological evidence to ultrasound elastography and image-based computational patient-specific modelling.Front Bioeng Biotechnol. 2025 Mar 7;13:1478408. doi: 10.3389/fbioe.2025.1478408. eCollection 2025. Front Bioeng Biotechnol. 2025. PMID: 40124246 Free PMC article.
References
Publication types
MeSH terms
LinkOut - more resources
Full Text Sources
Medical
Miscellaneous
