. 2023 Nov 15;13(1):98.
doi: 10.1186/s13550-023-01023-z.

Characterisation of a novel [18F]FDG brain PET database and combination with a second database for optimising detection of focal abnormalities, using focal cortical dysplasia as an example

Affiliations

Characterisation of a novel [18F]FDG brain PET database and combination with a second database for optimising detection of focal abnormalities, using focal cortical dysplasia as an example

Sameer Omer Jin et al. EJNMMI Res. .

Abstract

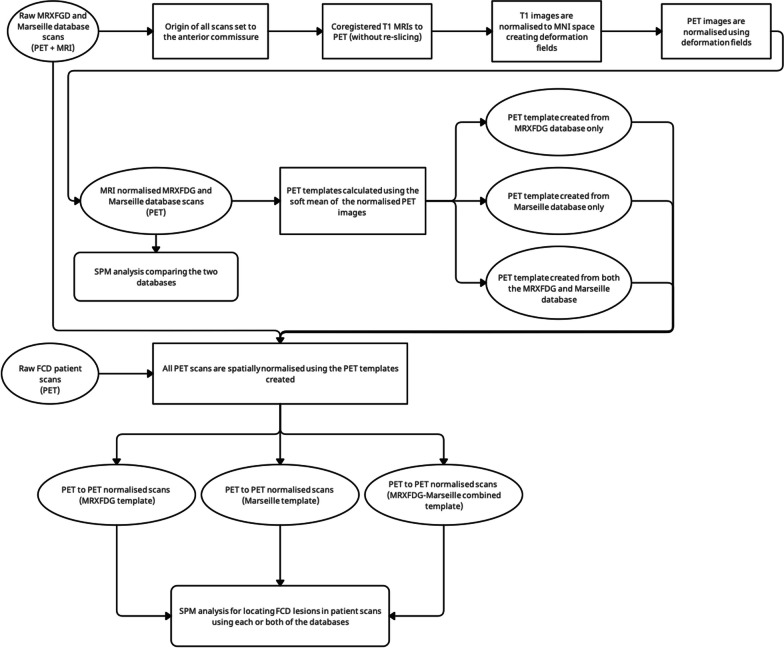
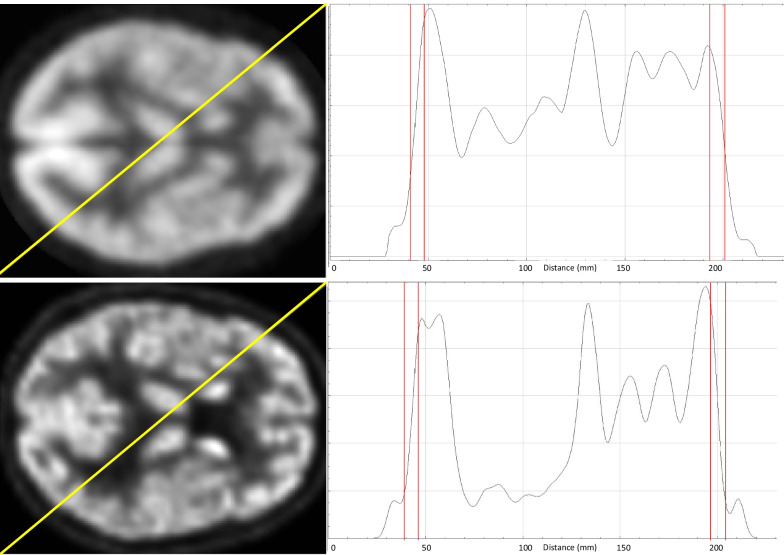
Background: Brain [18F]FDG PET is used clinically mainly in the presurgical evaluation for epilepsy surgery and in the differential diagnosis of neurodegenerative disorders. While scans are usually interpreted visually on an individual basis, comparison against normative cohorts allows statistical assessment of abnormalities and potentially higher sensitivity for detecting abnormalities. Little work has been done on out-of-sample databases (acquired differently to the patient data). Combination of different databases would potentially allow better power and discrimination. We fully characterised an unpublished healthy control brain [18F]FDG PET database (Marseille, n = 60, ages 21-78 years) and compared it to another publicly available database (MRXFDG, n = 37, ages 23-65 years). We measured and then harmonised spatial resolution and global values. A collection of patient scans (n = 34, 13-48 years) with histologically confirmed focal cortical dysplasias (FCDs) obtained on three generations of scanners was used to estimate abnormality detection rates using standard software (statistical parametric mapping, SPM12).

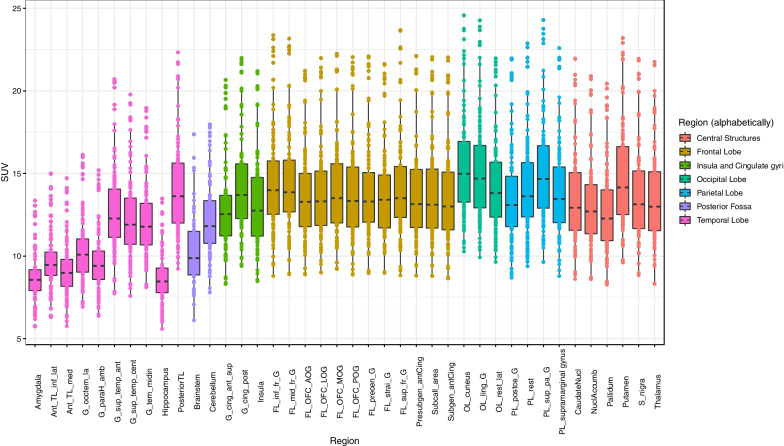
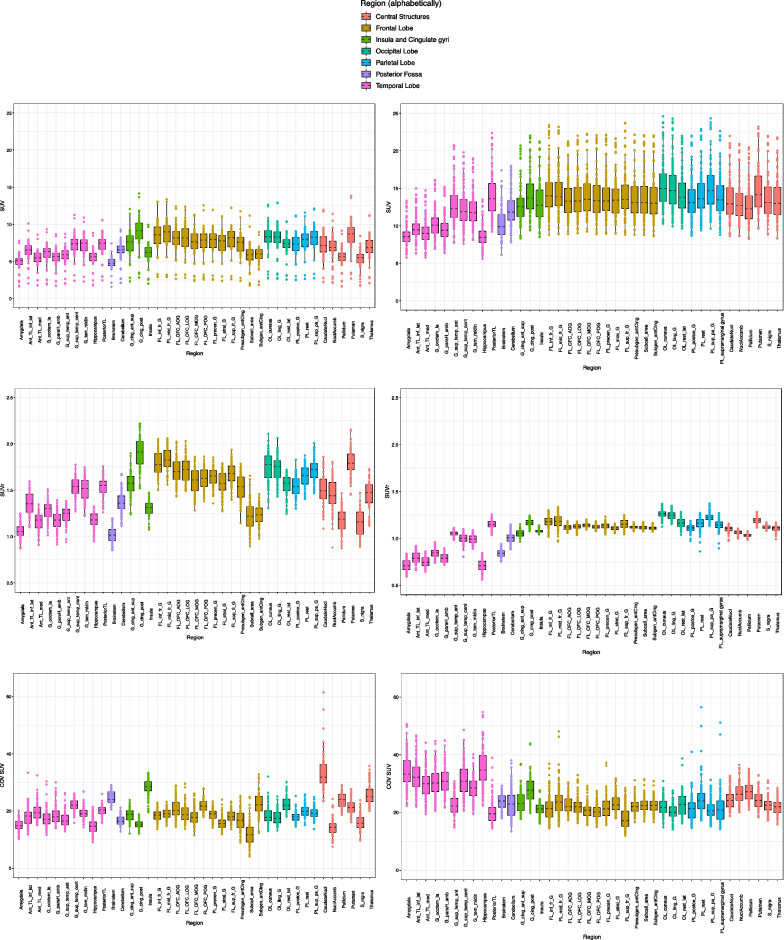
Results: Regional SUVs showed similar patterns, but global values and resolutions were different as expected. Detection rates for the FCDs were 50% for comparison with the Marseille database and 53% for MRXFDG. Simply combining both databases worsened the detection rate to 41%. After harmonisation of spatial resolution, using a full factorial design matrix to accommodate global differences, and leaving out controls older than 60 years, we achieved detection rates of up to 71% for both databases combined. Detection rates were similar across the three scanner types used for patients, and high for patients whose MRI had been normal (n = 10/11).

Conclusions: As expected, global and regional data characteristics are database specific. However, our work shows the value of increasing database size and suggests ways in which database differences can be overcome. This may inform analysis via traditional statistics or machine learning, and clinical implementation.

Keywords: Anomaly detection; Harmonisation; Interscanner differences; Smoothness; Statistical parametric mapping (SPM).


Conflict of interest statement

Academic licences for the Hammers Atlas Database are freely available via www.brain-development.org/brain-atlases. The atlases are also commercially licenced through Imperial Innovations with a share of the royalties received by Alexander Hammers. The authors have no other relevant financial or non-financial interests to disclose.

Figures

Fig. 1
Fig. 1
Flowchart of SPM analyses comparing the MRXFDG and Marseille databases and comparing individual FCD patients against separate and combined databases. For details, see text
Fig. 2
Fig. 2
Method for determining smoothness: selected slice and profile line (left side of Figure) and corresponding intensity profile (right side of Figure) for one subject of the Marseille database (top row) and one subject of iDB-MRXFDG (bottom row)
Fig. 3
Fig. 3
Regional SUV for all retained subjects (n = 54) in the Marseille database. Centre lines = medians, boxes = interquartile ranges, whiskers = robust ranges (1.5 × interquartile ranges). Outliers are represented as dots. Each dot represents a participant for unpaired regions and a participant’s right or left SUV value for paired regions. TL, temporal lobe; ant, anterior; inf, inferior; lat, lateral; med, medial; G_occtem_la, lateral occipitotemporal (fusiform) gyrus; G_paraH_amb, parahippocampal and ambient gyrus; G_sup_temp_ant, superior temporal gyrus, anterior part; G_sup_temp_cent, superior temporal gyrus, central part; G_tem_midin, middle and inferior temporal gyrus; G_cing_ant_sup, anterior (superior) cingulate gyrus; G_cing_post, posterior cingulate gyrus; FL, frontal lobe; FL_inf_fr_G, inferior frontal gyrus; F_mid_fr_G, middle frontal gyrus; OFC, orbitofrontal cortex; AOG, anterior orbital gyrus; LOG, lateral orbital gyrus; MOG, medial orbital gyrus; POG, posterior orbital gyrus; precen_G, precentral gyrus; strai_G, straight gyrus; sup_fr_G, superior frontal gyrus; Presubgen_antCing, presubgenual anterior cingulate gyrus; subcall_area; subcallosal area; subgen_antCing, subgenual anterior cingulate gyrus; OL, occipital lobe; ling_G, lingual gyrus; rest_lat, lateral remainder of occipital lobe; PL, parietal lobe; postce_G, postcentral gyrus; PL_rest, angular gyrus; sup_pa_G, superior parietal lobule; Nucl, nucleus; S_nigra, substantia nigra
Fig. 4
Fig. 4
Regional SUVr obtained by normalizing by mean SUV in ICV mask for all subjects retained (n = 54) in the Marseille database. Graphics and abbreviations as in Fig. 3
Fig. 5
Fig. 5
Regional SUV (row 1), SUVr (row 2) and SUV coefficient of variation (row 3) for MRXFDG (left column) and Marseile database (right column). Abbreviations as in Fig. 3

References

    1. Mérida I, Jung J, Bouvard S, et al. CERMEP-IDB-MRXFDG: a database of 37 normal adult human brain [18F]FDG PET, T1 and FLAIR MRI, and CT images available for research. EJNMMI Res. 2021;11(1):91. doi: 10.1186/s13550-021-00830-6. - DOI - PMC - PubMed
    1. Coupé P, Catheline G, Lanuza E, Manjon J. Towards a unified analysis of brain maturation and aging across the entire lifespan: a MRI analysis. Hum Brain Mapp. 2017 doi: 10.1002/hbm.23743. - DOI - PMC - PubMed
    1. Huppertz H-J, Wellmer J, Staack AM, Altenmüller D-M, Urbach H, Kröll J. Voxel-based 3D MRI analysis helps to detect subtle forms of subcortical band heterotopia. Epilepsia. 2008;49(5):772–785. doi: 10.1111/j.1528-1167.2007.01436.x. - DOI - PubMed
    1. Archambaud F, Bouilleret V, Hertz-Pannier L, et al. Optimizing statistical parametric mapping analysis of 18F-FDG PET in children. EJNMMI Res. 2013;3(1):2. doi: 10.1186/2191-219X-3-2. - DOI - PMC - PubMed
    1. Wei L, Guo K, Li Y, et al. Construction of a novel Chinese normal brain database using 18F-FDG PET images and MIMneuro software, the initial application in epilepsy. Int J Neurosci. 2019;129(5):417–422. doi: 10.1080/00207454.2018.1538138. - DOI - PubMed