. 2023 Nov 15;14(1):17.
doi: 10.1186/s13100-023-00305-6.

Long noncoding RNAs emerge from transposon-derived antisense sequences and may contribute to infection stage-specific transposon regulation in a fungal phytopathogen

Affiliations

Long noncoding RNAs emerge from transposon-derived antisense sequences and may contribute to infection stage-specific transposon regulation in a fungal phytopathogen

Jiangzhao Qian et al. Mob DNA. .

Abstract

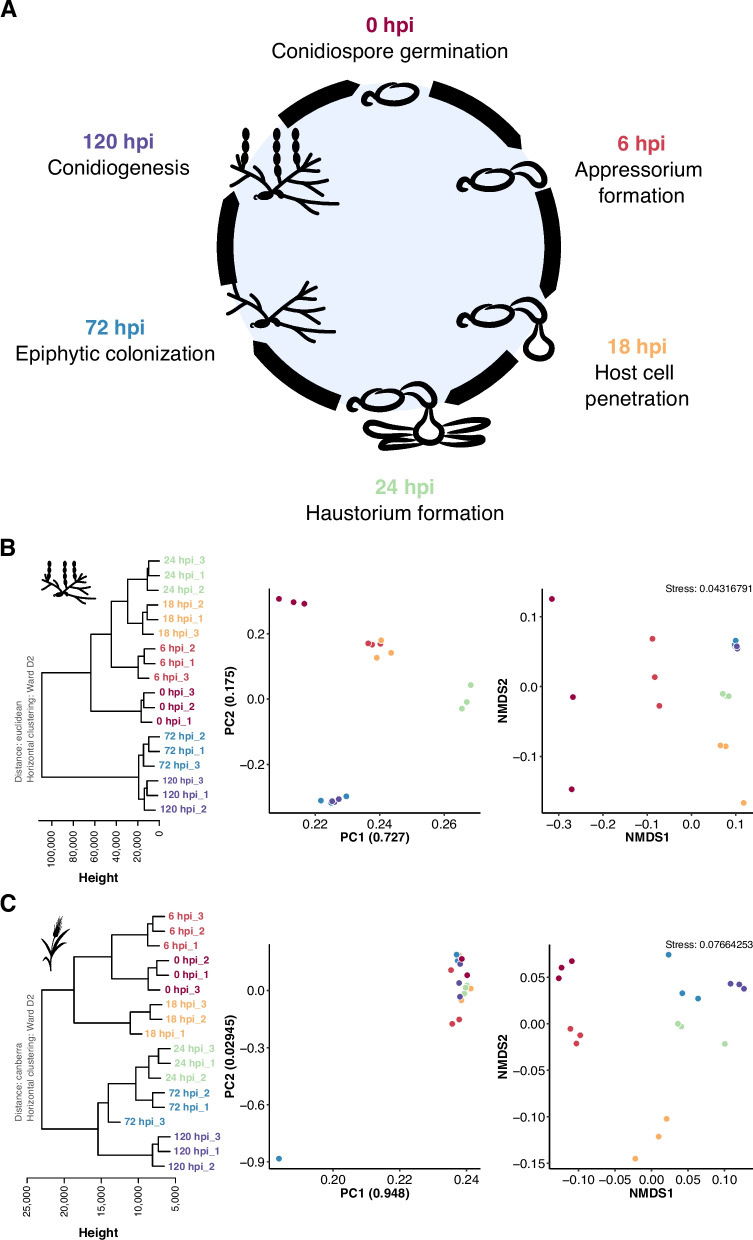
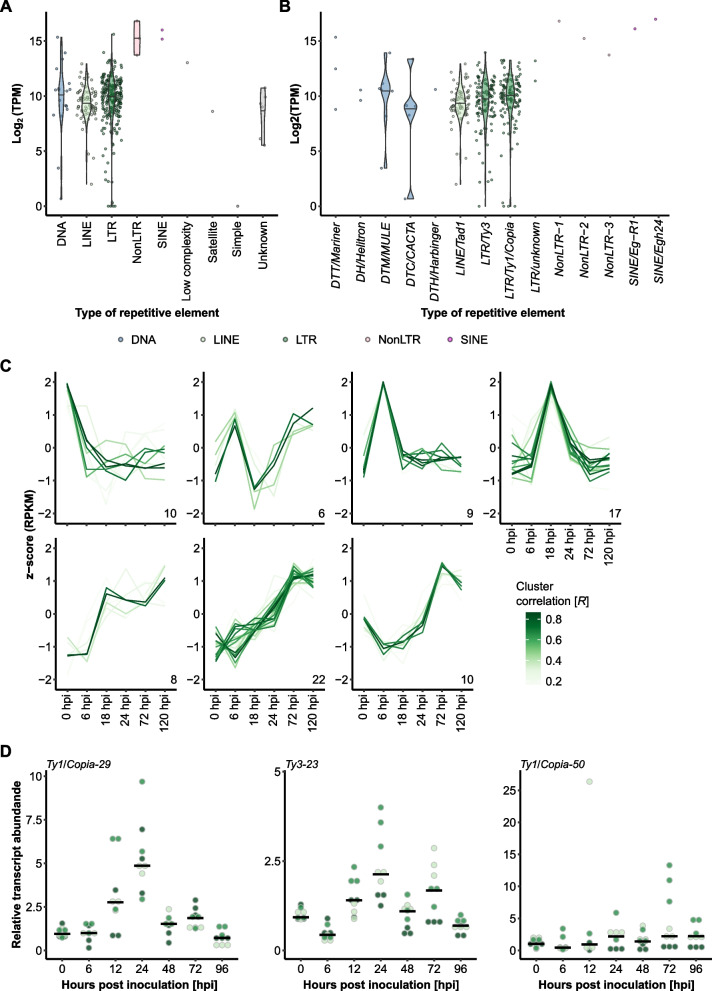
Background: The genome of the obligate biotrophic phytopathogenic barley powdery mildew fungus Blumeria hordei is inflated due to highly abundant and possibly active transposable elements (TEs). In the absence of the otherwise common repeat-induced point mutation transposon defense mechanism, noncoding RNAs could be key for regulating the activity of TEs and coding genes during the pathogenic life cycle.

Results: We performed time-course whole-transcriptome shotgun sequencing (RNA-seq) of total RNA derived from infected barley leaf epidermis at various stages of fungal pathogenesis and observed significant transcript accumulation and time point-dependent regulation of TEs in B. hordei. Using a manually curated consensus database of 344 TEs, we discovered phased small RNAs mapping to 104 consensus transposons, suggesting that RNA interference contributes significantly to their regulation. Further, we identified 5,127 long noncoding RNAs (lncRNAs) genome-wide in B. hordei, of which 823 originated from the antisense strand of a TE. Co-expression network analysis of lncRNAs, TEs, and coding genes throughout the asexual life cycle of B. hordei points at extensive positive and negative co-regulation of lncRNAs, subsets of TEs and coding genes.

Conclusions: Our work suggests that similar to mammals and plants, fungal lncRNAs support the dynamic modulation of transcript levels, including TEs, during pivotal stages of host infection. The lncRNAs may support transcriptional diversity and plasticity amid loss of coding genes in powdery mildew fungi and may give rise to novel regulatory elements and virulence peptides, thus representing key drivers of rapid evolutionary adaptation to promote pathogenicity and overcome host defense.

Keywords: Blumeria; Co-expression; Long noncoding RNA (lncRNA); Powdery mildew; RNA interference; Transposable element.


Conflict of interest statement

The authors declare no competing interests.

Figures

Fig. 1
Fig. 1
RNA-seq data obtained from B. hordei-infected barley leaf epidermal peelings exhibits time point-dependent clustering. A We sampled B. hordei isolate K1AC-infected barley abaxial leaf epidermis at time points across the asexual life cycle of the fungus. The pictograms indicate the fungal stage from conidiospore germination (0 hpi) to conidiogenesis, i.e., asexual spore formation (120 hpi). B and C Left panels: Horizontal clustering using the normalized gene expression values of B. hordei isolate K1AC (B) and H. vulgare cv. ‘Margret’ (C), respectively, was calculated with Euclidean distance and Ward.D2 clustering in R. Height indicates the Euclidean distance between samples. Middle panels: Principal components were computed using the R algorithm prcomp. The percentage of sample divergence explained by the principal components PC1 and PC2 are indicated as ratios in the axis labels. Right panels: Non-metric multidimensional scaling (NMDS). Colors: Burgundy, 0 hpi; red, 6 hpi; yellow, 18 hpi; light green, 24 hpi; blue, 72 hpi; purple, 120 hpi
Fig. 2
Fig. 2
TE families exhibit infection stage-specific expression patterns. A and B We mapped the reads from the time-course RNA-seq experiment to our repetitive elements database containing 344 individual non-redundant TE families (Table 1). The violin plots show the Log2 of the average normalized expression (y-axis) of each family expressed as transcripts per million (TPM); the types of repetitive elements (blue, DNA transposons; light green, LINE; dark green, LTR; red, NonLTR retrotransposons; magenta, SINE; grey, low complexity regions, satellites, simple repeats, and unknown repeats) are indicated on the x-axis. C We used TCseq [37] to cluster time-course expression patterns of the 344 consensus TEs. The lines represent single consensus TEs; the color shade denotes the cluster membership by Spearman correlation (the darker the shade of green, the higher the correlation R with the respective expression cluster according to the color scheme). The x-axis denotes the time points of infection (Fig. 1A), i.e., 0 hpi (conidiospore germination), 6 hpi (appressorium formation), 18 hpi (host cell penetration), 24 hpi (haustorium formation), 72 hpi (epiphytic colonization), and 120 hpi (conidiogenesis). The y-axis indicates the relative z-score based on reads per kb of transcript per million mapped reads (RPKM). D We conducted qRT-PCR analysis of selected TE families (for the whole set of tested TE families, see Supplementary Fig. 2). The dot plots display the relative transcript abundance (according to ΔΔCT analysis; y-axis) of the respective TE family indicated on the top-left in B. hordei isolate K1AC at seven time points of host infection (x-axis; see also Fig. 1A). TE transcript levels were normalized to B. hordei GAPDH (BLGH_00691); three independent replicates (n = 3), consisting of three technical replicates each, were performed. The shades of green indicate the replicate each data point belongs to; the black bar shows the median
Fig. 3
Fig. 3
Noncoding RNAs are associated with TEs in B. hordei. A We mapped publicly available sRNA-seq datasets obtained from B. hordei-infected barley plants to the TE consensus database using bowtie [41] and identified candidate phasiRNAs using unitas [40]. The donut chart shows the number of consensus TEs to which phasiRNAs were linked (green portion of inner circle), the number of elements accounting for the different TE families (Table 1; second circle), and the number of consensus TEs whose expression peaks at specific time points (Fig. 2; outer circle). B Example of stacked phasiRNAs mapped to the consensus sequence of TE Ty3/mdg4-17 (6,054 bp in length). The TE self-propagation genes are indicated on top (green arrows); these genes encode RT (reverse transcriptase), RNase H, and DNA integrase. The scale below the black horizontal line indicates the TE length and position in bp. Mapped sRNAs are shown in the windows below the size scale for two examples: derived from infected leaf epidermal cells at 120 hpi [15] and derived from infected total leaf material at 24 hpi [39]. Grey blocks indicate single reads; the black boxes on top of each graph display predicted clusters of phasiRNAs. Colored blocks indicate read mismatches with the reference sequence: blue, C; red, T; orange, G; green, A. Data were visualized using Integrative Genomics Viewer v2.9.4 [42]. C The dot plot shows the time course expression patterns of selected consensus TEs using the RNA-seq dataset generated in this study. The y-axis shows the normalized expression expressed as transcripts per million (TPM); the x-axis indicates the respective time point of the asexual life cycle of B. hordei (Fig. 1A). The selected TE consensus elements are indicated on the top-left of each plot. D Example of an antisense lncRNA occurring in the consensus TE Ty1/Copia-63 (5,317 bp in length). The upper lane indicates annotated transcripts on the TE, where TE self-propagation genes are indicated in green (genes encode RT (reverse transcriptase), gag polyprotein, and DNA integrase) and three detected isoforms of associated lncRNAs in orange. The scale below the black horizontal line indicates the TE length and position in bp. The second panel indicates long reads obtained via ONT transcriptome sequencing at 144 hpi; colored lines indicate mismatches between read and reference sequence. The two lower panels show RNA-seq read mappings to this TE as colored lines. Green, stranded reads aligning to the sense strand; Orange, stranded reads aligning to the antisense strand. Grey lines indicate reads split due to predicted splicing events. Data were visualized using Integrative Genomics Viewer v2.9.4 [42]. E We amplified several TE antisense lncRNAs from B. hordei cDNA using sequence-specific primer pairs. The agarose gel shows PCR-amplified lncRNAs (indicated above each lane), arrows indicate the expected PCR products. Expected PCR amplicon sizes were: BLGHnc_000942-RA (Ty3/mdg4-23 antisense), 2,831 bp; BLGHnc_004556-RA (Ty1/Copia-23 antisense), 2,888 bp; BLGHnc_000243-RA (Ty3/mdg4-1 antisense), 1,150 bp; BLGHnc_003729-RB (Ty3/mdg4-9 antisense), 1,065 bp; BLGHnc_000866-RA (Ty3/mdg4-62 antisense), 2,187 bp; BLGHnc_03526-RA (Ty1/Copia-63 antisense), 1,419 bp; BLGHnc_003513-RB (intergenic), 922 bp; BLGHnc_004496-RA (intergenic), 2,128 bp. Bands corresponding to the expected product size were excised from the gel and their sequence identity confirmed by amplicon sequencing. NPC, no primer control. DNA Ladder, 1 kb plus (Invitrogen-Thermo Fisher, Waltham, MA, USA). F The genomic transcript models of BLGHnc_000942-RA, BLGHnc_004556-RA, BLGHnc_000243-RA, BLGHnc_003729-RB, BLGHnc_000866-RA, BLGHnc_03526-RA, BLGHnc_003513-RB, and BLGHnc_004496-RA. Orange blocks represent exons and grey lines spliced introns
Fig. 4
Fig. 4
Genome-wide identification and characterization of B. hordei lncRNAs. A Using the total RNA-seq data mapped to the genome of B. hordei isolate DH14 [10] with HISAT2 [45], we assembled transcripts with StringTie [43]. Next, we filtered out coding genes from the transcriptome by Gffcompare [46], transcripts shorter than 200 bp using Gffread [46], transcripts with coding potential using CPC2 [47], and transcripts accounting for ribosomal RNA, transfer RNA, small nuclear RNA, and small nucleolar RNA via CMscan search against the Rfam database [48]. Then, we used FEELnc [49] for lncRNA annotation and classification, resulting in 17,226 putative lncRNAs in the reference genome of B. hordei. Lastly, we manually inspected the predicted lncRNA models by our Web Apollo [44] instance, yielding in total 5,127 unique lncRNA loci in B. hordei. B Histogram for the transcript length in base pairs (bp; x-axis) against the number of coding genes (mRNAs, purple) and lncRNAs (orange; y-axis). The violin plot above shows the overall distribution of gene lengths; data points represent individual transcripts. C Bar graph of the exon number per transcript (x-axis) against the gene number (y-axis). Purple, mRNAs; orange, lncRNAs. D The violin plot shows the expression in Log2(transcripts per million (TPM)) for mRNAs (purple), lncRNAs in sense orientation of associated genes (blue), lncRNAs in antisense orientation of TEs (orange), intronic lncRNAs (grey), and intergenic lncRNAs (green). The number of transcripts (n) contributing to the respective subset are given on the top. E The box plot shows the transcript levels in Log2(TPM) for lncRNAs (orange) and mRNAs (purple) depending on the transcript exon number (x-axis). F The histogram shows the number of transcripts (x-axis) encoded by lncRNA genes (y-axis). G The stacked bar graph displays the occurrence of alternatively spliced lncRNA transcripts (AS, alternative splicing; orange bar) and the number and type of alternative splicing events in B. hordei. The types of events are illustrated by the drawings, where the red portion of the exon indicates the alternative event and black lines connecting exons splice events, colored in shades of red and orange according to event. From dark red to dark orange, events are shown in this order: retained intron, alternative 3’ splice site, alternative 5’ splice site, skipped exon, alternative last exon, and alternative first exon. H The dot plots show the transcript levels in TPM for alternatively spliced isoforms of the lncRNA BLGHnc_000769 (y-axis) at six time points of host infection (x-axis). Note that isoform BLGHnc_000769-RA was not expressed above background levels and thus omitted from this Figure. The black bar indicates the median of three independent replicates (n = 3)
Fig. 5
Fig. 5
B. hordei exhibits infection stage-dependent expression patterns of coding genes and lncRNAs. A We used TCseq [37] to cluster time-resolved coding gene and lncRNA expression patterns. The lines represent single transcripts; the color shade denotes the cluster membership by Spearman correlation (the darker the shade of orange, the higher the correlation R with the respective expression cluster according to the color scheme). The x-axis denotes the time points of infection (Fig. 1A), i.e., 0 hpi (conidiospore germination), 6 hpi (appressorium formation), 18 hpi (host cell penetration), 24 hpi (haustorium formation), 72 hpi (epiphytic colonization), and 120 hpi (conidiogenesis). The y-axis indicates the relative z-score based on reads per kb of transcript per million mapped reads (RPKM). B The heat map shows the relative median expression of genes encoding putative secreted proteins across the time points according to the color scheme below the heat map. Purple indicates high and white low expression. The time course cluster number (A) is indicated next to the dendrogram above the heat map. C The stacked bar graph shows the number of lncRNAs (orange) and mRNAs (purple) in each cluster, indicating mRNAs encoding putative secreted proteins (blue) or Sgk2-like kinases (brown). The x-axis indicates the co-expression cluster (A) and is annotated with a dot plot below to highlight the time point represented by each cluster. The y-axis shows the number of transcripts. D We conducted gene ontology (GO) enrichment analysis for the coding genes from each cluster (A) using ShinyGO v0.77 [51] accessed online at http://bioinformatics.sdstate.edu/go/, and summarized GO terms with REVIGO [52]. The dot plot shows the fold enrichment of functional terms compared to the full set of genes of B. hordei (dot size); the fill color denotes the − Log10(FDR-adjusted enrichment p value) according to the color scheme on the right. The summarizing GO descriptions are provided below the GO identifiers (x-axis), the respective co-expression cluster (A) is indicated on the y-axis
Fig. 6
Fig. 6
Co-expression patterns of TEs and lncRNAs in B. hordei. A We used TCseq [37] to cluster time-resolved coding gene (mRNA), lncRNA, and consensus TE expression patterns. Each line represents a single transcript; the color shade indicates the cluster membership according to Spearman correlation (the darker the color, the higher the correlation R with the respective expression cluster; see color scheme in the bottom right corner). Shades of purple (upper panel), mRNAs; shades of orange (middle panel), lncRNAs; shades of green (bottom panel), consensus TEs. The x-axis indicates the time points of infection: 0 hpi (spore germination), 6 hpi (appressorium formation), 18 hpi (early primary haustorium), 24 hpi (mature primary haustorium), 72 hpi (host colonization), and 120 hpi (conidia formation). The y-axis displays the relative z-score based on reads per kb of transcript per million mapped reads (RPKM). B Co-regulation networks were discovered using WGCNA [55]. The colored circles indicate transcripts (purple, mRNA; orange, lncRNA; green, consensus TE) and lines significant correlation between two transcripts. The WGCNA-assigned cluster colors are indicated on the top-left of each corresponding cluster of transcripts; the number of genes encoding putative secreted proteins in the respective co-expression cluster is indicated. The clusters were arranged to correspond to the time-resolved expression patterns shown above in (A). C-E The dot plots show examples of expression patterns of TE antisense lncRNA and the corresponding TE, as indicated on top of each plot. Expression values are shown as TPM (y-axis) during six time points of host infection (x-axis; Fig. 1A). The black bar indicates the median of three independent replicates (n = 3)

Similar articles

Cited by

References

    1. Wicker T, Sabot F, Hua-Van A, Bennetzen JL, Capy P, Chalhoub B, et al. A unified classification system for eukaryotic transposable elements. Nat Rev Genet. 2007;8:973–982. doi: 10.1038/nrg2165. - DOI - PubMed
    1. Lanciano S, Cristofari G. Measuring and interpreting transposable element expression. Nat Rev Genet. 2020;21:721–736. doi: 10.1038/s41576-020-0251-y. - DOI - PubMed
    1. Chénais B, Caruso A, Hiard S, Casse N. The impact of transposable elements on eukaryotic genomes: From genome size increase to genetic adaptation to stressful environments. Gene. 2012;509:7–15. doi: 10.1016/j.gene.2012.07.042. - DOI - PubMed
    1. Chuong EB, Elde NC, Feschotte C. Regulatory activities of transposable elements: From conflicts to benefits. Nat Rev Genet. 2017;18:71–86. doi: 10.1038/nrg.2016.139. - DOI - PMC - PubMed
    1. Slotkin RK, Martienssen R. Transposable elements and the epigenetic regulation of the genome. Nat Rev Genet. 2007;8:272–285. doi: 10.1038/nrg2072. - DOI - PubMed

LinkOut - more resources