. 2023 Nov 14;25(1):143.
doi: 10.1186/s13058-023-01736-y.

Formation of an invasion-permissive matrix requires TGFβ/SNAIL1-regulated alternative splicing of fibronectin

Affiliations

Formation of an invasion-permissive matrix requires TGFβ/SNAIL1-regulated alternative splicing of fibronectin

Héctor Franco-Valls et al. Breast Cancer Res. .

Abstract

Background: As in most solid cancers, the emergence of cells with oncogenic mutations in the mammary epithelium alters the tissue homeostasis. Some soluble factors, such as TGFβ, potently modify the behavior of healthy stromal cells. A subpopulation of cancer-associated fibroblasts expressing a TGFβ target, the SNAIL1 transcription factor, display myofibroblastic abilities that rearrange the stromal architecture. Breast tumors with the presence of SNAIL1 in the stromal compartment, and with aligned extracellular fiber, are associated with poor survival prognoses.

Methods: We used deep RNA sequencing and biochemical techniques to study alternative splicing and human tumor databases to test for associations (correlation t-test) between SNAIL1 and fibronectin isoforms. Three-dimensional extracellular matrices generated from fibroblasts were used to study the mechanical properties and actions of the extracellular matrices on tumor cell and fibroblast behaviors. A metastatic mouse model of breast cancer was used to test the action of fibronectin isoforms on lung metastasis.

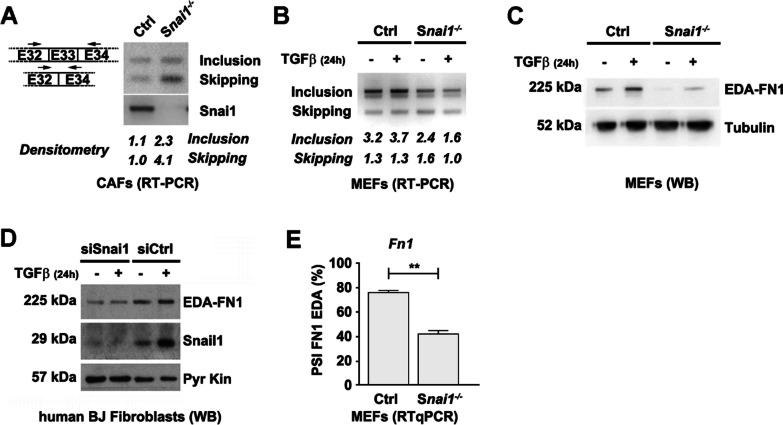
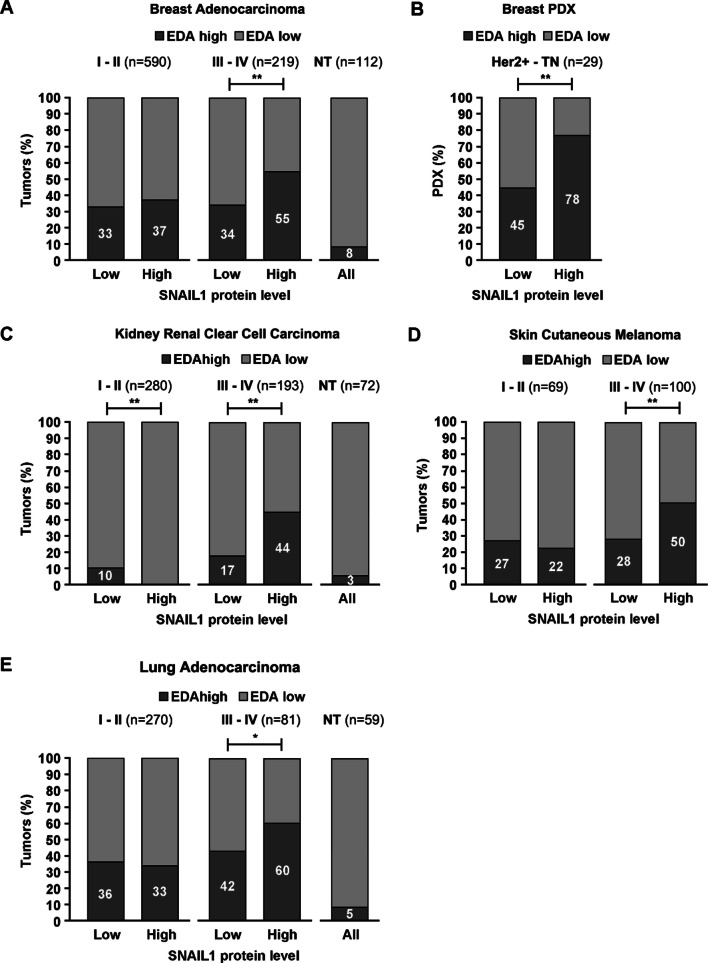
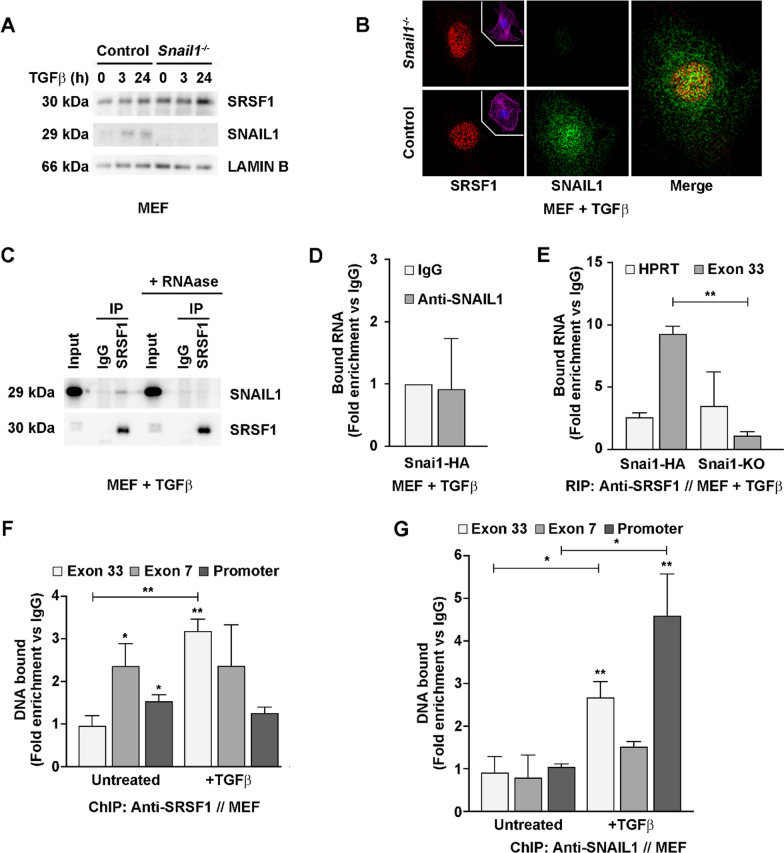
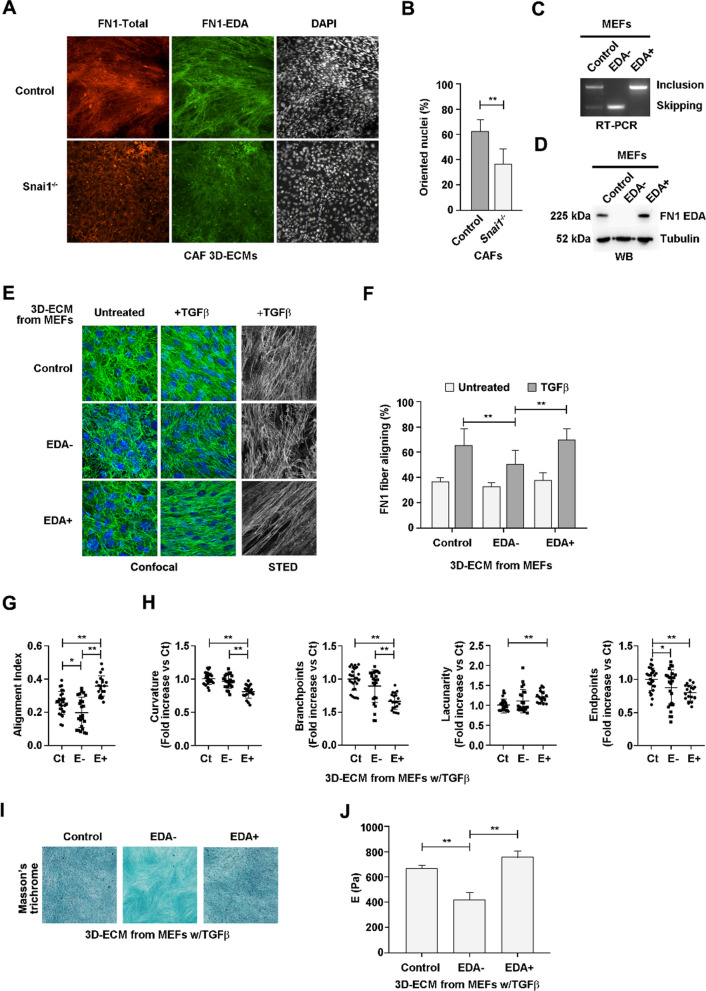
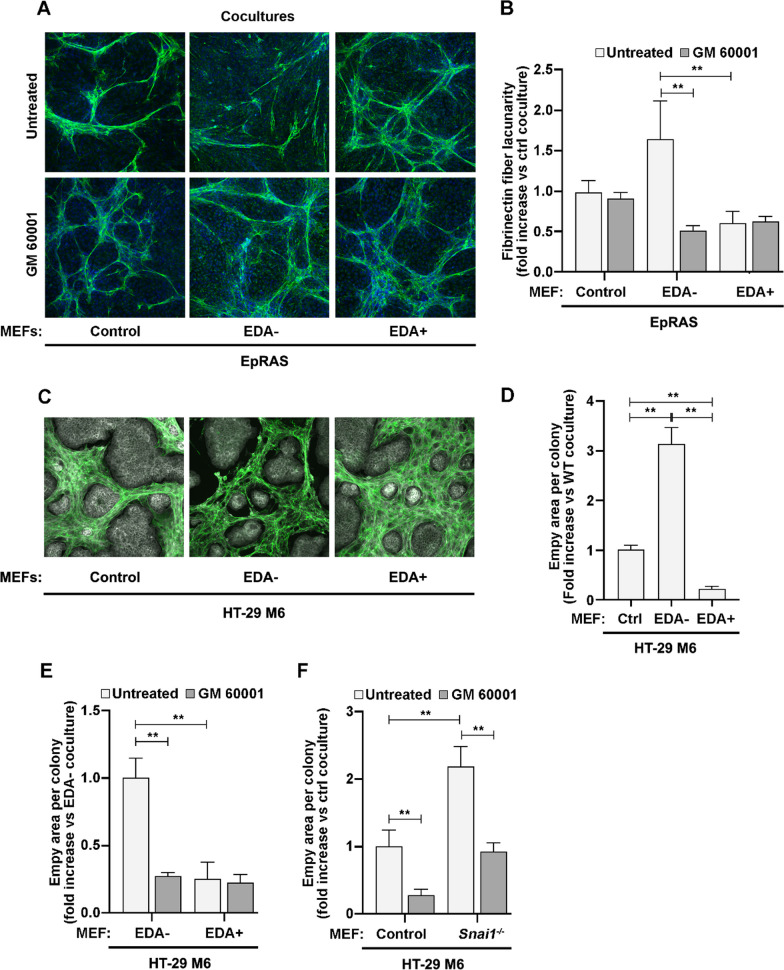
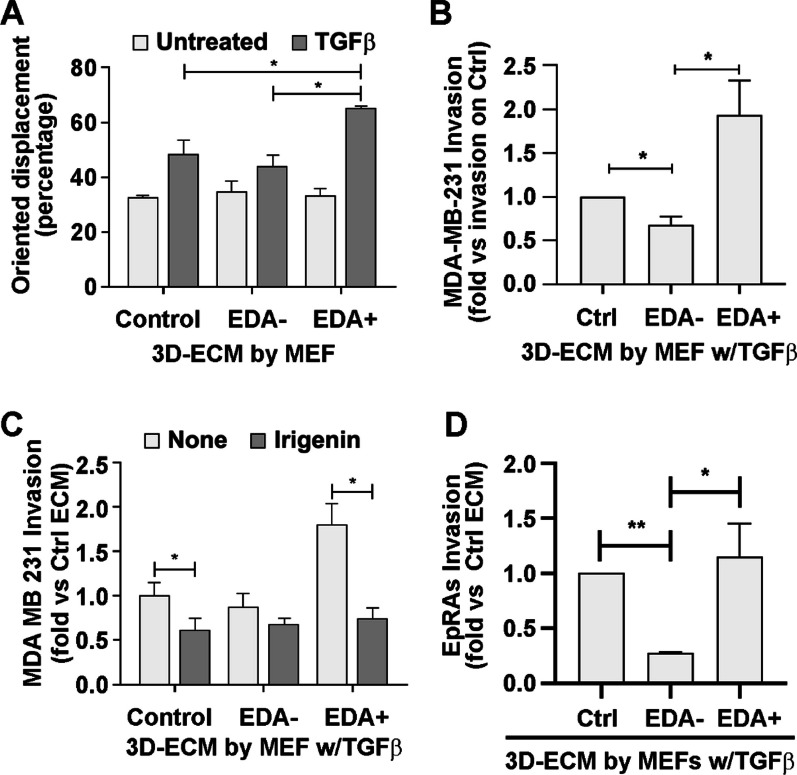
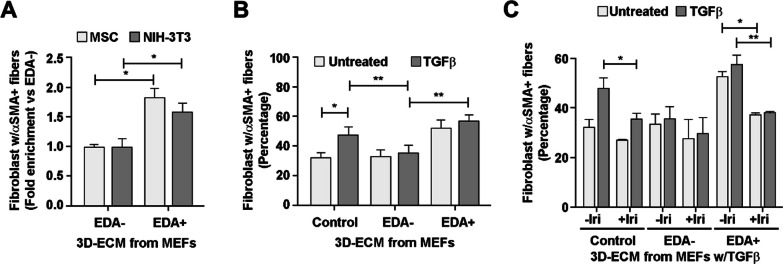
Results: In silico studies showed that SNAIL1 correlates with the expression of the extra domain A (EDA)-containing (EDA+) fibronectin in advanced human breast cancer and other types of epithelial cancers. In TGFβ-activated fibroblasts, alternative splicing of fibronectin as well as of 500 other genes was modified by eliminating SNAIL1. Biochemical analyses demonstrated that SNAIL1 favors the inclusion of the EDA exon by modulating the activity of the SRSF1 splicing factor. Similar to Snai1 knockout fibroblasts, EDA- fibronectin fibroblasts produce an extracellular matrix that does not sustain TGFβ-induced fiber organization, rigidity, fibroblast activation, or tumor cell invasion. The presence of EDA+ fibronectin changes the action of metalloproteinases on fibronectin fibers. Critically, in an mouse orthotopic breast cancer model, the absence of the fibronectin EDA domain completely prevents lung metastasis.

Conclusions: Our results support the requirement of EDA+ fibronectin in the generation of a metastasis permissive stromal architecture in breast cancers and its molecular control by SNAIL1. From a pharmacological point of view, specifically blocking EDA+ fibronectin deposition could be included in studies to reduce the formation of a pro-metastatic environment.

Keywords: Breast cancer; EDA+ Fibronectin; Extracellular matrix; Matrix architecture; Matrix rigidity; Metastasis; Myofibroblasts; SNAIL1; TGFβ.


Conflict of interest statement

The authors have no conflicts of interest to disclosure.

Figures

Fig. 1
Fig. 1
SNAIL1 expression controls fibronectin EDA inclusion. A Relative RNA amount of EDA+ fibronectin isoforms in control and Snai1 KO CAFs. RNA obtained from indicated CAFs was retrotranscribed and amplified by PCR using Fn1 (depicted on the left) or Snai1 primers. Resulting DNA was visualized by electrophoresis on a 2% agarose gel. A representative experiment from the three performed is shown. B Relative RNA amount of EDA+ fibronectin isoforms in control and Snai1 KO MEFs treated with TGFβ1. RNA from the indicated MEFs was untreated or treated for 24 h with 5 ng/mL of TGFβ1 and then analyzed as in A. C Expression of the EDA+ fibronectin protein in MEFs. Control and Snai1 KO MEFs were treated or not with 5 ng/mL of TGFβ1 for 24 h and lysed in SDS buffer. Levels of the indicated proteins were analyzed by Western blotting. D Expression of EDA+ fibronectin in BJ fibroblasts. Human BJ fibroblasts were transfected with siRNA anti-SNAIL1 or a control siRNA and then treated or not with TGFβ1 for 24 h. Cells were lysed in SDS buffer, and protein levels were analyzed by Western blotting. E Quantification of the EDA+ fibronectin ratio by RNA-seq. Deep sequencing of RNA from control or Snai1 KO MEFs treated with 5 ng/mL TGFβ1 for 3 h was performed. The percent spliced-in (PSI) for FN1-EDA in each condition was calculated from the number of inclusion and exclusion sequencing reads
Fig. 2
Fig. 2
Elevated percentages of EDA+ fibronectin correlate with high SNAIL1 levels in advanced human tumors. A Breast adenocarcinoma; C kidney renal clear cell carcinoma; D skin cutaneous melanoma; and E lung adenocarcinoma. The percentage of EDA+ fibronectin RNA and the SNAIL1 protein level in each specimen were obtained from the TSVdb and cBioPortal databases, respectively. Tumors were classified according to the levels (low or high) of SNAIL1 and EDA+ fibronectin (see Materials and Methods), and the percentages of high or low EDA+ fibronectin tumors were plotted for each SNAIL1-expressing category. Tumors at the initial (I and II) or advanced (III and IV) stages were analyzed separately (see Materials and Methods). Numbers within the bars indicate the percentage of tumors with high levels of EDA+ fibronectin. When available, data for normal tissue (NT) are also shown. n, number of tumors per group. B Relative protein levels of EDA+ fibronectin and SNAIL1 in PDXs. EDA+ fibronectin and SNAIL1 levels in 29 PDX protein extracts from HER2+ or triple-negative breast neoplasms were densitometrically estimated from Western blots (see Materials and Methods). PDXs were classified according to their levels (low or high) of SNAIL1 and EDA+ fibronectin (see Materials and Methods) and analyzed as in A. n, number of PDXs
Fig. 3
Fig. 3
SRSF1 interactions with the fibronectin EDA exon is regulated by SNAIL1. A SRSF1 protein amount in Snai1 KO MEFs. Control and Snai1 KO MEFs were lysed in SDS buffer after the indicated times of TGFβ1 treatment (5 ng/mL), and protein levels were analyzed by Western blotting. B SNAIL1 and SRSF1 colocalize in the nucleus of MEFs. Control and Snai1 KO MEFs were grown on glass coverslips, treated with TGFβ1 for 24 h and fixed with 4% PFA. The cellular distributions of SNAIL1 and SRSF1 were analyzed by immunofluorescence with specific antibodies. Images were obtained by confocal microscopy. Phalloidin (pink) and DAPI (blue) staining corresponding to depicted cells are shown into a box. Merge images in control MEFs were produced with ImageJ, and colocalization is shown in yellow. C The SNAIL1 and SRSF1 interaction is RNA dependent. Extracts of MEFs treated with TGFβ1 for 3 h were obtained in RIPA buffer, and half of the sample was treated with 400 µg/mL RNase A. RT-qPCR for total fibronectin confirmed the complete elimination of RNA in the samples. Immunoprecipitation was performed using an antibody specific for SRSF1 and agarose beads. Immunoprecipitated proteins were analyzed by Western blotting. D SNAIL1 does not bind to the fibronectin exon 33 RNA. RNA immunoprecipitation (RIP) was performed using an antibody specific for SNAIL1 or an unspecific IgG in samples of MEFs transfected to overexpress Snai1-HA (Additional file 1: Fig. S3) and treated with 5 ng/mL TGFβ1 for 3 h. RNA enrichment in the immunoprecipitates was analyzed by RT-qPCR using primers for exon 33. Bars show binding enrichment as compared to immunoprecipitation using IgG. E SRSF1 binds to the fibronectin exon 33 RNA in a SNAIL1-dependent manner. RIP was performed using an antibody specific for SRSF1 in samples of MEFs transfected to overexpress Snai1-HA (Additional file 1: Fig. S3), or of MEFs KO for Snai1 treated with 5 ng/mL TGFβ1 for 3 h. RNA enrichment in the immunoprecipitates was analyzed by RT-qPCR using primers for exon 33 or HPRT (as a control). Bars show binding enrichment compared to immunoprecipitation using unspecific control IgG. At least three replicates were performed for each immunoprecipitation. F and G SRSF1 and SNAIL1 bind to the EDA coding region in a TGFβ-dependent manner. ChIP was performed with an antibody specific for SRSF1 (F) or SNAIL1 (G) in samples of MEFs transfected to overexpress SNAIL-HA that were treated or not with TGFβ1 for 3 h. Precipitated DNA was analyzed by qPCR using primers targeting Fn1 promoter (+ 116/ + 265), Fn1 exon 7 and Fn1 exon 33 (EDA). Bars show binding enrichment as compared to immunoprecipitation using unspecific IgG. At least three replicates were performed for each immunoprecipitation
Fig. 4
Fig. 4
Fibronectin EDA determines topological and mechanical properties of myofibroblastic matrices. A CAF-derived 3D ECMs. Indicated CAFs were seeded on coverslips and allowed to produce ECM for 6 days. Cell cultures were then fixed and analyzed by immunofluorescence (IF) with an anti-fibronectin (red), anti-fibronectin EDA (green) and DAPI (white). B Quantification of the oriented CAF nuclei within 3D ECMs. Orientation angles of the DAPI-stained nuclei were calculated using the ImageJ analysis particles tool. Percentage of nuclei orientated toward the most frequent angle (up to 21° deviation) is shown. C Relative RNA amount of EDA+ fibronectin isoforms in genetically modified MEF lines. RNA from control, EDA– and EDA+ MEFs treated with 5 ng/mL of TGFβ1 for 3 h was retrotranscribed and amplified using primers flanking exon 33 of Fn1 (as described in Fig. 1) and visualized by DNA-electrophoresis. D Relative protein amount of EDA+ fibronectin isoforms in genetically modified MEF lines. Indicated MEFs treated as in C were lysed in SDS buffer, and the levels of the indicated proteins were analyzed by Western blot. E Fibronectin fibers in 3D ECMs. Indicated MEFs seeded on coverslips were allowed to produce extracellular matrix for 6 days in the presence or absence of 5 ng/mL TGFβ1. Cell cultures were then fixed and analyzed by IF with an anti-fibronectin (green) and DAPI. Confocal and STED microscopy were used to obtain images. F Quantification of fibronectin fiber alignment in 3D ECMs. The fiber angles were calculated using the ImageJ plugin OrientationJ. The percentage of fibers aligned toward the same direction (up to 21° deviation from the mode) is shown. G Quantification of fibronectin fiber alignment index through TWOMBLI. Fibronectin fiber images obtained as in E were analyzed using the ImageJ macro TWOMBLI. All obtained data are plotted, showing all individual measurements, mean and SEM. H Quantification of fibronectin fiber parameters through TWOMBLI. The indicated parameters were analyzed from images used in E. Arbitrary units provided by the plugin are expressed relative to wild-type MEFs. I Visualization of collagen deposition from in vivo–like extracellular matrices. 3D ECMs were produced as in C fixed with 4% PFA and stained with Masson's trichrome. J, Quantification of the stiffness of in vivo–like extracellular matrices. 3D ECMs generated as in E were decellularized, and the elastic modulus was calculated from atomic force-curve measurements
Fig. 5
Fig. 5
Matrices deposited from both EDA– fibronectin and Snai1 KO MEFs are sensitive to metalloproteinases. A Fibronectin fiber organization in EpRas cells co-cultured with fibroblasts. EpRAs cells and the indicated MEFs were co-cultured on glass coverslips in the presence or absence of 25 µM GM6001 for 3 days. Co-cultures were analyzed by IF with anti-fibronectin (green) and DAPI (blue). Microscopy images are shown. B Fibronectin fiber lacunarity in EpRas co-cultured with fibroblasts is EDA and metalloproteinase dependent. Lacunary in fibronectin images obtained as in A was quantified using the TWOMBLI plugin of ImageJ software. The fold-increase with respect to values in untreated control MEF co-cultures is shown. C Fibronectin fiber organization in HT-29 M6 co-cultured with fibroblasts. Tumor cells and the indicated MEFs were co-cultured on glass coverslips for 6 days. Co-cultures were analyzed by IF with anti-fibronectin (green) and phalloidin (white). Microscopy images are shown. D HT-29 M6 colonies co-cultured with fibroblasts control the presence fibronectin around them in an EDA-dependent manner. For each HT 29 M6 colony, the perimeter and associated empty area (black surface) were quantified (ImageJ software) from images obtained as in A. The fold-increase of the “black area/perimeter” in each co-culture with respect to values in control MEF co-cultures is shown. E The metalloproteinase inhibitor GM6001 rescues the EDA-lacking fibronectin deposition around HT-29 M6 colonies. Cocultures of HT-29 M6 and indicated MEFs were carried out and imaged as in C in the presence or absence of the 25 μM GM6001. Black area measurements and plotting were carried out as in B. Fold increase with respect to values in untreated EDA– MEF co-cultures is shown. F The metalloproteinase inhibitor GM6001 rescues the lack of fibronectin accumulation around HT-29 M6 colonies co-cultured with Snai1 KO MEFs. Co-cultures with indicated cells were established, treated and analyzed as in C and D. The fold-increase with respect to values in untreated control MEF co-cultures is shown
Fig. 6
Fig. 6
Tumor cell invasion is favored by the presence of EDA+ fibronectin in the 3D ECM. A MDA-MB-231 cell oriented migration depends on the presence of EDA+ fibronectin in the 3D ECM. Cell-tracker labeled MDA-MB-231 tumor cells were seeded on top of decellularized 3D ECMs generated by the indicated MEFs in the absence or presence of 5 ng/ml TGFβ1. Cell migration was recorded overnight by taking IF images every 15 min using life microscopy (Additional file 1: Fig. S8A). MDA cell movement was tracked using ImageJ software, and displacement features, such as the angle of each displacement, were measured. Oriented migration was plotted as the percentage of cell movements in the maximum orientation (up to 21˚ deviation from the mode). B MDA-MB-231 cell invasion is increased on 3D ECMs with EDA+ fibronectin. The indicated MEF lines were allowed to produce 3D ECMs in the presence of 5 ng/ml TGFβ1 on invasion-insert membranes. ECMs were decellularized, and MDA cells (in DMEM with 0.1% FBS) were seeded on top. DMEM with 10% FBS was added to the lower chamber as a chemoattractant. Cells were allowed to invade for 16 h and fixed with 4% PFA. Invading cells were stained with DAPI and quantified. C MDA-MB-231 cell invasion through EDA+ fibronectin matrices is interfered by irigenin treatment during matrix formation. MDA invasion through decellularized 3D ECMs produced by the indicated MEF lines activated with 5 ng/ml TGFβ1 and either treated or not with 50 μM irigenin, was quantified as in B. D EpRas invasion is increased on 3D ECMs containing EDA+ fibronectin. Invasion insert membranes were covered with indicated 3D ECMs as described in B and EpRas were induced to invade decellularized ECMs for 48 h and quantified as in B
Fig. 7
Fig. 7
Matrices with EDA+ fibronectin induce the assemblage of α-SMA fibers in naïve fibroblasts. A MSC or NIH3T3 fibroblasts are induced to assemble α-SMA fibers by EDA+ matrices. MSC or NIH3T3 were grown 24 h on decellularized 3D ECMs generated by EDA– or EDA+ MEFs before detecting α-SMA and nuclei by IF. Images obtained through fluorescence microscopy were used to quantify the percentage of cells presenting α-SMA positive stress fibers. B NIH3T3 fibroblasts are induced to assemble α-SMA fibers by control and EDA matrices. NIH3T3 fibroblasts were grown 24 h on decellularized 3D ECMs generated by the indicated MEFs in the presence or absence of 5 ng/mL TGFβ1. The percentage of fibroblasts presenting α-SMA positive stress fibers was quantified as in A. C Irigenin interferes with fibroblast activation by EDA+ matrices. NIH3T3 fibroblasts were grown for 24 h on decellularized 3D ECMs generated by the indicated MEFs in the presence or absence of 5 ng/mL TGFβ1, and the presence or absence of 50 μM irigenin. The percentage of fibroblasts presenting α-SMA positive stress fibers was quantified as in A
Fig. 8
Fig. 8
Fibroblasts lacking EDA fibronectin prevent metastasis formation. A AT3 coinjected with EDA+ MEFs generate bigger tumors than those with EDA– MEFs. Orthotopic tumors were generated in NOD-SCID gamma mice (Additional file 1: Fig. S10A). After resection, the three main dimensions of primary tumors were measured to calculate their volumes. The volume of each tumor relative to the average volume of EDA– MEF co-injected tumors is plotted. B Lung metastasis are absent in EDA– co-injected tumors. Lungs from injected mice in A were extracted 7 weeks after resection of primary tumors, fixed in 4% PFA and embedded in paraffin. H&E staining of lung slices to visualize metastasis are shown in the Additional file 1: Fig. S10B. The plot shows a quantification of the presence of metastatic foci obtained from lung H&E staining. Lungs with at least one metastasis are indicated as positive

Similar articles

Cited by

References

    1. da Silva-Diz V, Lorenzo-Sanz L, Bernat-Peguera A, Lopez-Cerda M, Muñoz P. Cancer cell plasticity: impact on tumor progression and therapy response. Semin Cancer Biol. 2018;53:48–58. doi: 10.1016/j.semcancer.2018.08.009. - DOI - PubMed
    1. O’Brien-Ball C, Biddle A. Reprogramming to developmental plasticity in cancer stem cells. Dev Biol. 2017;430(2):266–274. doi: 10.1016/j.ydbio.2017.07.025. - DOI - PubMed
    1. Delinassios JG, Hoffman RM. The cancer-inhibitory effects of proliferating tumor-residing fibroblasts. Biochim Biophys Acta Rev Cancer. 2022;1877(1):188673. doi: 10.1016/j.bbcan.2021.188673. - DOI - PubMed
    1. Conklin MW, Eickhoff JC, Riching KM, Pehlke CA, Eliceiri KW, Provenzano PP, et al. Aligned collagen is a prognostic signature for survival in human breast carcinoma. Am J Pathol. 2011;178(3):1221–1232. doi: 10.1016/j.ajpath.2010.11.076. - DOI - PMC - PubMed
    1. Takai K, Le A, Weaver VM, Werb Z. Targeting the cancer-associated fibroblasts as a treatment in triple-negative breast cancer. Oncotarget. 2016;7(50):82889–82901. doi: 10.18632/oncotarget.12658. - DOI - PMC - PubMed

Publication types