. 2023 Oct 11;26(11):108093.
doi: 10.1016/j.isci.2023.108093. eCollection 2023 Nov 17.

Noninvasive diagnosis of secondary infections in COVID-19 by sequencing of plasma microbial cell-free DNA

Affiliations

Noninvasive diagnosis of secondary infections in COVID-19 by sequencing of plasma microbial cell-free DNA

Grace Lisius et al. iScience. .

Abstract

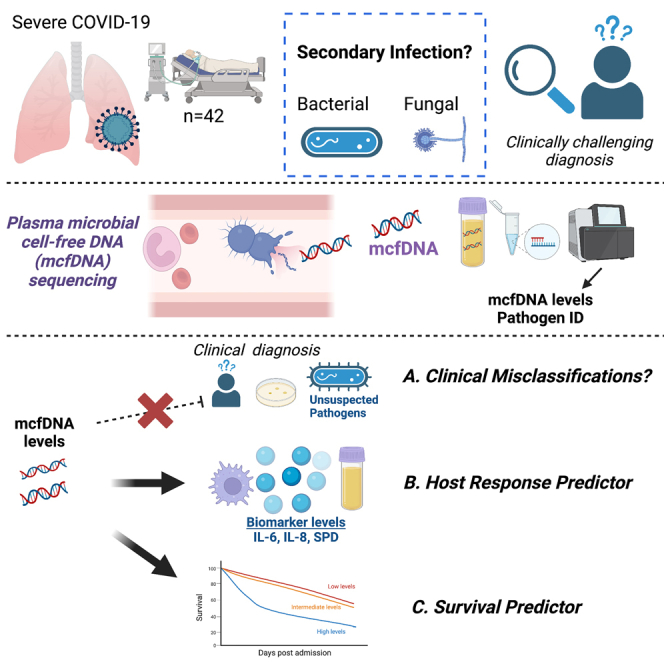
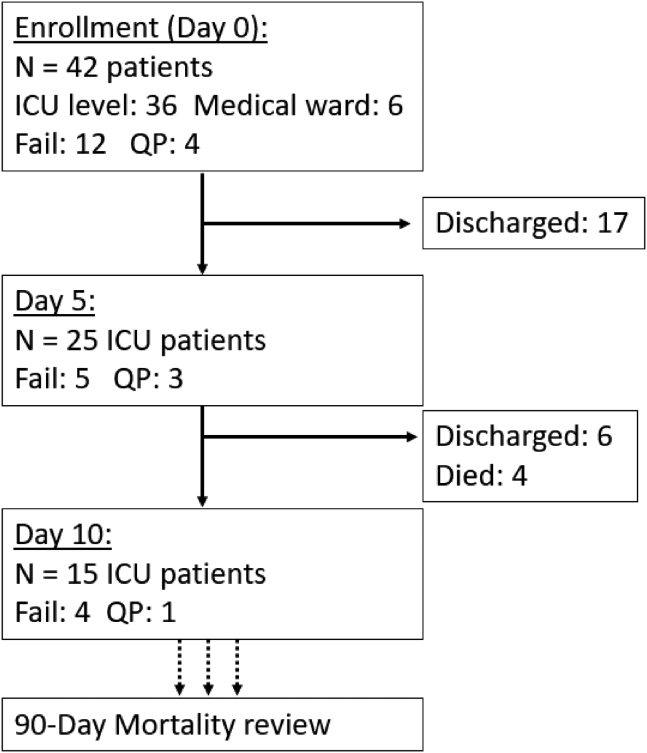
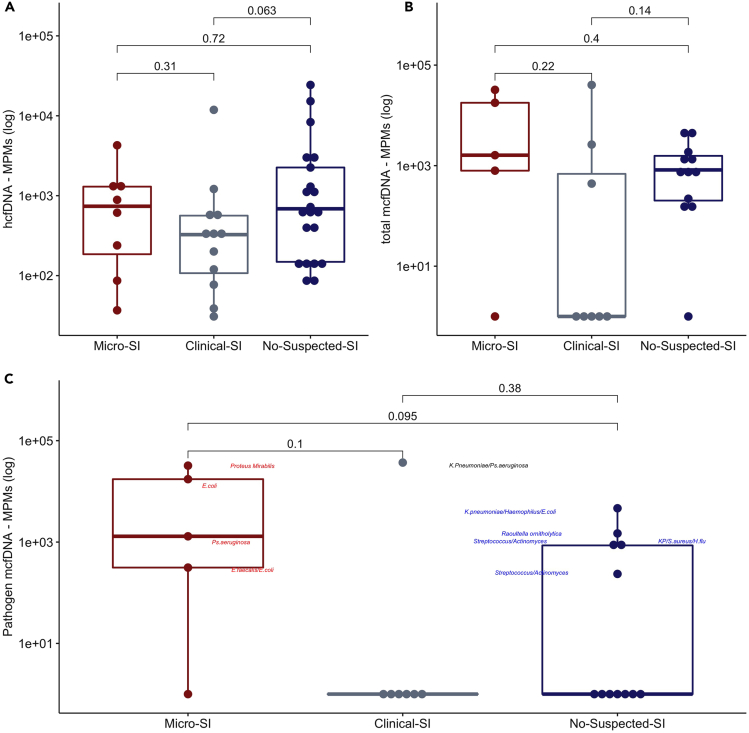
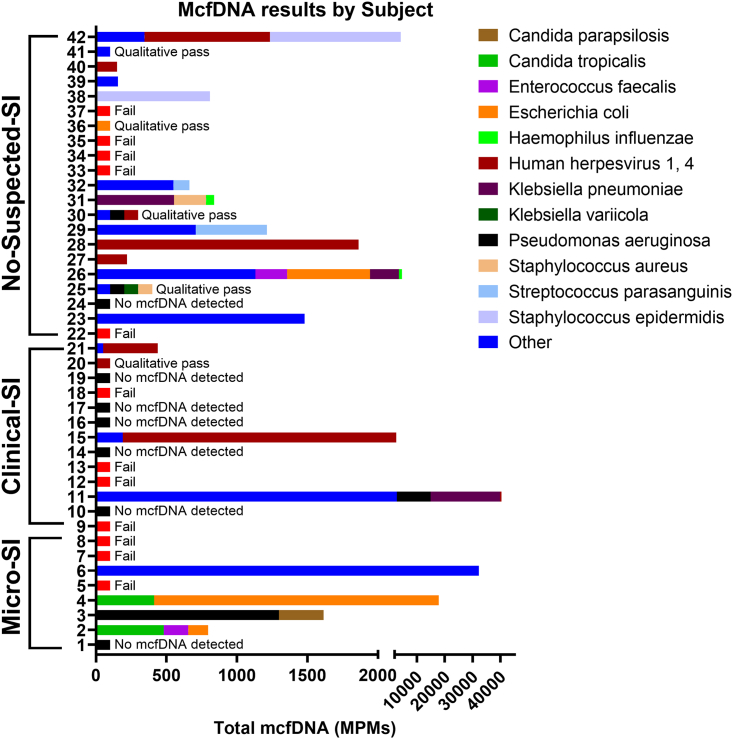
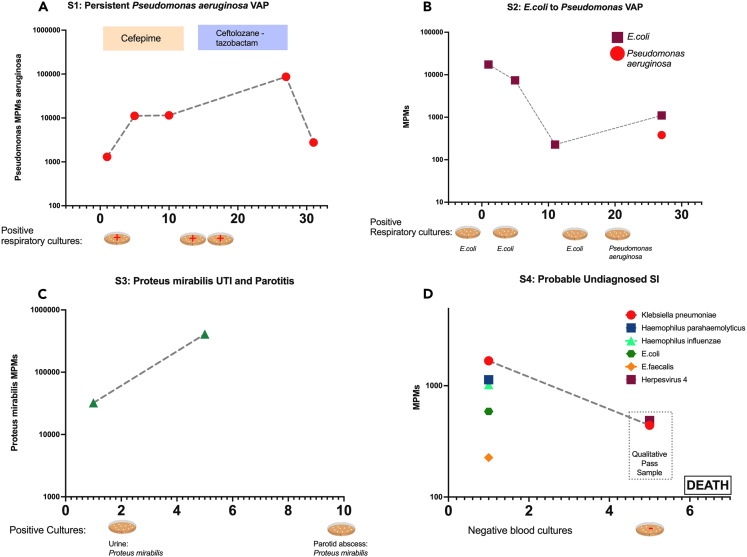
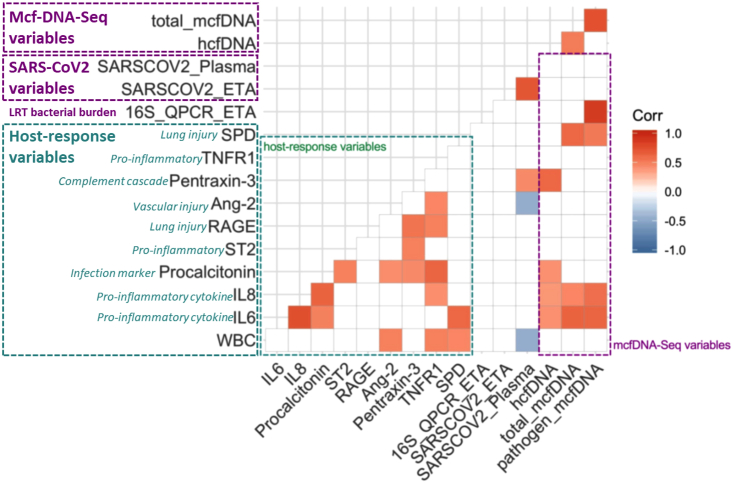
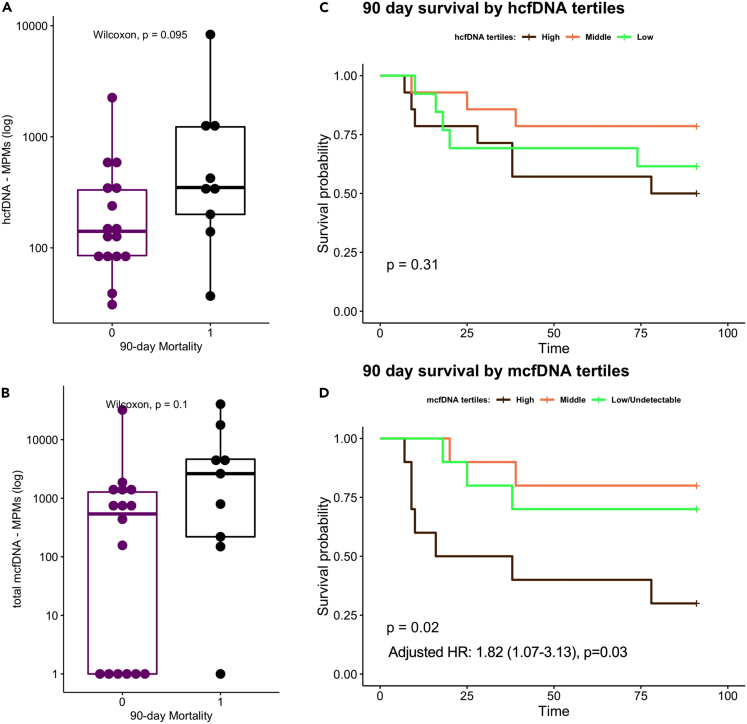
Secondary infection (SI) diagnosis in severe COVID-19 remains challenging. We correlated metagenomic sequencing of plasma microbial cell-free DNA (mcfDNA-Seq) with clinical SI assessment, immune response, and outcomes. We classified 42 COVID-19 inpatients as microbiologically confirmed-SI (Micro-SI, n = 8), clinically diagnosed-SI (Clinical-SI, n = 13, i.e., empiric antimicrobials), or no-clinical-suspicion-for-SI (No-Suspected-SI, n = 21). McfDNA-Seq was successful in 73% of samples. McfDNA detection was higher in Micro-SI (94%) compared to Clinical-SI (57%, p = 0.03), and unexpectedly high in No-Suspected-SI (83%), similar to Micro-SI. We detected culture-concordant mcfDNA species in 81% of Micro-SI samples. McfDNA correlated with LRT 16S rRNA bacterial burden (r = 0.74, p = 0.02), and biomarkers (white blood cell count, IL-6, IL-8, SPD, all p < 0.05). McfDNA levels were predictive of worse 90-day survival (hazard ratio 1.30 [1.02-1.64] for each log10 mcfDNA, p = 0.03). High mcfDNA levels in COVID-19 patients without clinical SI suspicion may suggest SI under-diagnosis. McfDNA-Seq offers a non-invasive diagnostic tool for pathogen identification, with prognostic value on clinical outcomes.

Keywords: Classification description immunology; Sequence analysis; Virology.


Conflict of interest statement

Drs. Duttagupta and Ahmed were employed by Karius, Inc at the time of the study but are no longer employed by Karius, Inc. Drs. Kitsios and Haidar have received research funding from Karius, Inc. Drs. Kitsios and Morris have received research funding from Pfizer, Inc. Dr. Haidar serves on the Karius, Inc scientific advisory board. Dr. Mellors is a consultant to AlloVir, Infectious Disease Connect, Inc., and Gilead Sciences, Inc., has received research funding from Gilead Sciences, Inc. to the University of Pittsburgh, receives compensation from Abound Bio, Inc. (unrelated to the current work) and holds shares options in Galapogos, Infectious Disease Connect, Inc., and MingMed Biotechnology Co. Ltd. (unrelated to the current work). Dr. McVerry has received research funding from Bayer Pharmaceuticals, Inc. and consulting fees from Boehringer Ingelheim, both unrelated to this work.

Figures

None
Graphical abstract
Figure 1
Figure 1
Flowchart of enrolled patients sampled at each follow-up period through the 90-day mortality endpoint Fail: failed mcfDNA sequencing; QP: qualitative pass.
Figure 2
Figure 2
Clinical classification of secondary infection diagnosis among patients with COVID-19 and plasma cell-free DNA levels Clinical classification of secondary infection diagnosis among patients with COVID-19 did not show significant differences in baseline human (A) or microbial cell-free DNA levels (B and C) (N = 42). Subjects classified as microbiologically confirmed secondary infection (Micro-SI) had numerically higher but statistically non-significant different baseline levels of total and pathogen microbial cell-free DNA (mcfDNA) compared to subjects classified as clinically diagnosed secondary infections (Clinical-SI) or those with no clinical suspicion for SI (No-Suspected-SI). Pairwise comparisons were conducted with Wilcoxon test. In C, the combined pathogen mcfDNA for each sample is shown, with the most abundant microbial species in each of the positive samples denoted beside the sample data points. See also Figures S4–S6, and Table S2. Data in boxplots are represented as individual values with median values and interquartile range depicted by the boxplots.
Figure 3
Figure 3
Significantly higher proportion of positive samples with mcfDNA species calls in No-Suspected-SI compared to Clinical-SI samples. We display samples grouped by SI classification and sample identifier, showing the species and respective MPMs called by mcfDNA-Seq. Standardized bars indicate failed samples, samples with no species called, and those with qualitative pass, yielding species each denoted with standardized bar. Infrequently called species were combined for visual simplicity.
Figure 4
Figure 4
Comparison of plasma mcfDNA sequencing with microbiologic/clinical diagnoses across the timeline of four subjects with serial sampling Species-specific microbial MPMs (y axis) are shown across sequential sampling days from enrollment, (x axis). Petri dish graphics along the x axis denote the timing and results of clinically obtained microbiological testing. Subject 3 (A) was an immunocompetent patient with a persistent culture-confirmed Pseudomonas VAP that persisted through the antimicrobials, with timing and therapy noted above. Subject 3 had persistently elevated Pseudomonas mcfDNA levels throughout the extended infection course, which ultimately correlated with clinical improvement (A). Subject 4 (B) had sequential VAPs with changing pathogens detected on invasive respiratory cultures, E. coli followed by Pseudomonas, which was concordantly reported on noninvasive mcfDNA sampling. Subject 6 (C) was a patient with diabetes who was initially found to have a resistant Proteus urinary infection, and a subsequent persistent septic clinical picture, later found to have a polymicrobial, including Proteus, parotid gland abscess. Proteus mcfDNA levels remained elevated in subject 6 during initial antimicrobial therapy for urinary infection, suggesting the persistent source of infection. Subject 26 (D) was clinically determined No-Suspicion-for-SI, but had a deteriorating clinical course, without cultures obtained for 5 days or empiric antimicrobials, and ultimately died of shock and multisystem organ failure. Noninvasive testing revealed persistent levels of Klebsiella pneumonia mcfDNA levels, which suggests an undiagnosed SI may have contributed to the clinical course. See also Figure S7.
Figure 5
Figure 5
Baseline plasma microbial cell-free DNA levels were significantly correlated with lower respiratory tract bacterial load and plasma host response biomarkers (N = 42). Correlogram demonstrating comparisons of host nine response biomarkers (green dashed box), number of 16S rRNA gene copies by qPCR in Endotracheal Aspirates (ETA, surrogate for lower respiratory tract bacterial load), number of SARS-COV-2 RNA copies in ETA and plasma samples by qPCR, and mcfDNA-Seq output (hcfDNA, total mcfDNA and pathogen mcfDNA – purple dashed box). Significant correlations with the Pearson’s method and following adjustment for multiple comparisons by the Benjamini-Hochberg method are shown, with direction and strength of correlation depicted by the color scale on the right panel. See also Table S4.
Figure 6
Figure 6
Highest microbial cell-free DNA levels at baseline were significantly associated with worse 90-day survival (N = 42). 90-day non-survivors had numerically higher (but statistically non-significant) plasma hcfDNA (A) and mcfDNA (C) levels. Data in boxplots are represented as individual values with median values and interquartile range depicted by the boxplots. HcfDNA levels were not significantly associated with 90-day survival by Kaplan-Meier analysis (B). Patients with the highest tertile of mcfDNA (>1499 Molecules per Microliter) had significantly worse survival compared to patients in the other two mcfDNA tertiles (D). In a Cox proportional hazards model adjusted for age, mcfDNA levels were significantly associated with increased hazards of death (D, adjusted hazard ratio for log10-transformed mcfDNA 1.82, 95% confidence interval 1.07-3.13, p = 0.03). See also Figure S8.

References

    1. Zhou F., Yu T., Du R., Fan G., Liu Y., Liu Z., Xiang J., Wang Y., Song B., Gu X., et al. Clinical course and risk factors for mortality of adult inpatients with COVID-19 in Wuhan, China: a retrospective cohort study. Lancet. 2020;395:1054–1062. doi: 10.1016/s0140-6736(20)30566-3. - DOI - PMC - PubMed
    1. Rouzé A., Martin-Loeches I., Povoa P., Makris D., Artigas A., Bouchereau M., Lambiotte F., Metzelard M., Cuchet P., Boulle Geronimi C., et al. Relationship between SARS-CoV-2 infection and the incidence of ventilator-associated lower respiratory tract infections: a European multicenter cohort study. Intensive Care Med. 2021;47:188–198. doi: 10.1007/s00134-020-06323-9. - DOI - PMC - PubMed
    1. Maes M., Higginson E., Pereira-Dias J., Curran M.D., Parmar S., Khokhar F., Cuchet-Lourenço D., Lux J., Sharma-Hajela S., Ravenhill B., et al. Ventilator-associated pneumonia in critically ill patients with COVID-19. Crit. Care. 2021;25:25. doi: 10.1186/s13054-021-03460-5. - DOI - PMC - PubMed
    1. Pickens C.O., Gao C.A., Cuttica M.J., Smith S.B., Pesce L.L., Grant R.A., Kang M., Morales-Nebreda L., Bavishi A.A., Arnold J.M., et al. Bacterial Superinfection Pneumonia in Patients Mechanically Ventilated for COVID-19 Pneumonia. Am. J. Respir. Crit. Care Med. 2021;204:921–932. doi: 10.1164/rccm.202106-1354OC. - DOI - PMC - PubMed
    1. Kitsios G.D., Morris A. Seek and Ye Shall Find: COVID-19 and Bacterial Superinfection. Am. J. Respir. Crit. Care Med. 2021;204:875–877. doi: 10.1164/rccm.202107-1790ED. - DOI - PMC - PubMed

LinkOut - more resources