. 2023 Oct 29;26(11):108362.
doi: 10.1016/j.isci.2023.108362. eCollection 2023 Nov 17.

TMEM106B reduction does not rescue GRN deficiency in iPSC-derived human microglia and mouse models

Affiliations

TMEM106B reduction does not rescue GRN deficiency in iPSC-derived human microglia and mouse models

Sara L Dominguez et al. iScience. .

Abstract

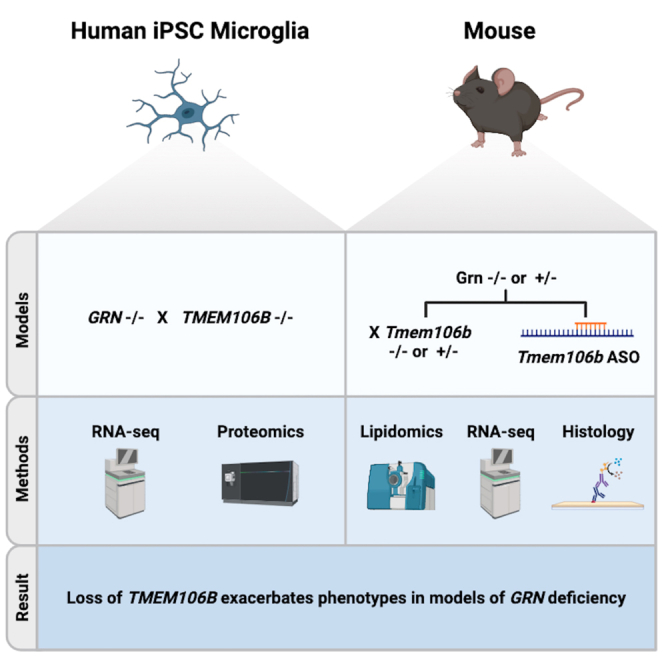
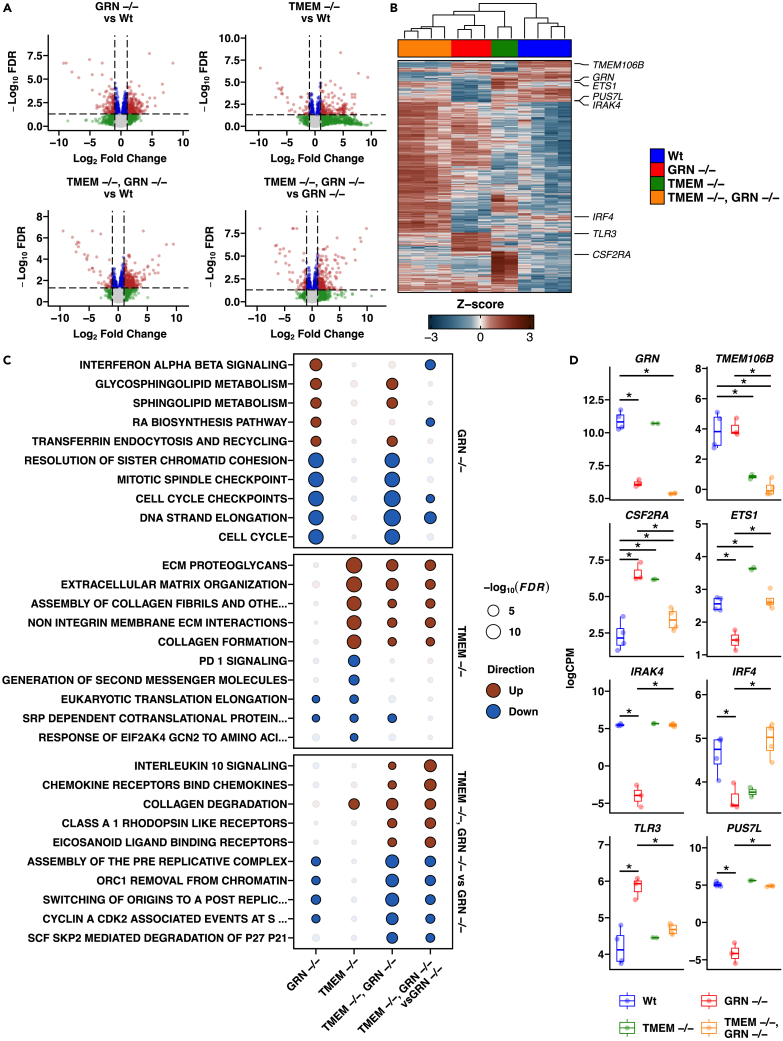
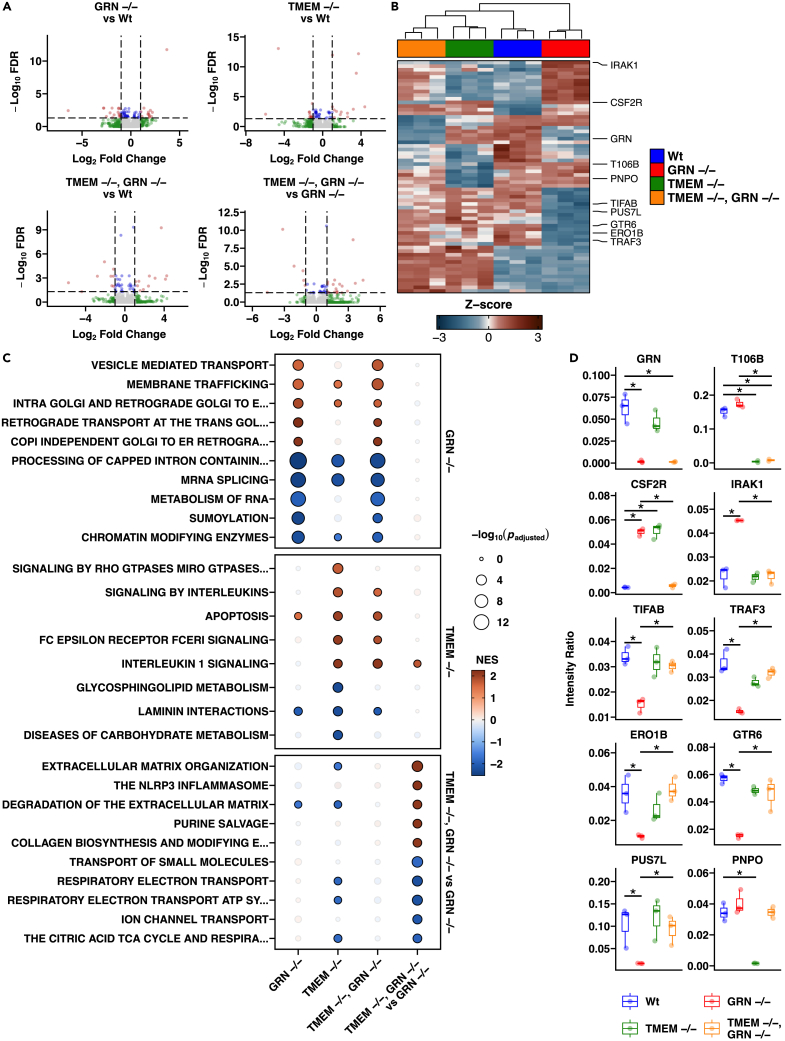
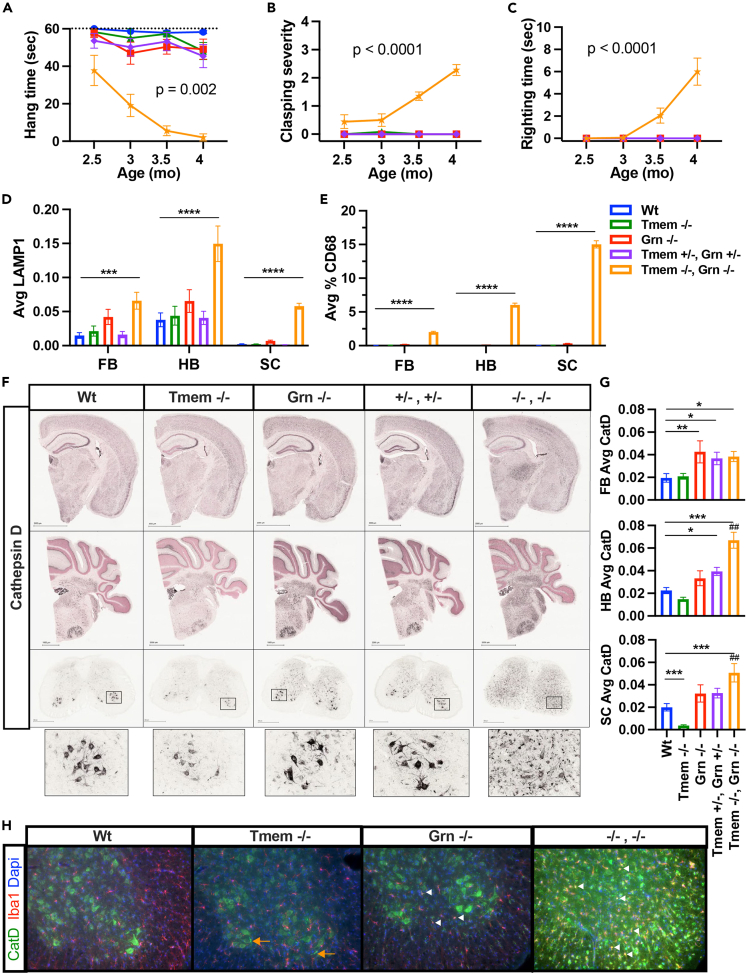
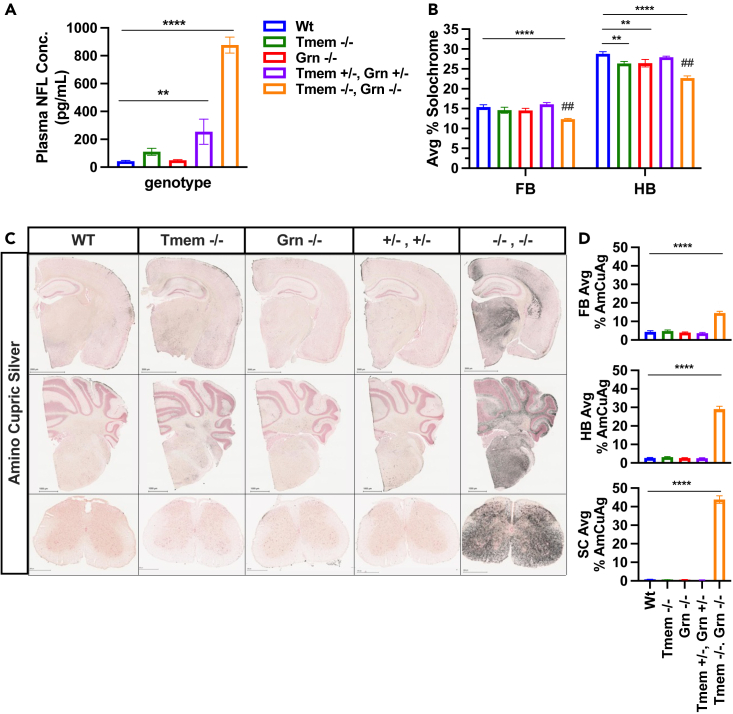
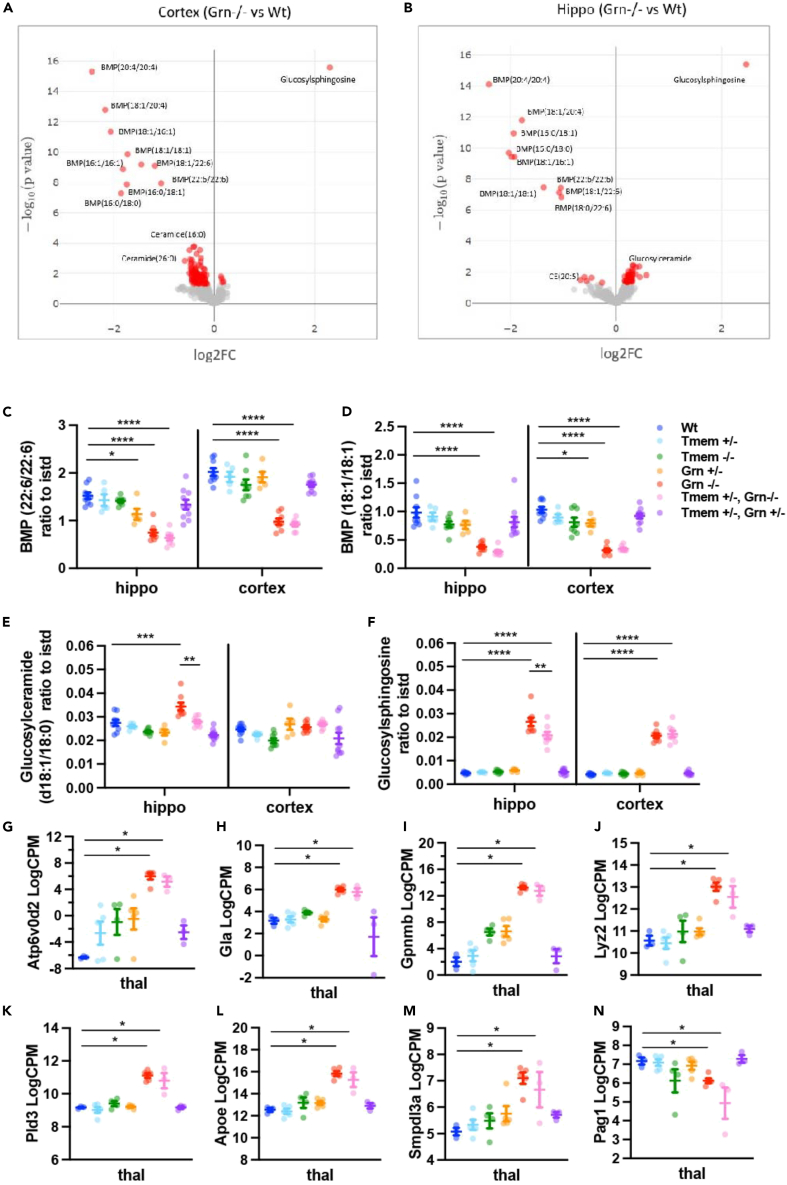
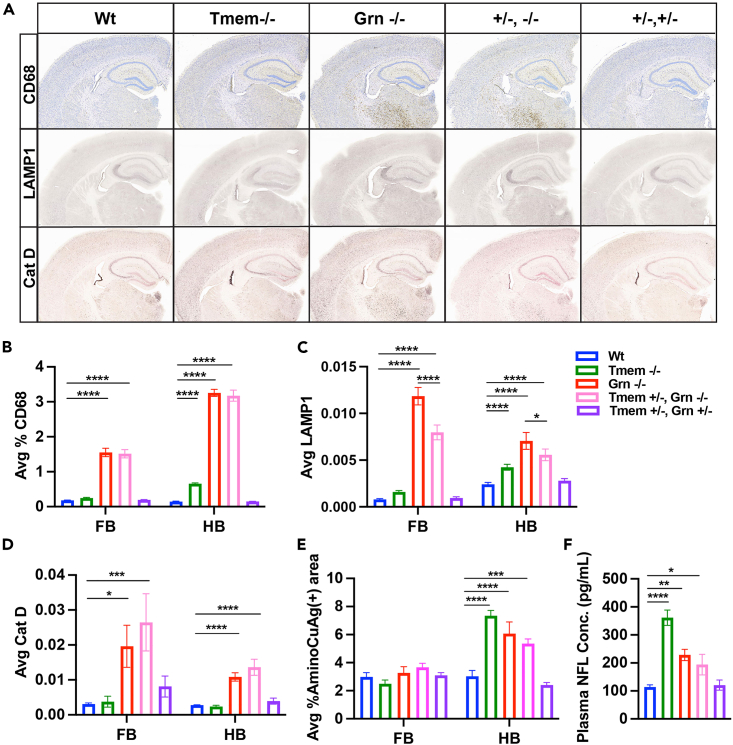
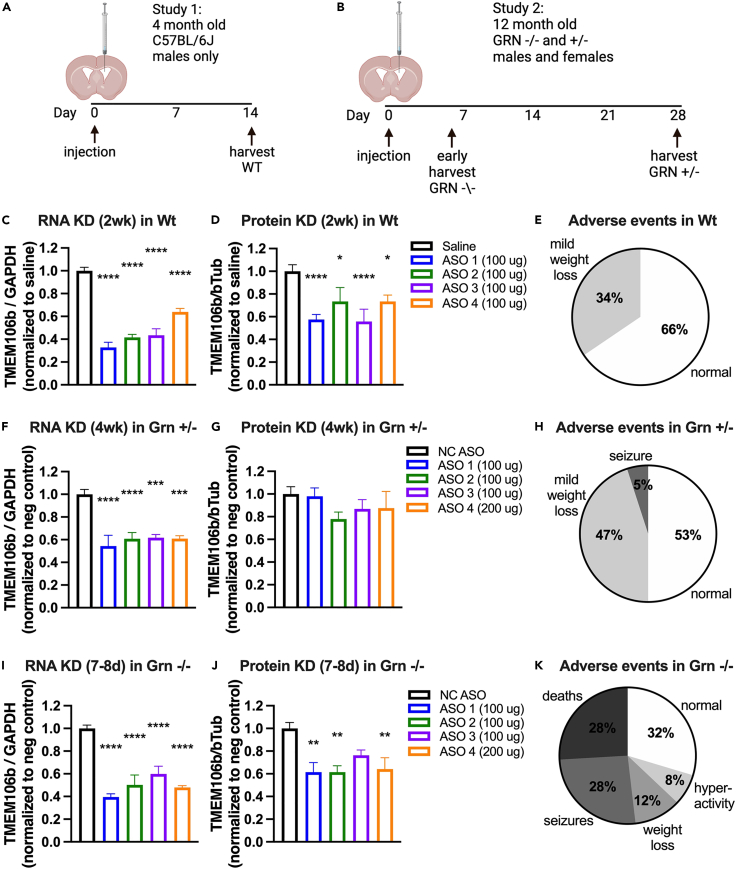
Heterozygous mutations in the granulin (GRN) gene are a leading cause of frontotemporal lobar degeneration with TDP-43 aggregates (FTLD-TDP). Polymorphisms in TMEM106B have been associated with disease risk in GRN mutation carriers and protective TMEM106B variants associated with reduced levels of TMEM106B, suggesting that lowering TMEM106B might be therapeutic in the context of FTLD. Here, we tested the impact of full deletion and partial reduction of TMEM106B in mouse and iPSC-derived human cell models of GRN deficiency. TMEM106B deletion did not reverse transcriptomic or proteomic profiles in GRN-deficient microglia, with a few exceptions in immune signaling markers. Neither homozygous nor heterozygous Tmem106b deletion normalized disease-associated phenotypes in Grn -/-mice. Furthermore, Tmem106b reduction by antisense oligonucleotide (ASO) was poorly tolerated in Grn -/-mice. These data provide novel insight into TMEM106B and GRN function in microglia cells but do not support lowering TMEM106B levels as a viable therapeutic strategy for treating FTD-GRN.

Keywords: Cellular neuroscience; Molecular medicine; Neuroscience.


Conflict of interest statement

The authors have a published patent application WO 2019/154979 A1 related to this work.

Figures

None
Graphical abstract
Figure 1
Figure 1
TMEM106B and GRN KO iMG transcriptomic signatures (A) Volcano plots of differential gene expression profiles from pairwise contrasts of GRN KO vs. WT, TMEM KO vs. WT, double KO vs. WT, and double KO vs. GRN KO. Red indicates transcripts passing the FDR <0.05 & |Log2 FC| > 1 threshold, blue indicates transcripts passing the FDR <0.05 threshold, green represents transcripts passing the |Log2 FC| > 1 threshold, and gray represents the remaining transcripts. (B) Heatmap of significant (FDR <0.05 & |Log2 FC| > 1) differentially expressed genes presented in the volcano plots. (C) Enrichment testing results for the top distinct significant (FDR <0.05) pathways for GRN KO vs. WT, TMEM KO vs. WT, and double KO vs. GRN KO. Values for double KO vs. WT are also shown. (D) Expression of select significant (FDR <0.05 & |Log2 FC| > 1) differentially expressed genes from pairwise contrasts of GRN KO vs. WT, TMEM KO vs. WT, double KO vs. WT, and double KO vs. GRN KO within each genotype. Error bars represent S.E.M. for 3 biological replicates.
Figure 2
Figure 2
TMEM106B and GRN KO iMG proteomic signatures (A) Volcano plots of differential gene expression profiles from pairwise contrasts of GRN KO vs. WT, TMEM KO vs. WT, double KO vs. WT, and double KO vs. GRN KO. Red indicates proteins passing the FDR <0.05 & |Log2 FC| > 1 threshold, blue indicates proteins passing the FDR <0.05 threshold, green represents proteins passing the |Log2 FC| > 1 threshold, and gray represents the remaining proteins. (B) Heatmap of significant (FDR <0.05 & |Log2 FC| > 1) differentially expressed proteins presented in the volcano plots. (C) Enrichment testing results for the top distinct significant (padjusted < 0.05) pathways for GRN KO vs. WT, TMEM KO vs. WT, and double KO vs. GRN KO. Values for double KO vs. WT are also shown. (D) Expression of select significant (FDR <0.05 & |Log2 FC| > 1) differentially expressed proteins from pairwise contrasts of GRN KO vs. WT, TMEM KO vs. WT, double KO vs. WT, and double KO vs. GRN KO within each genotype. Error bars represent the S.E.M. for 3 biological replicates.
Figure 3
Figure 3
Homozygous deletion of Tmem106b exacerbates Grn KO behavioral and lysosomal phenotypes (A) Wire hang time was significantly decreased in Tmem −/−, Grn −/− mice and worsened with age. Mixed-effects model (REML) test revealed an overall significant effect of genotype F (4, 79) = 44.12; p < 0.0001, time F (2.611, 141.9) = 11.64; p < 0.0001 and a genotype × time interaction F (12,163) = 3.322; p = 0.0002. Tukey’s multiple comparisons test revealed that at the 3, 3.5, and 4 months time points, the Tmem −/−, Grn −/− group displayed significantly reduced hang times when compared to each of the other 4 genotypes. (B) Tmem −/−, Grn −/− mice displayed a severe clasping phenotype. REML test on clasping severity revealed an overall effect of genotype F (4, 80) = 49.58; p < 0.0001, time F (2.214, 125.5) = 20.34; p < 0.0001 and a genotype × time interaction F (12,170) = 25.11; p < 0.0001). Tukey’s multiple comparisons test revealed that at the 3.5 and 4 months time points, the Tmem −/−, Grn −/− group displayed significantly increased clasping severity when individually compared to each of the other 4 genotypes. (C) When placed on their sides Tmem −/−, Grn −/− mice had delayed righting times. REML test on righting latency revealed an overall significant effect for genotype F (4, 82) = 14.06; p < 0.0001, time F (1.602, 94.01) = 10.29; p = 0.0003 and a genotype, time interaction F (12,176) = 11.54; p < 0.0001. Tukey’s multiple comparisons test revealed that at 4 months the Tmem −/−, Grn −/− mice are the only group that displayed a significantly righting phenotype when individually compared to each of the other 4 genotypes. n = 6–15 animals/genotype for behavioral tests. (D) A significant effect of genotype on LAMP1 staining was detected in whole section analysis (% area) by brain region: forebrain (FB) p = 0.0004, hindbrain (HB) p < 0.0001, and lumbar spinal cord (SC) p < 0.0001 sections by one-way ANOVA. Tmem −/−, Grn −/− mice show significantly increased LAMP1 in HB and SC when compared Grn −/− alone and to all other genotypes. Tmem −/−, Grn −/− differed from all other groups except Grn −/− mice in FB. (E) An overall effect of genotype was detected for CD68 staining in whole section analysis (% area) by brain region: FB p = 0.0004, HB p < 0.0001 and SC p < 0.0001 using one-way ANOVA. Tmem −/−, Grn −/− mice show significantly increased levels of CD68 in FB, HB, and SC when compared to all other genotypes. (F) Representative images of CatD staining in FB, HB, and SC showing increases in Tmem −/−, Grn −/− tissues and decreased CatD in Tmem −/− tissue, specifically in spinal cord (see insert). (G) An overall effect of genotype was detected for CatD staining in whole section analysis (% area) by brain region: FB p = 0.0162, HB p < 0.0001, and SC p < 0.0001 sections by one-way ANOVA. In FB, Grn −/− mice had increased CatD levels compared to Wt mice. Similar to Grn −/− mice, Tmem +/−, Grn +/−, and Tmem −/−, Grn −/− had elevated CatD levels compared to Wt mice. In HB, Grn−/− mice did not show elevated CatD levels. Tmem +/−, Grn +/− differed significantly from Wt mice and Tmem −/−, Grn −/− mice showed significant increases in CatD compared to both Grn −/− and Wt mice. In SC, CatD levels were elevated in Tmem −/−, Grn −/− mice compared to Grn −/− alone and Wt mice, whereas, Tmem −/− mice had significantly decreased levels when compared to the Wt mice. For histology n = 11–16 animals/genotype and 4–5 sections/animal/tissue area/stain. Student’s t test or Tukey’s post-hoc ∗p < 0.05, ∗∗p < 0.01, ∗∗∗p < 0.001, ∗∗∗∗p < 0.0001, ##p < 0.01 vs. Tmem +/−, Grn +/− and Grn −/− mice. All error bars represent S.E.M. (H) Representative images of immunofluorescent staining for CatD (green), microglia (Iba1, red), and DAPI (blue).Orange arrow indicate CatD+ve axonal swellings. White arrowhead indicates CatD+ve microglia.
Figure 4
Figure 4
Homozygous deletion of Tmem106b exacerbates neurodegeneration in Grn −/− mice (A) Plasma NFL levels were elevated in 5 months old Tmem −/−, Grn −/−, and Tmem +/−, Grn +/− mice. A one-way ANOVA revealed an overall effect on genotype p < 0.0001 and post hoc analysis show that that Tmem −/−, Grn −/− and Tmem +/−, Grn +/− have significantly higher levels of plasma NFL when compared to Wt. n = 11–16 animals/genotype. (B) One-way ANOVA revealed an overall effect of genotype on solochrome staining in FB p < 0.0001 and HB p < 0.0001. Post-hoc analysis revealed significantly reduced solochrome staining in FB and HB of Tmem−/−,Grn−/− mice compared to Wt mice. In HB, solochrome staining was reduced in Grn −/− mice compared to Wts and further reduced in Tmem −/−, Grn −/− mice. (C) Representative images of dramatic increases in amino cupric silver (AmCuAg) staining in FB, HB, and SC in Tmem −/−, Grn −/− tissues. (D) Tmem −/−, Grn −/− mice have significantly increased levels of AmCuAg staining in spinal cord and brain. One-way ANOVA reveals an overall effect of genotype on FB p < 0.0001, HB p < 0.0001, SC p < 0.0001. Tmem −/−, Grn −/− mice show significantly increased levels of AmCuAg in brain and spinal cord when compared to all other genotypes. For histology n = 11–16 animals/genotype and 4–5 sections/animal/tissue area/stain. Student’s t test or Tukey’s post-hoc ∗p < 0.05, ∗∗p < 0.01, ∗∗∗p < 0.001, ∗∗∗∗p < 0.0001. ##p < 0.01 Grn −/− vs. Tmem −/−, Grn −/− All error bars represent S.E.M.
Figure 5
Figure 5
Heterozygous deletion of Tmem106b does not rescue Grn −/− omic profile in 13 months old Grn −/− mice (A and B) Volcano plots of lipidomic profiles comparing Grn−/− with WT cortex (A) or hippocampus (B). Red dots indicate significantly different lipids. (C and D) BMP species levels were reduced similarly in Grn −/− and Tmem+/−, Grn−/− mice compared to Wt mice in cortex and hippocampus. (E and F) Glucosylceramide and glucosylsphingosine levels were elevated in Grn−/− mice but to a lesser extent in Tmem +/−,Grn−/− mice in hippocampus by Mann Whitney U. (G–N) Bulk RNAseq from isolated thalamic microglia. Select significant (FDR <0.05 & |Log2FC| > 1) differentially expressed genes from pairwise contrasts of Grn −/− vs. Wt and Tmem +/− Grn −/− vs. Grn −/−. N = 5–14 animals/genotype. ∗p < 0.05, ∗∗p < 0.01, ∗∗∗p < 0.001, ∗∗∗∗p < 0.0001. All error bars represent S.E.M.
Figure 6
Figure 6
Heterozygous deletion of Tmem106b does not rescue histopathology in 13 months old Grn −/− mice (A) Representative images of CD68, LAMP1, and CatD from forebrain (FB) coronal sections. (B) Overall effects of genotype observed for CD68 staining in whole section analysis (FB) p < 0.0001, (HB) p < 0.0001 sections by one-way ANOVA. Grn −/− mice had significantly increased levels of CD68 compared to Wt mice. Tmem +/−, Grn −/− mice did not differ from Grn −/− mice, showing significantly increased levels of CD68 in FB and HB compared to Wt mice. Also, Tmem −/− mice displayed significant increase in CD68 in HB compared to Wt mice. (C) Lamp1 staining is significantly altered between genotypes in FB p < 0.0001 and HB p < 0.0001 by one-way ANOVA. Grn −/− mice show significantly increased levels of Lamp1 in FB and HB when compared to all other genotypes. Lamp1 levels were partially reduced in Tmem +/−, Grn −/− compared to Grn −/− mice. Tmem −/− mice displayed a significant increase in Lamp1 in HB only. (D) One-way ANOVA reveals an overall genotype effect on cathepsin D in FB p = 0.002 and HB p < 0.0001. Grn −/− and Tmem +/−, Grn −/− mice have significantly increased levels of cathepsin D in FB and HB when compared to Wt and did not differ from each other. (E) One-way ANOVA reveals an overall genotype effect of AmCuAg staining HB p < 0.0001 but not in FB. Tmem −/− and Grn −/−mice each had significantly increased levels of AmCuAg in HB when compared to Wt. Tmem +/−, Grn −/− mice did not differ significantly from Grn−/− mice. For histology, n = 5–10 animals/genotype and 4–5 sections/animal/tissue area/stain. (F) An overall effect of genotype was detected in plasma NFL levels by one-way ANOVA p < 0.0001. NFL was significantly increased in Tmem −/− and Grn −/− mice compared to Wt mice. Tmem +/−, Grn −/− NFL levels did not differ from Grn −/− mice. Tmem +/−, Grn +/− NFL levels were similar to Wt mice. N = 8–14 animals/genotype. Student’s test or Tukey post-hoc ∗p < 0.05, ∗∗p < 0.01, ∗∗∗p < 0.001, ∗∗∗∗p < 0.0001. All error bars represent S.E.M. Figure created with BioRender.com.
Figure 7
Figure 7
Partial reduction of Tmem106b with ASO treatment is toxic in Grn −/− mice (A and B) Study designs for Tmem106b ASO dosing experiments in Wt (A) and Grn +/− and Grn −/− mice (B). (C and D) Significant knockdown of Tmem106b RNA and protein observed in brains of Wt mice with an overall effect of ASO by one-way ANOVA for mRNA, p < 0.001 and protein, p < 0.0074. When compared to saline, all 4 ASOs significantly reduced Tmem106b RNA and protein levels. (E) Little to no adverse events observed in Wt mice after ASO dosing. n = 6 Wt mice/group. (F and G) Significant knockdown of Tmem106b RNA was observed in brains of Grn +/− mice with an overall effect of ASO by one-way ANOVA for RNA p < 0.001 but not for protein. When compared to NC ASO, all 4 Tmem106b ASOs significantly reduced Tmem106b mRNA levels but not protein levels. (H) Little to no adverse event observed in Grn +/− mice after ASO dosing. n = 4–5 Grn +/− mice/group. (I and J) Significant knockdown of Tmem106b mRNA and protein was observed in brains of Grn −/− mice with an overall effect of ASO by one-way ANOVA for RNA p < 0.001 and protein p = 0.0088. When compared to NC ASO, all 4 Tmem106b ASOs significantly reduced Tmem106b RNA levels with 3/4 ASOs also significantly reducing protein levels. n = 3–5 Grn −/− mice/group. (K) At 5–7 days of age many of the Grn −/− mice dosed with Tmem106b targeting ASO developed adverse events including death, seizures, and significant weight loss. Post-hoc Student’s t test ∗p < 0.05, ∗∗p < 0.01, ∗∗∗p < 0.001, ∗∗∗∗p < 0.0001. All error bars represent S.E.M.

References

    1. Van Deerlin V.M., Sleiman P.M.A., Martinez-Lage M., Chen-Plotkin A., Wang L.S., Graff-Radford N.R., Dickson D.W., Rademakers R., Boeve B.F., Grossman M., et al. Common variants at 7p21 are associated with frontotemporal lobar degeneration with TDP-43 inclusions. Nat. Genet. 2010;42:234–239. - PMC - PubMed
    1. Finch N., Carrasquillo M.M., Baker M., Rutherford N.J., Coppola G., Dejesus-Hernandez M., Crook R., Hunter T., Ghidoni R., Benussi L., et al. TMEM106B regulates progranulin levels and the penetrance of FTLD in GRN mutation carriers. Neurology. 2011;76:467–474. - PMC - PubMed
    1. Van der Zee J., Van Langenhove T., Kleinberger G., Sleegers K., Engelborghs S., Vandenberghe R., Santens P., Van den Broeck M., Joris G., Brys J., et al. TMEM106B is associated with frontotemporal lobar degeneration in a clinically diagnosed patient cohort. Brain. 2011;134:808–815. - PMC - PubMed
    1. Cruchaga C., Graff C., Chiang H.H., Wang J., Hinrichs A.L., Spiegel N., Bertelsen S., Mayo K., Norton J.B., Morris J.C., Goate A. Association of TMEM106B gene polymorphism with age at onset in granulin mutation carriers and plasma granulin protein levels. Arch. Neurol. 2011;68:581–586. - PMC - PubMed
    1. Chen-Plotkin A.S., Unger T.L., Gallagher M.D., Bill E., Kwong L.K., Volpicelli-Daley L., Busch J.I., Akle S., Grossman M., Van Deerlin V., et al. TMEM106B, the risk gene for frontotemporal dementia, is regulated by the microRNA-132/212 cluster and affects progranulin pathways. J. Neurosci. 2012;32:11213–11227. - PMC - PubMed