N-acetylcysteine prevents catheter occlusion and inflammation in catheter associated-urinary tract infections by suppressing urease activity
- PMID: 37965267
- PMCID: PMC10641931
- DOI: 10.3389/fcimb.2023.1216798
N-acetylcysteine prevents catheter occlusion and inflammation in catheter associated-urinary tract infections by suppressing urease activity
Abstract
Introduction: Proteus mirabilis is a key pathobiont in catheter-associated urinary tract infections (CA-UTIs), which is well known to form crystalline biofilms that occlude catheters. Urease activity alkylates urine through the release of ammonia, consequentially resulting in higher levels of Mg2+ and Ca2+ and formation of crystals. In this study, we showed that N-acetyl cysteine (NAC), a thiol antioxidant, is a potent urease inhibitor that prevents crystalline biofilm formation.
Methods: To quantify urease activity, Berthelot's method was done on bacterial extracts treated with NAC. We also used an in vitro catheterised glass bladder model to study the effect of NAC treatment on catheter occlusion and biofilm encrustation in P. mirabilis infections. Inductively-coupled plasma mass spectrometry (ICP-MS) was performed on catheter samples to decipher elemental profiles.
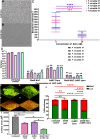
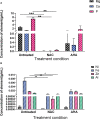
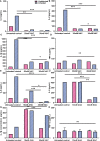
Results: NAC inhibits urease activity of clinical P. mirabilis isolates at concentrations as low as 1 mM, independent of bacterial killing. The study also showed that NAC is bacteriostatic on P. mirabilis, and inhibited biofilm formation and catheter occlusion in an in vitro. A significant 4-8log10 reduction in viable bacteria was observed in catheters infected in this model. Additionally, biofilms in NAC treated catheters displayed a depletion of calcium, magnesium, or phosphates (>10 fold reduction), thus confirming the absence of any urease activity in the presence of NAC. Interestingly, we also showed that not only is NAC anti-inflammatory in bladder epithelial cells (BECs), but that it mutes its inflammatory response to urease and P. mirabilis infection by reducing the production of IL-6, IL-8 and IL-1b.
Discussion: Using biochemical, microbiological and immunological techniques, this study displays the functionality of NAC in preventing catheter occlusion by inhibiting urease activity. The study also highlights NAC as a strong anti-inflammatory antibiofilm agent that can target both bacterial and host factors in the treatment of CA-UTIs.
Keywords: N-acetyl cysteine (NAC); Proteus mirabilis; UTI; biofilms; catheter-associated urinary tract infections (CA-UTI); urease.
Copyright © 2023 Manoharan, Farrell, Aldilla, Whiteley, Kriel, Glasbey, Kumar, Moore, Manos and Das.
Conflict of interest statement
Authors GW, TG, JF, and EK were employed by the company Whiteley Corporation. Author AM was remunerated under a parallel grant from Whiteley Corporation in the name of R. K. Whiteley (now deceased). The remaining authors declare that the research was conducted in the absence of any commercial or financial relationships that could be construed as a potential conflict of interest.
Figures


Similar articles
-
Crystalline bacterial biofilm formation on urinary catheters by urease-producing urinary tract pathogens: a simple method of control.J Med Microbiol. 2009 Oct;58(Pt 10):1367-1375. doi: 10.1099/jmm.0.012419-0. Epub 2009 Jun 25. J Med Microbiol. 2009. PMID: 19556373
-
Clinical complications of urinary catheters caused by crystalline biofilms: something needs to be done.J Intern Med. 2014 Aug;276(2):120-9. doi: 10.1111/joim.12220. J Intern Med. 2014. PMID: 24635559 Review.
-
Inhibition of Urease Enzyme Production and some Other Virulence Factors Expression in Proteus mirabilis by N-Acetyl Cysteine and Dipropyl Disulphide.Adv Exp Med Biol. 2017;973:99-113. doi: 10.1007/5584_2016_197. Adv Exp Med Biol. 2017. PMID: 28190143
-
Irrigation with N,N-dichloro-2,2-dimethyltaurine (NVC-422) in a citrate buffer maintains urinary catheter patency in vitro and prevents encrustation by Proteus mirabilis.Urolithiasis. 2016 Jun;44(3):247-56. doi: 10.1007/s00240-015-0811-3. Epub 2015 Aug 18. Urolithiasis. 2016. PMID: 26282899
-
Bacterial biofilm formation on indwelling urethral catheters.Lett Appl Microbiol. 2019 Apr;68(4):277-293. doi: 10.1111/lam.13144. Lett Appl Microbiol. 2019. PMID: 30811615 Review.
Cited by
-
Beyond Infection: How Antimicrobial Therapies Influence the Urinary Microbiome and Stone Disease.Pharmaceuticals (Basel). 2025 Jul 12;18(7):1038. doi: 10.3390/ph18071038. Pharmaceuticals (Basel). 2025. PMID: 40732326 Free PMC article. Review.
-
Efficacy and safety of N-acetylcysteine vs. probiotics in in-vivo biofilm prevention on ureteral stents: a prospective randomized controlled pilot in vivo study.Int Urol Nephrol. 2025 Aug 11. doi: 10.1007/s11255-025-04713-w. Online ahead of print. Int Urol Nephrol. 2025. PMID: 40788469
-
Combating biofilm formation and bacterial killing: N-acetylcysteine's efficacy against Pseudomonas aeruginosa in urinary catheters.Biofilm. 2025 Jun 25;10:100296. doi: 10.1016/j.bioflm.2025.100296. eCollection 2025 Dec. Biofilm. 2025. PMID: 40726828 Free PMC article.
-
An in-vitro model for bacteria-related catheter encrustations.World J Urol. 2024 Aug 7;42(1):469. doi: 10.1007/s00345-024-05191-y. World J Urol. 2024. PMID: 39110241
-
Urological Challenges during Pregnancy: Current Status and Future Perspective on Ureteric Stent Encrustation.J Clin Med. 2024 Jul 3;13(13):3905. doi: 10.3390/jcm13133905. J Clin Med. 2024. PMID: 38999471 Free PMC article. Review.
References
-
- Abdel-Baky R. M., Ali M. A., Abuo-Rahma G. E-D. A. A., AbdelAziz N. (2017). “Inhibition of Urease Enzyme Production and some Other Virulence Factors Expression in Proteus mirabilis by N-Acetyl Cysteine and Dipropyl Disulphide,” in Advances in Microbiology, Infectious Diseases and Public Health: Volume 7. Ed. Donelli G. (Cham: Springer International Publishing; ), 99–113. - PubMed
-
- Aiyer A., Visser S. K., Bye P., Britton W. J., Whiteley G. S., Glasbey T., et al. (2021). Effect of N-acetylcysteine in combination with antibiotics on the biofilms of three cystic fibrosis pathogens of emerging importance. Antibiotics 10 (10), 1176. doi: 10.3390/antibiotics10101176 - DOI - PMC - PubMed
-
- Armbruster C. E., Smith S. N., Johnson A. O., DeOrnellas V., Eaton K. A., Yep A., et al. (2017). The pathogenic potential of Proteus mirabilis is enhanced by other uropathogens during polymicrobial urinary tract infection. Infection. Immun. 85 (2), e00808–e00816. doi: 10.1128/IAI.00808-16 - DOI - PMC - PubMed
Publication types
MeSH terms
Substances
LinkOut - more resources
Full Text Sources
Medical
Miscellaneous

