. 2023 Oct 27:14:1274539.
doi: 10.3389/fimmu.2023.1274539. eCollection 2023.

Molecular profiling of clinical remission in psoriatic arthritis reveals dysregulation of FOS and CCDC50 genes: a gene expression study

Affiliations

Molecular profiling of clinical remission in psoriatic arthritis reveals dysregulation of FOS and CCDC50 genes: a gene expression study

Maria Maddalena Angioni et al. Front Immunol. .

Abstract

Background: In psoriatic arthritis (PsA), the primary goal of treatment is clinical remission. This study aimed to characterize the molecular profile underlying the induced clinical remission in patients with PsA, comparing the remission state and the healthy condition.

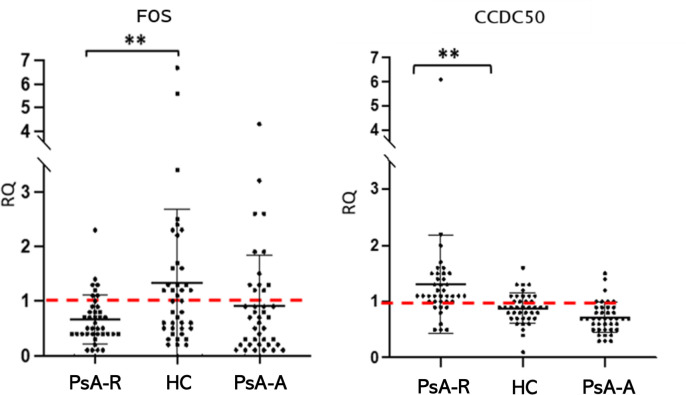
Methods: Whole blood transcriptomic analysis was performed on groups of 14 PsA patients in TNFi-induced clinical remission (DAPSA ≤ 4), 14 PsA patients with active disease (DAPSA > 14), and 14 healthy controls (HCs). Then, all differentially expressed genes (DEGs) derived from remission vs. HC comparison were analyzed for functional and biological characteristics by bioinformatics software. The gene expression of 12 genes was then validated by RT-qPCR in an extended cohort of 39 patients in clinical remission, 40 with active disease, and 40 HCs.

Results: The transcriptomic analysis of PsA remission vs. HCs highlighted the presence of 125 DEGs, and out of these genes, 24 were coding genes and showed a great involvement in immune system processes and a functional network with significant interactions. The RT-qPCR validation confirming the down- and upregulation of FOS (FC -2.0; p 0.005) and CCDC50 (FC +1.5; p 0.005) genes, respectively, in line with their role in orchestrating inflammation and bone metabolism processes, may be related to PsA pathophysiology.

Conclusion: The transcriptomic profile of clinical remission in PsA is similar to a healthy condition, but not identical, differing for the expression of FOS and CCDC50 genes, which appears to play a key role in its achievement.

Keywords: CCDC50; FOS; clinical remission; psoriatic arthritis; transcriptomic.


Conflict of interest statement

The authors declare that the research was conducted in the absence of any commercial or financial relationships that could be construed as a potential conflict of interest. The author(s) declared that they were an editorial board member of Frontiers, at the time of submission. This had no impact on the peer review process and the final decision.

Figures

Figure 1
Figure 1
(A) Transcriptomic analysis and clustering. Hierarchical clustering of 1,364 differentially expressed transcripts in at least one comparison in analysis (FC 1.5 and p-value 0.05). The profiled conditions are in the rows (in duplicates, two rows/condition. PsA_A, active psoriatic arthritis; PsA_R, remission psoriatic arthritis; HCs, healthy controls), and the transcripts are in the columns by a pseudocolor scale with expression values normalized to zero, SD = 1 (blue, lower abundance; red, higher abundance), as indicated in the legend scale. Four clusters are represented by four colors in the upper dendrogram, suggesting that these conditions have distinct signatures (or similarities). (B) Venn diagram illustrating the overlap between 1,364 transcripts differentially expressed on three comparative lists (identified with a minimum HR of 1.5 and p-value 0.05, no FDR correction applied). (C) DEG Gene Ontology analysis. For the bioinformatics Gene Ontology (GO) analysis, only differentially expressed transcripts between PsA-R condition vs. HC, with paired RefSeq, were included. The enrichment analysis about more represented GO classes (histogram bars) was made by fold enrichment and associated p-value (the reported enrichment score in brackets is the absolute count of identified transcripts vs. expected), both for macro- and microcategories.
Figure 2
Figure 2
(A) Hierarchical clustering of coding DEGs in remission state. Heatmap of 24 filtered coding DEGs in the PsA remission state and their expression in all profiled conditions, analysis in biological duplicates (cutoff FC ± 1.5, p-value 0.05). The profiled conditions are in the rows (in duplicates, two rows/condition: PsA_A, active psoriatic arthritis; PsA_R, remission psoriatic arthritis; HCs, healthy controls), and the DEGs are in the columns by a pseudocolor scale with expression values normalized to zero, SD = 1 (blue, lower abundance; red, higher abundance), as indicated in the legend scale. (B): coding DEGs Gene Ontology analysis. Only coding DEGs in the PsA-R condition vs. HC, with paired RefSeq, were included. The enrichment analysis about more represented GO classes (histogram bars) was made by fold enrichment and associated p-value (the reported enrichment score in brackets is the absolute count of identified transcripts vs. expected).
Figure 3
Figure 3
Interactome of coding DEGs misregulated on PsA clinical remission. Differentially expressed genes (DEGs) in the remission (PsA-R) group vs. healthy controls (HCs) analyzed for multiple protein interactions by the STRING software V10.5 (raw data and coordinates in Supplementary Material 4 ). Network nodes representing proteins, splice isoforms, or post-translational modifications are collapsed, i.e., each node represents all the proteins produced by a single, protein-coding gene locus. Edges represent protein–protein associations and are drawn as follows: red line = presence of fusion evidence; green line = neighborhood evidence; blue line = cooccurrence evidence; purple line = experimental evidence; yellow line = textmining evidence; light blue line = database evidence; black line = coexpression evidence. Edge associations are meant to be specific and meaningful, i.e., proteins jointly contribute to a shared function; this does not necessarily mean they are physically binding to each other. Represented network stats: number of nodes = 24; number of edges = 12; average node degree = 1; avg. local clustering coefficient = 0.369; expected number of edges = 3; PPI enrichment p-value = 3.17e−05.
Figure 4
Figure 4
The FOS and CCDC50 dysregulation in the PsA clinical remission. Mean (SD) of relative quantification (RQ) of FOS and CCDC50 genes in the remission (PsA-R), active (PsA-A), and healthy condition (HC). Analysis by the 2−ΔΔCt method. **p-value = 0.005.

References

    1. Ritchlin CT, Colbert RA, Gladman DD. Psoriatic arthritis. N Engl J Med (2017) 376:957–70. doi: 10.1056/NEJMra1505557 - DOI - PubMed
    1. McHugh NJ, Balachrishnan C, Jones SM. Progression of peripheral joint disease in psoriatic arthritis: a 5-yr prospective study. Rheumatology (2003) 42:778–83. doi: 10.1093/rheumatology/keg217 - DOI - PubMed
    1. Gossec L, Baraliakos X, Kerschbaumer A, de Wit M, McInnes I, Dougados M, et al. . EULAR recommendations for the management of psoriatic arthritis with pharmacological therapies: 2019 update. Ann Rheum Dis (2020) 79:700–12. doi: 10.1136/annrheumdis-2020-217159 - DOI - PMC - PubMed
    1. Coates LC, Soriano ER, Corp N, Bertheussen H, Callis Duffin K, Campanholo CB, et al. . Group for Research and Assessment of Psoriasis and Psoriatic Arthritis (GRAPPA): updated treatment recommendations for psoriatic arthritis 2021. Nat Rev Rheumatol (2022) 18:465–79. doi: 10.1038/s41584-022-00798-0 - DOI - PMC - PubMed
    1. Mease PJ, Coates LC. Considerations for the definition of remission criteria in psoriatic arthritis. Semin Arthritis Rheum (2018) 47:786–96. doi: 10.1016/j.semarthrit.2017.10.021 - DOI - PubMed

Substances

LinkOut - more resources