. 2023 Oct 27:14:1249379.
doi: 10.3389/fimmu.2023.1249379. eCollection 2023.

Single-cell transcriptomics reveals subtype-specific molecular profiles in Nrf2-deficient macrophages from murine atherosclerotic aortas

Affiliations

Single-cell transcriptomics reveals subtype-specific molecular profiles in Nrf2-deficient macrophages from murine atherosclerotic aortas

Katarzyna Sarad et al. Front Immunol. .

Abstract

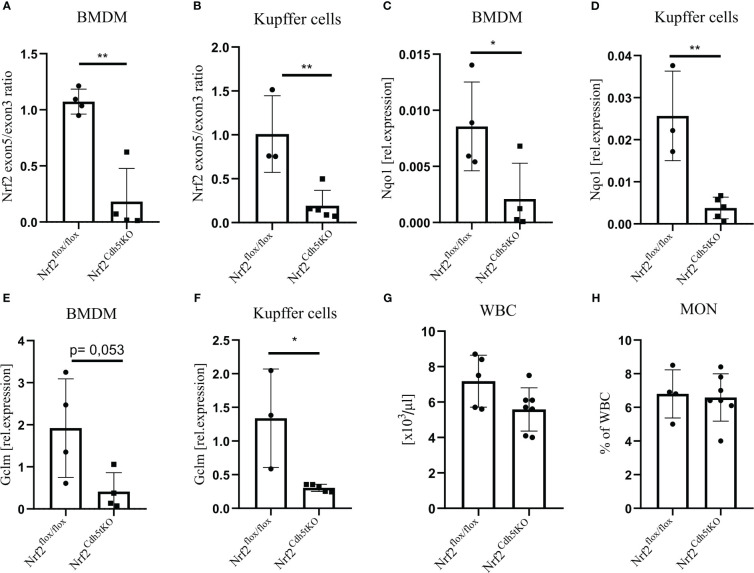
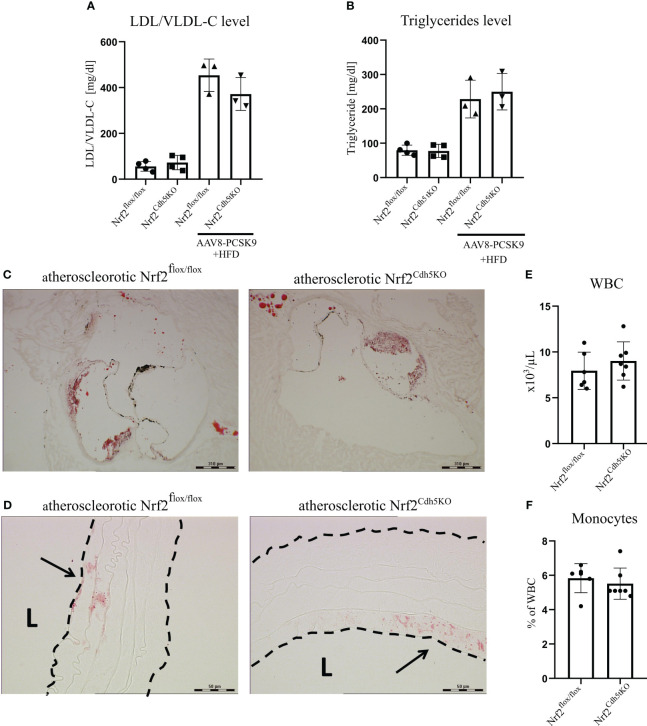
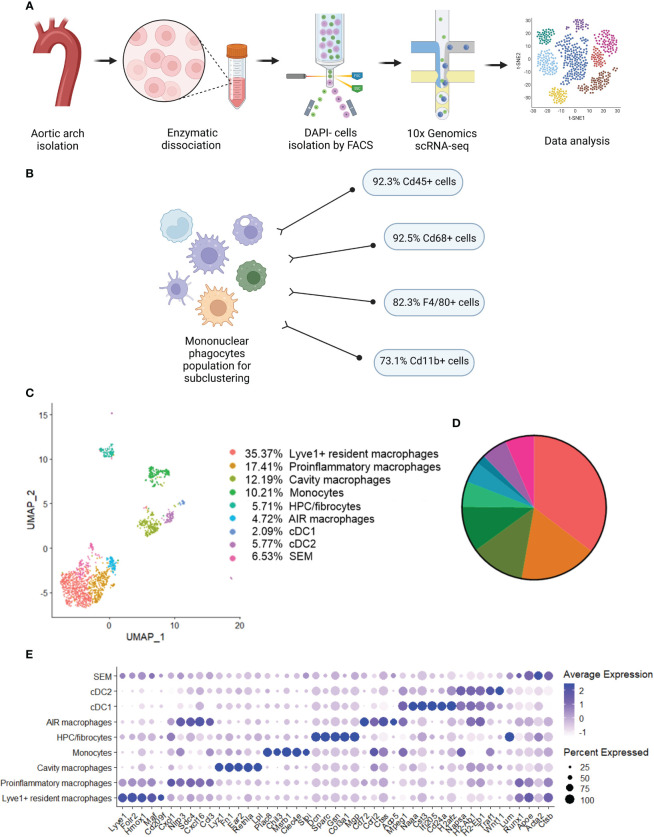
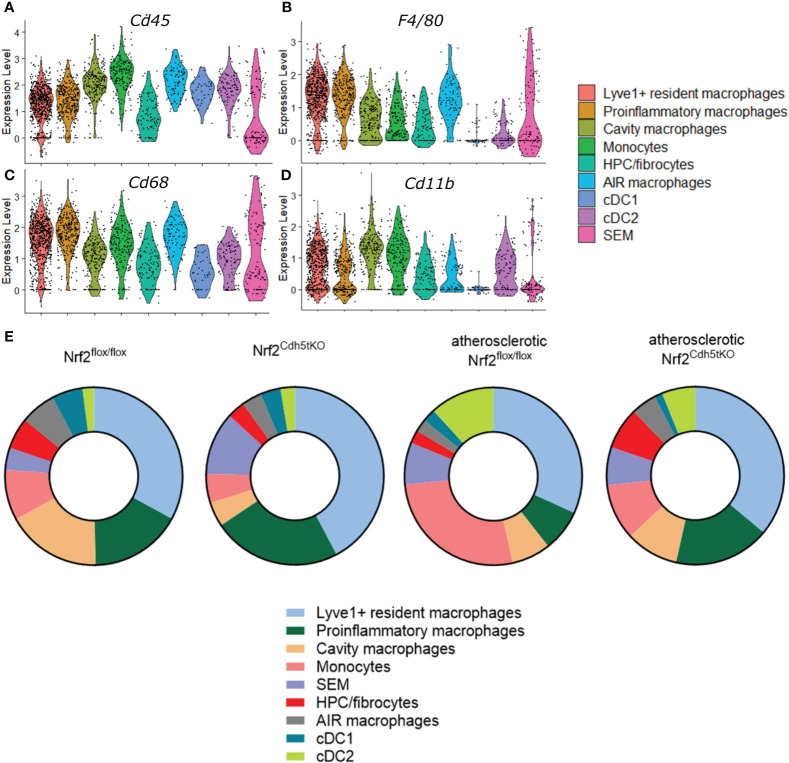
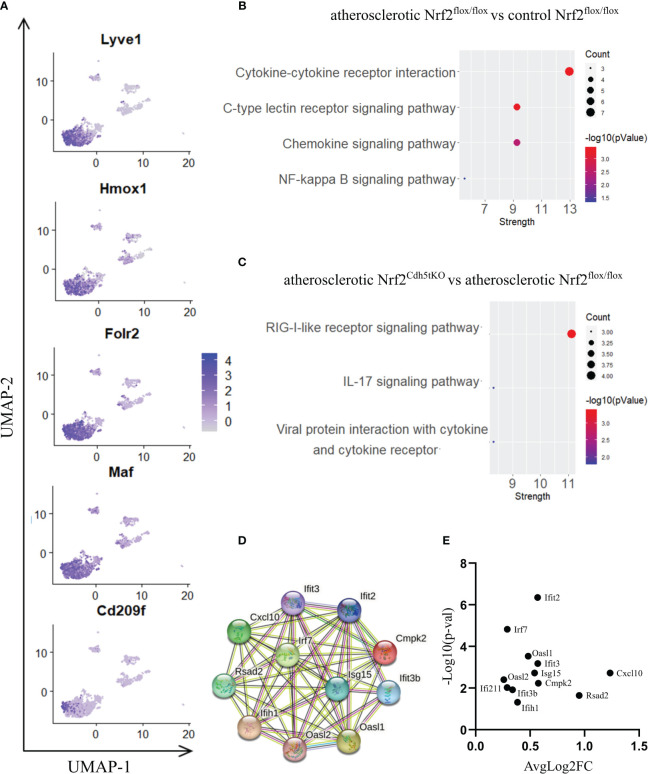
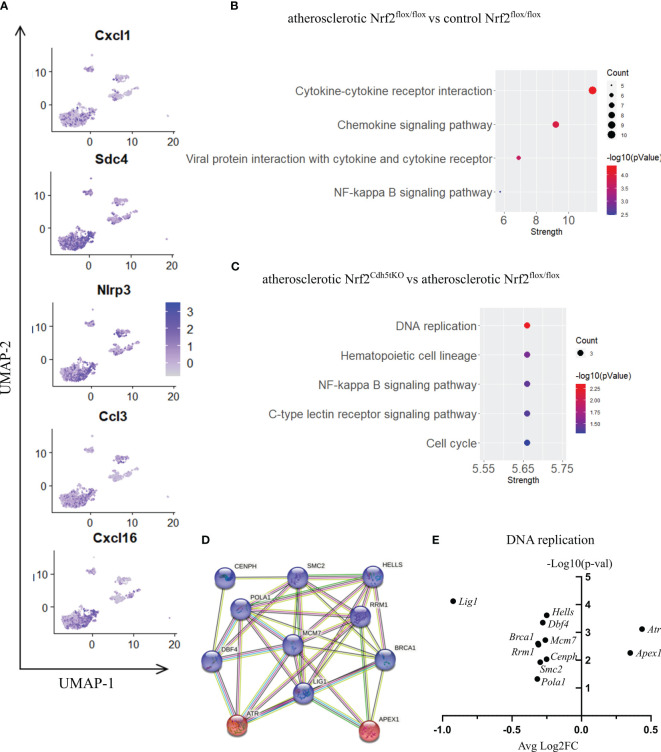
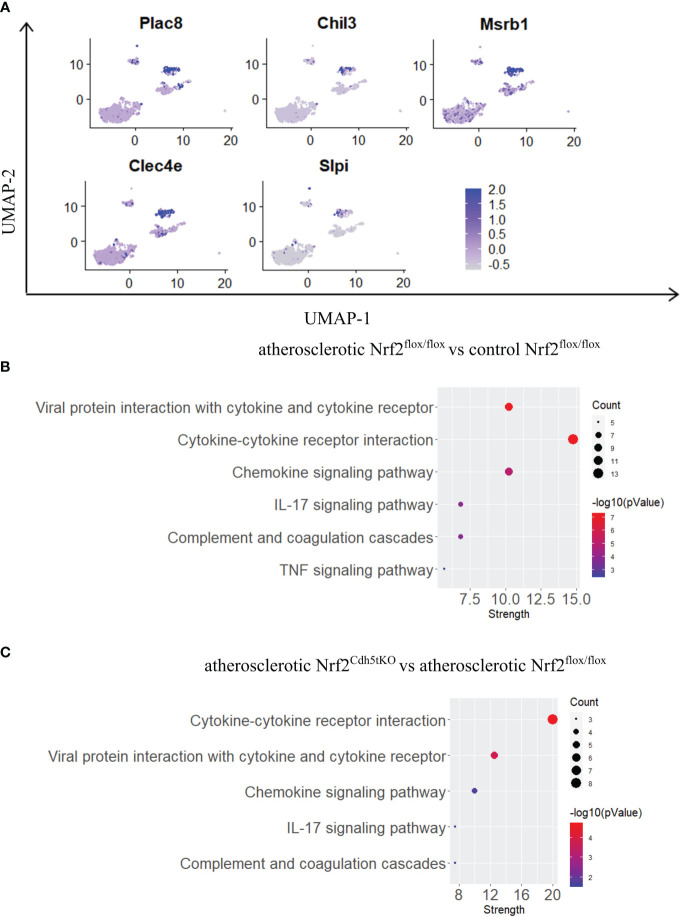
Nuclear factor erythroid 2-related factor 2 (Nrf2) is a transcriptional regulator of antioxidant and anti-inflammatory response in all cell types. It also activates the transcription of genes important for macrophage function. Nrf2 activity declines with age and has been closely linked to atherosclerosis, but its specific role in this vascular pathology is not clear. Atherosclerotic plaques contain several macrophage subsets with distinct, yet not completely understood, functions in the lesion development. The aim of this study was to analyze the transcriptome of diverse Nrf2-deficient macrophage subpopulations from murine atherosclerotic aortas. Mice with transcriptionally inactive Nrf2 in Cdh5-expressing cells (Nrf2 Cdh5tKO) were used in the experiments. These mice lack transcriptional Nrf2 activity in endothelial cells, but also in a proportion of leukocytes. We confirmed that the bone marrow-derived and tissue-resident macrophages isolated from Nrf2 Cdh5tKO mice exhibit a significant decline in Nrf2 activity. Atherosclerosis was induced in Nrf2 Cdh5tKO and appropriate control mice via adeno-associated viral vector (AAV)-mediated overexpression of murine proprotein convertase subtilisin/kexin type 9 (Pcsk9) in the liver and high-fat diet feeding. After 21 weeks, live aortic cells were sorted on FACS and single-cell RNA sequencing (scRNA-seq) was performed. Unsupervised clustering singled out 13 distinct aortic cell types. Among macrophages, 9 subclusters were identified. Differential gene expression analysis revealed cell subtype-specific expression patterns. A subset of inflammatory macrophages from atherosclerotic Nrf2 Cdh5tKO mice demonstrated downregulation of DNA replication genes (e.g. Mcm7, Lig1, Pola1) concomitant with upregulation of DNA damage sensor Atr gene. Atherosclerotic Nrf2 Cdh5tKO Lyve1+ resident macrophages showed strong upregulation of IFN-stimulated genes, as well as changes in the expression of death pathways-associated genes (Slc40a1, Bcl2a1). Furthermore, we observed subtype-specific expression of core ferroptosis genes (e.g. Cp, Hells, Slc40a1) in inflammatory versus tissue resident macrophages. This observation suggested a link between ferroptosis and inflammatory microenvironment appearing at a very early stage of atherogenesis. Our findings indicate that Nrf2 deficiency in aortic macrophages leads to subtype-specific transcriptomic changes associated with inflammation, iron homeostasis, cell injury or death pathways. This may help understanding the role of aging-associated decline of Nrf2 activity and the function of specific macrophage subtypes in atherosclerotic lesion development.

Keywords: Nrf2; atherosclerosis; heterogeneity; macrophages; monocytes; scRNA-seq.


Conflict of interest statement

The authors declare that the research was conducted in the absence of any commercial or financial relationships that could be construed as a potential conflict of interest.

Figures

Figure 1
Figure 1
Evaluation of Nrf2 expression in macrophages from Nrf2Cdh5tKO mice. (A) The qPCR confirming excision of exon 5 in Nrf2Cdh5tKO BMDM presented as a ratio of exon 5 to exon 3. (B) The qPCR confirming the excision of exon 5 Nrf2Cdh5tKO Kupffer cells presented as a ratio of exon 5 to exon 3. (C) The qPCR analysis of Nqo1 in BMDM. (D) The qPCR analysis of Nqo1 in Kupffer cells. (E) The qPCR analysis of Gclm in BMDM. (F) The qPCR analysis of Gclm in Kupffer cells. (G) The number of WBC in control Nrf2flox/flox and Nrf2Cdh5tKO mice. (H) The percentage of blood monocytes in control Nrf2flox/flox and Nrf2Cdh5tKO mice. Results are presented as mean ± SD (*p<0.05, ** p<0.01).
Figure 2
Figure 2
Characterization of atherosclerotic phenotype of Nrf2flox/flox and Nrf2Cdh5tKO mice. (A) The level of plasma cholesterol carried by LDL/VLDL lipoproteins in control healthy and atherosclerotic Nrf2flox/flox and Nrf2Cdh5tKO mice. (B) The level of plasma triglycerides in control healthy and atherosclerotic Nrf2flox/flox and Nrf2Cdh5tKO mice. (C) The staining of lipid deposits within aortic root of Nrf2flox/flox and Nrf2Cdh5tKO mice 21 weeks after AAV8-Pcsk9 injection and HFD. (D) The staining of lipid deposits in the brachiocephalic artery of Nrf2flox/flox and Nrf2Cdh5tKO mice 21 weeks after AAV8-Pcsk9 injection and HFD. Lumen of the blood vessel is marked with an ‘L’. The arrows indicate lipid deposits. (E) The number of WBC in the blood of Nrf2flox/flox and Nrf2Cdh5tKO mice 21 weeks after AAV8-Pcsk9 injection and HFD. (F) The percentage of monocytes in WBC population in the blood of atherosclerotic Nrf2flox/flox and Nrf2Cdh5tKO mice 21 weeks after AAV8-Pcsk9 injection and HFD. Results are presented as mean ± SD.
Figure 3
Figure 3
Identification of distinct mononuclear phagocytes in the analyzed fragments of aortas of Nrf2flox/flox and Nrf2Cdh5tKO mice. (A) Schematic depiction of the scRNA-seq procedure. (B) The percentage of cells expressing classical macrophage markers: Cd45, Cd68, F4/80, Cd11b within the whole macrophage population before subclustering. (C) UMAP representation of integrated scRNA-seq gene expression data from normocholesterolemic Nrf2flox/flox (n=4) and Nrf2Cdh5tKO (n=4), as well as atherosclerotic Nrf2flox/flox (n=3) and Nrf2Cdh5tKO (n=3) murine aortic arches and branches with identification of the major cell types. (D) Proportions of distinct cell types singled out among whole macrophage population. (E) Dot plot of average gene expression of the indicated marker transcripts for each cell cluster.
Figure 4
Figure 4
Characteristics of the identified mononuclear phagocyte clusters. The expression of typical macrophage genes (A) Cd45, (B) F4/80, (C) Cd68, (D) Cd11b within particular mononuclear phagocyte population shown in the violin plot. (E) Proportions of identified cell subsets in the analyzed fragments of aortas of control normocholesterolemic and atherosclerotic Nrf2flox/flox and Nrf2Cdh5tKO mice.
Figure 5
Figure 5
The analysis of transcriptomic changes in Lyve1+ resident macrophages. (A) Expression of marker genes identified for Lyve1+ resident macrophages projected onto the UMAP plot. (B) KEGG pathway enrichment analysis of upregulated and downregulated genes for atherosclerotic Nrf2flox/flox vs. control Nrf2flox/flox and (C) atherosclerotic Nrf2Cdh5tKO vs. atherosclerotic Nrf2flox/flox Lyve1+ resident macrophages. The x-axis represents the strength (Log10(observed/expected)) of enriched pathways, whereas the color denotes –log10(pValue) and dot size corresponds to gene count in each pathway. (D) STRING interaction network - graphical representation of Interferon-simulated genes (ISG) cluster. (E) Volcano plot of the top differentially expressed ISG in atherosclerotic Nrf2Cdh5tKO vs. atherosclerotic Nrf2flox/flox Lyve1+ resident macrophages.
Figure 6
Figure 6
The analysis of transcriptomic changes in proinflammatory macrophages. (A) Expression of marker genes identified for proinflammatory macrophages projected onto the UMAP plot. (B) KEGG pathway enrichment analysis of upregulated and downregulated genes for atherosclerotic Nrf2flox/flox vs. control Nrf2flox/flox and (C) atherosclerotic Nrf2Cdh5tKO vs. atherosclerotic Nrf2flox/flox proinflammatory macrophages. The x-axis represents the strength (Log10(observed/expected)) of enriched pathways, whereas the color denotes –log10(pValue) and dot size corresponds to gene count in each pathway. (D) STRING interaction network - graphical representation of DNA replication and repair genes cluster. The upregulated genes are presented in red color, the downregulated in blue. (E) Volcano plot of the top differentially expressed DNA replication and repair genes in atherosclerotic Nrf2Cdh5tKO vs. atherosclerotic Nrf2flox/flox proinflammatory macrophages.
Figure 7
Figure 7
The analysis of transcriptomic changes in monocytes. (A) Expression of marker genes identified for monocytes projected onto the UMAP plot. (B) KEGG pathway enrichment analysis of upregulated and downregulated genes for atherosclerotic Nrf2flox/flox vs. control Nrf2flox/flox and (C) atherosclerotic Nrf2Cdh5tKO vs. atherosclerotic Nrf2flox/flox monocytes. The x-axis represents the strength (Log10(observed/expected)) of enriched pathways, whereas the color denotes –log10(pValue) and dot size corresponds to gene count in each pathway.

Similar articles

Cited by

References

    1. Strong JP, Malcom GT, Newman WP, Oalmann MC. Early lesions of atherosclerosis in childhood and youth: natural history and risk factors. J Am Coll Nutr (1992) 11(sup1):51S–4S. doi: 10.1080/07315724.1992.10737984 - DOI - PubMed
    1. Emini Veseli B, Perrotta P, De Meyer GRA, Roth L, van der Donckt C, Martinet W, et al. . Animal models of atherosclerosis. Eur J Pharmacol (2017) 816:3–13. doi: 10.1016/j.ejphar.2017.05.010 - DOI - PubMed
    1. Reuter S, Gupta SC, Chaturvedi MM, Aggarwal BB. Oxidative stress, inflammation, and cancer: How are they linked? Free Radic Biol Med (2010) 49(11):1603–16. doi: 10.1016/j.freeradbiomed.2010.09.006 - DOI - PMC - PubMed
    1. Cochain C, Zernecke A. Macrophages in vascular inflammation and atherosclerosis. Pflüg Arch - Eur J Physiol (2017) 469(3–4):485–99. doi: 10.1007/s00424-017-1941-y - DOI - PubMed
    1. Moore KJ, Sheedy FJ, Fisher EA. Macrophages in atherosclerosis: a dynamic balance. Nat Rev Immunol (2013) 13(10):709–21. doi: 10.1038/nri3520 - DOI - PMC - PubMed

Publication types