. 2023 Oct 27:14:1208282.
doi: 10.3389/fimmu.2023.1208282. eCollection 2023.

Expansion of extrafollicular B and T cell subsets in childhood-onset systemic lupus erythematosus

Affiliations

Expansion of extrafollicular B and T cell subsets in childhood-onset systemic lupus erythematosus

Ryan M Baxter et al. Front Immunol. .

Abstract

Introduction: Most childhood-onset SLE patients (cSLE) develop lupus nephritis (cLN), but only a small proportion achieve complete response to current therapies. The prognosis of children with LN and end-stage renal disease is particularly dire. Mortality rates within the first five years of renal replacement therapy may reach 22%. Thus, there is urgent need to decipher and target immune mechanisms that drive cLN. Despite the clear role of autoantibody production in SLE, targeted B cell therapies such as rituximab (anti-CD20) and belimumab (anti-BAFF) have shown only modest efficacy in cLN. While many studies have linked dysregulation of germinal center formation to SLE pathogenesis, other work supports a role for extrafollicular B cell activation in generation of pathogenic antibody secreting cells. However, whether extrafollicular B cell subsets and their T cell collaborators play a role in specific organ involvement in cLN and/or track with disease activity remains unknown.

Methods: We analyzed high-dimensional mass cytometry and gene expression data from 24 treatment naïve cSLE patients at the time of diagnosis and longitudinally, applying novel computational tools to identify abnormalities associated with clinical manifestations (cLN) and disease activity (SLEDAI).

Results: cSLE patients have an extrafollicular B cell expansion signature, with increased frequency of i) DN2, ii) Bnd2, iii) plasmablasts, and iv) peripheral T helper cells. Most importantly, we discovered that this extrafollicular signature correlates with disease activity in cLN, supporting extrafollicular T/B interactions as a mechanism underlying pediatric renal pathogenesis.

Discussion: This study integrates established and emerging themes of extrafollicular B cell involvement in SLE by providing evidence for extrafollicular B and peripheral T helper cell expansion, along with elevated type 1 IFN activation, in a homogeneous cohort of treatment-naïve cSLE patients, a point at which they should display the most extreme state of their immune dysregulation.

Keywords: CyTOF; SLE; T peripheral helper cells; anergic B cells; interferon; nephritis; plasmablasts.


Conflict of interest statement

The authors declare that the research was conducted in the absence of any commercial or financial relationships that could be construed as a potential conflict of interest.

Figures

Figure 1
Figure 1
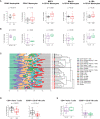
Untreated cSLE patients demonstrate enhanced interferon and plasmablast gene expression signatures compared to HC. HC (black, n=29) and SLE (red, n=16) subjects were assessed for gene expression of 10 mRNA modules. (A) Box plots (median, Q1, Q3) of module score (mean of Log2 normalized expression of constituent genes). p-values shown within each module comparison determined by Mann-Whitney U test with FDR correction; signficance<0.05. (B) Subject-wise dendrogram generated by unsupervised clustering of subjects (rows) according to modular gene expression (columns). Black line at 2nd branch level indicates significant enrichment (p = 4.8e-8) of SLE samples in lower branch ($, SLE n = 13/16, 81%; HC n = 4/29,14%) compared to the upper branch (#, SLE n = 3/16, 19%; HC n = 25/29, 86%). Clustering and testing detailed in methods.
Figure 2
Figure 2
Untreated cSLE patients demonstrate lymphoid and myeloid cellular features consistent with elevated interferon signaling compared to HC. Mass cytometry analysis of HC (black, n=23) and SLE (red, n=22) subjects without LN (purple, n=15) or with LN (green, n=7) at time of diagnosis (A) For HC vs. SLE, CD66+ Neutrophils frequency from all live cells, CD14hi Monocytes frequency from all lymphocytes, and percent of these cells expressing cytokines (MCP-1, Mip-1 β , IL-1RA) after 6 hours with protein transport inhibitor relative to 95th percentile time-zero threshold (methods). (B) Same as A, for No LN (purple) vs. LN (green). (C) Compositional Analysis using Kernels (CODAK) of 16 manually gated immune cell subsets (listed with color code at right) shows the proportion of each cell type (x-axis) per subject (y-axis). Overall significance of disease-specific compositional difference, p = 1.2e-4. Row-wise dendrogram generated by unsupervised clustering of subjects according to cell type composition. Black line at 3rd branch level indicates significant enrichment (p = 2.19e-7) of SLE subjects clustering in the lower branch ($, SLE n = 16/22, 73%; HC n = 11/23, 48%) compared to the upper branch (#, SLE n = 6/22, 27%; HC n = 12/23, 52%). (D, E) Frequency of populations shown as percentage of lymphocytes (Y-axis), comparing HC vs. SLE (D) and SLE patients with LN and No LN (E). For all box plots (median, Q1, Q3) p-values shown within each module comparison determined by Mann-Whitney U test with FDR correction; signficance<0.05.
Figure 3
Figure 3
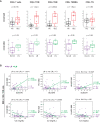
CD8+ T cells from untreated cSLE patients exhibit an activated/exhausted phenotype that correlates with disease score in cLN. Mass cytometry analysis of HC (black, n=23) and SLE (red, n=22) subjects without LN (purple, n=15) or with LN (green, n=7) at time of diagnosis (A) or longitudinally (B). (A) Median CD38 MMI (arcsinh transformed value) for CD8+ T cell subsets. (B) Differential correlations of surface activation marker expression (CD38, PD1, and HLA-DR untransformed MMI) on CD8+ TCM vs. SLEDAI score (left) and C3 (mg/dL; right) for No LN and LN subjects including all timepoints (accounting for repeated measures). p values at top of plots test differential correlations between No LN (purple, n=48) and LN (green, n=16) r and p values at right of plots describe No LN and LN specific correlations. Correlation tests performed by linear mixed model (methods). For all box plots (median, Q1, Q3) p-values shown within each module comparison determined by Mann-Whitney U test with FDR correction; signficance <0.05.
Figure 4
Figure 4
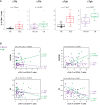
Untreated cSLE patients demonstrate increased frequency of T follicular helper (cTfh) and T peripheral helper (cTph) compared to HC, and cTph frequency correlates with disease activity longitudinally in cLN. Mass cytometry analysis of HC (black, n=23) and SLE (red, n=22) subjects without LN (purple, n=15) or with LN (green, n=7) at time of diagnosis (A) or longitudinally (B). (A) cTfh and cTph cells as % of CD4+ T cells for HC vs. SLE and No LN vs. LN. (B) Differential correlations of cTfh and cTph frequencies at all timepoints vs. SLEDAI score (top) and C3 (mg/dL; bottom) for No LN and LN subjects including all timepoints (accounting for repeated measures). p values at top of plots test differential correlations between No LN (purple, n=48) and LN (green, n=16) r and p values at right of plots describe No LN and LN specific correlations. Correlation tests performed by linear mixed model (methods). For all box plots (median, Q1, Q3) p-values shown within each module comparison determined by Mann-Whitney U test with FDR correction; signficance <0.05.
Figure 5
Figure 5
Untreated cSLE patients demonstrate increased frequency of activated B cell subsets compared to HC, and plasmablasts are more frequent in cLN compared to No LN. Mass cytometry analysis of HC (black, n=23) and SLE (red, n=22) subjects without LN (purple, n=15) or with LN (green, n=7) at time of diagnosis. (A) Boxplots of B cell subsets shown % of CD19+ B cells in HC vs. SLE. (B) Same as A but comparing No LN (purple) vs. LN (green). For all box plots (median, Q1, Q3) p-values shown within each module comparison determined by Mann-Whitney U test with FDR correction; signficance <0.05.
Figure 6
Figure 6
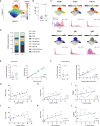
Untreated cLN patients exhibit a B cell disease-specific population spanning plasma cell differentiation that correlates with cTph and cTfh frequencies. Mass cytometry analysis of No LN (purple, n=15) and LN (green, n=7) subjects at time of diagnosis. A supervised neural network-based learning algorithm (CellCnn) was applied to analyze B cells from SLE patients with and without LN at time of diagnosis to identify i) an immunophenotypic signature based on surface markers (A–C) that discriminates between No LN and LN. (A) UMAP projection composite for all samples showing 85th percentile of cells with CellCnn scores conforming to filter (see methods; CellCnn Score coloration indicates strength of conformity to cell-selection signature). (B) Frequency of CellCnn-selected cells in No LN and LN subjects. (C) Overlay of relevant characteristic marker intensities on UMAP projection (as in A); corresponding histogram of marker intensity between selected (red) and all (blue) B cells (KS = Kolgorov-Smirnov distance). (D) B cell subset composition of CellCnn-selected B cells based on manually-gated populations for No LN (n=15) vs. LN (n=6*) groups (methods). (E) Boxplots of plasmablast frequency from CellCnn-selected B cells from LN vs. No LN groups. Spearman correlation of PB frequency from % CellCnn-selected B cells vs. manually-gated PB frequency from % total B cells analyzed. (F) Same as E but for isotype switched B cells. Spearman correlations of the frequency manually-gated cTph, cTfh cells, and SLEDAI vs. % CellCnn PB-DN2 cells (G–I) and those CellCnn-selected B cells that were identical to user-gated plasmablasts (J–L). *For one LN subject, CellCnn-selected cells comprised 98.4% PBs. Subject excluded from panels E-L to calculate correlation coefficient and significance. For all box plots (median, Q1, Q3) p-values shown within each module comparison determined by Mann-Whitney U test with FDR correction; signficance <0.05.
Figure 7
Figure 7
The B cell compartment of untreated cLN patients demonstrates disease-specific signature populations defined by cytokine production that correlates with disease activity. Mass cytometry analysis of No LN (purple, n=15) and LN (green, n=7) subjects at time of diagnosis. A supervised neural network-based learning algorithm (CellCnn) was applied to analyze B cells from SLE patients with and without LN at time of diagnosis to identify signature population based on intracellular cytokine production that discriminates between No LN and LN. (A) UMAP projection composite for all samples showing 85th percentile of cells with CellCnn scores conforming to filter (see methods; CellCnn Score coloration indicates strength of conformity to cell-selection signature. (B) Frequency of selected cells in No LN and LN subjects. (C) Overlay of relevant characteristic marker intensities on UMAP projection (as in A); corresponding histogram of marker intensity between selected (red) and all (blue) B cells (KS = Kolgorov-Smirnov distance). (D) Spearmann correlation of SLEDAI vs. % of CellCnn-selected B cells by cytokine signature; significance <0.05.

References

    1. Mina R, Brunner HI. Pediatric lupus–are there differences in presentation, genetics, response to therapy, and damage accrual compared with adult lupus? Rheum Dis Clin North Am (2010) 36:53–80, vii-viii. doi: 10.1016/j.rdc.2009.12.012 - DOI - PMC - PubMed
    1. Tucker LB, Uribe AG, Fernandez M, Vila LM, McGwin G, Apte M, et al. Adolescent onset of lupus results in more aggressive disease and worse outcomes: results of a nested matched case-control study within LUMINA, a multiethnic US cohort (LUMINA LVII). Lupus (2008) 17:314–22. doi: 10.1177/0961203307087875 - DOI - PMC - PubMed
    1. Hiraki LT, Benseler SM, Tyrrell PN, Hebert D, Harvey E, Silverman ED. Clinical and laboratory characteristics and long-term outcome of pediatric systemic lupus erythematosus: a longitudinal study. J Pediatr (2008) 152:550–6. doi: 10.1016/j.jpeds.2007.09.019 - DOI - PubMed
    1. Tunnicliffe DJ, Palmer SC, Henderson L, Masson P, Craig JC, Tong A, et al. Immunosuppressive treatment for proliferative lupus nephritis. Cochrane Database Syst Rev (2018) 6:CD002922. doi: 10.1002/14651858.CD002922.pub4 - DOI - PMC - PubMed
    1. Demir S, Gulhan B, Ozen S, Celegen K, Batu ED, Tas N, et al. Long-term renal survival of paediatric patients with lupus nephritis. Nephrol Dial Transplant (2022) 37:1069–77. doi: 10.1093/ndt/gfab152 - DOI - PubMed

Publication types