Clinical Trial
. 2023 Oct 30:14:1251593.
doi: 10.3389/fimmu.2023.1251593. eCollection 2023.

Prevention of CMV/EBV reactivation by double-specific T cells in patients after allogeneic stem cell transplantation: results from the randomized phase I/IIa MULTIVIR-01 study

Affiliations
Clinical Trial

Prevention of CMV/EBV reactivation by double-specific T cells in patients after allogeneic stem cell transplantation: results from the randomized phase I/IIa MULTIVIR-01 study

Armin Gerbitz et al. Front Immunol. .

Abstract

Introduction: Allogeneic stem cell transplantation is used to cure hematologic malignancies or deficiencies of the hematopoietic system. It is associated with severe immunodeficiency of the host early after transplant and therefore early reactivation of latent herpesviruses such as CMV and EBV within the first 100 days are frequent. Small studies and case series indicated that application of herpes virus specific T cells can control and prevent disease in this patient population.

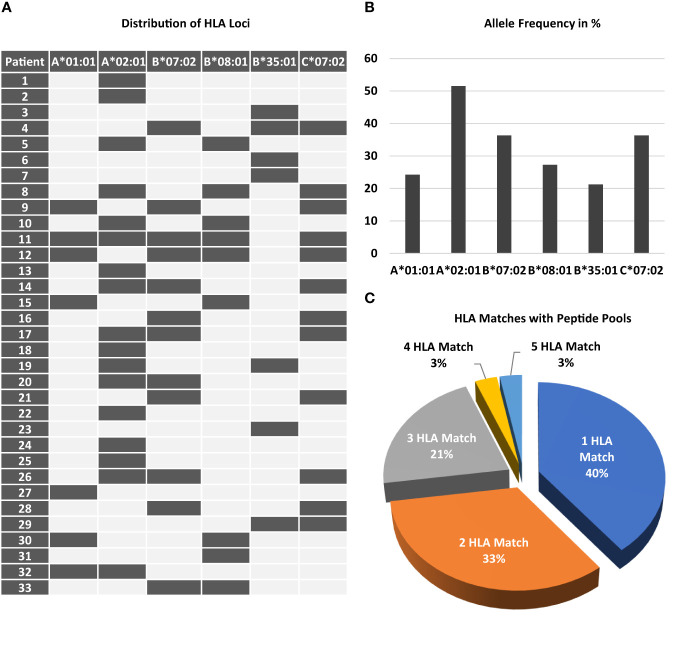
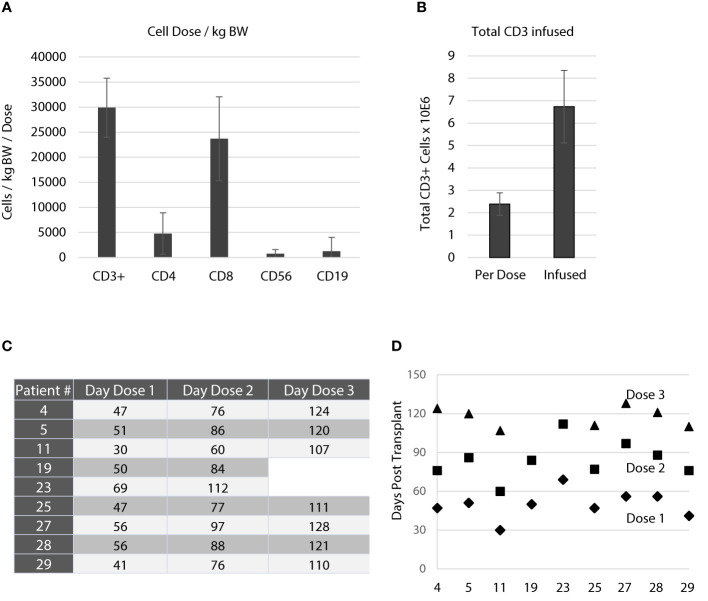
Methods: We report the results of a randomized controlled multi centre phase I/IIa study (MULTIVIR-01) using a newly developed T cell product with specificity for CMV and EBV derived from the allogeneic stem cell grafts used for transplantation. The study aimed at prevention and preemptive treatment of both viruses in patients after allogeneic stem cell transplantation targeting first infusion on day +30. Primary endpoints were acute transfusion reaction and acute-graft versus-host-disease after infusion of activated T cells.

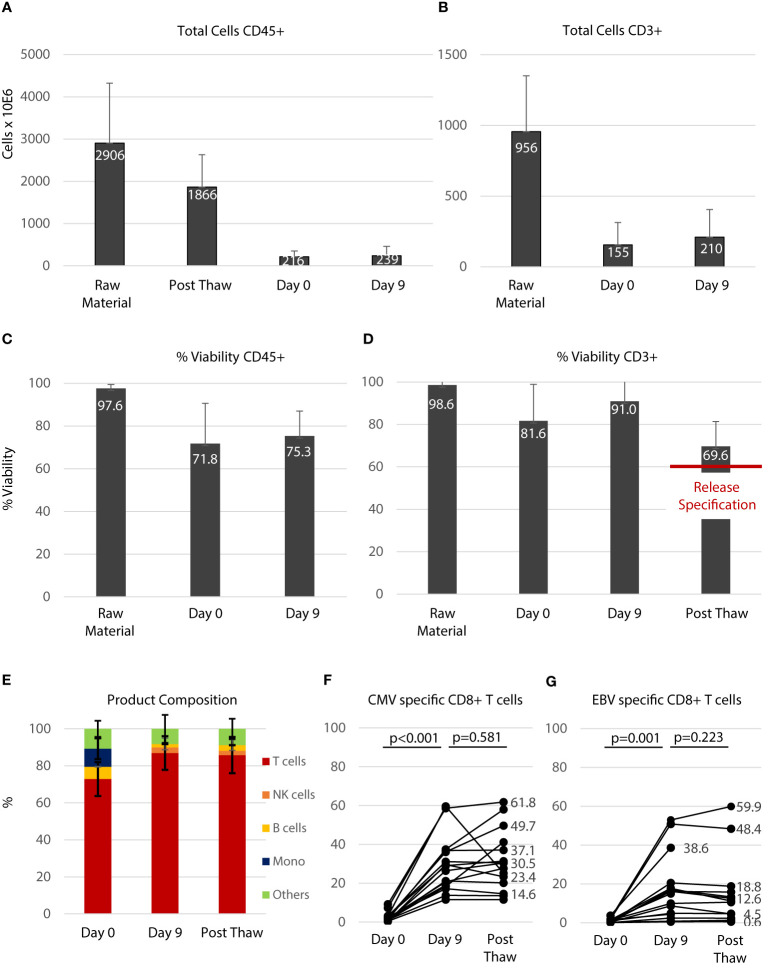
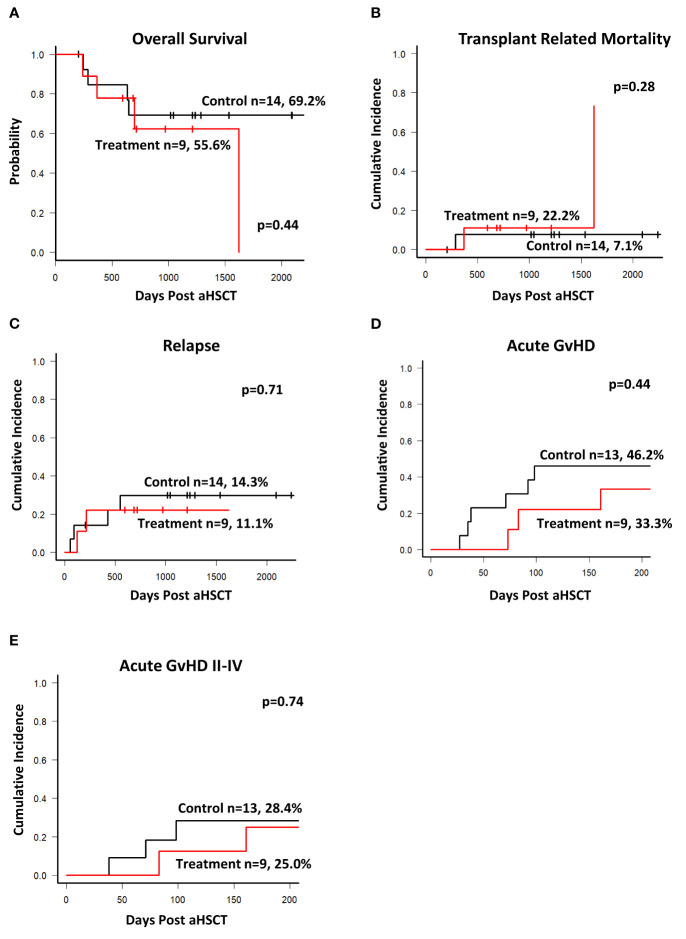
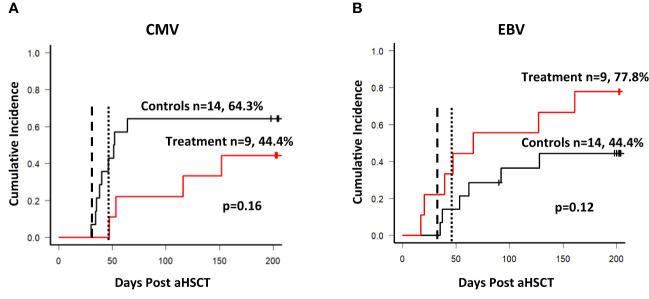
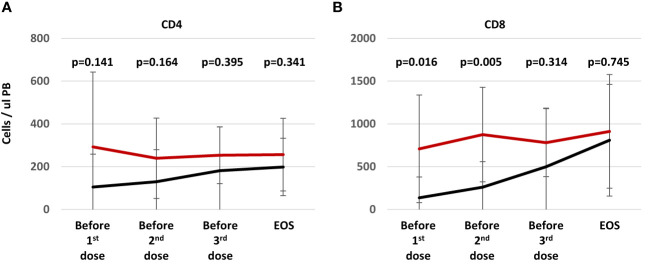
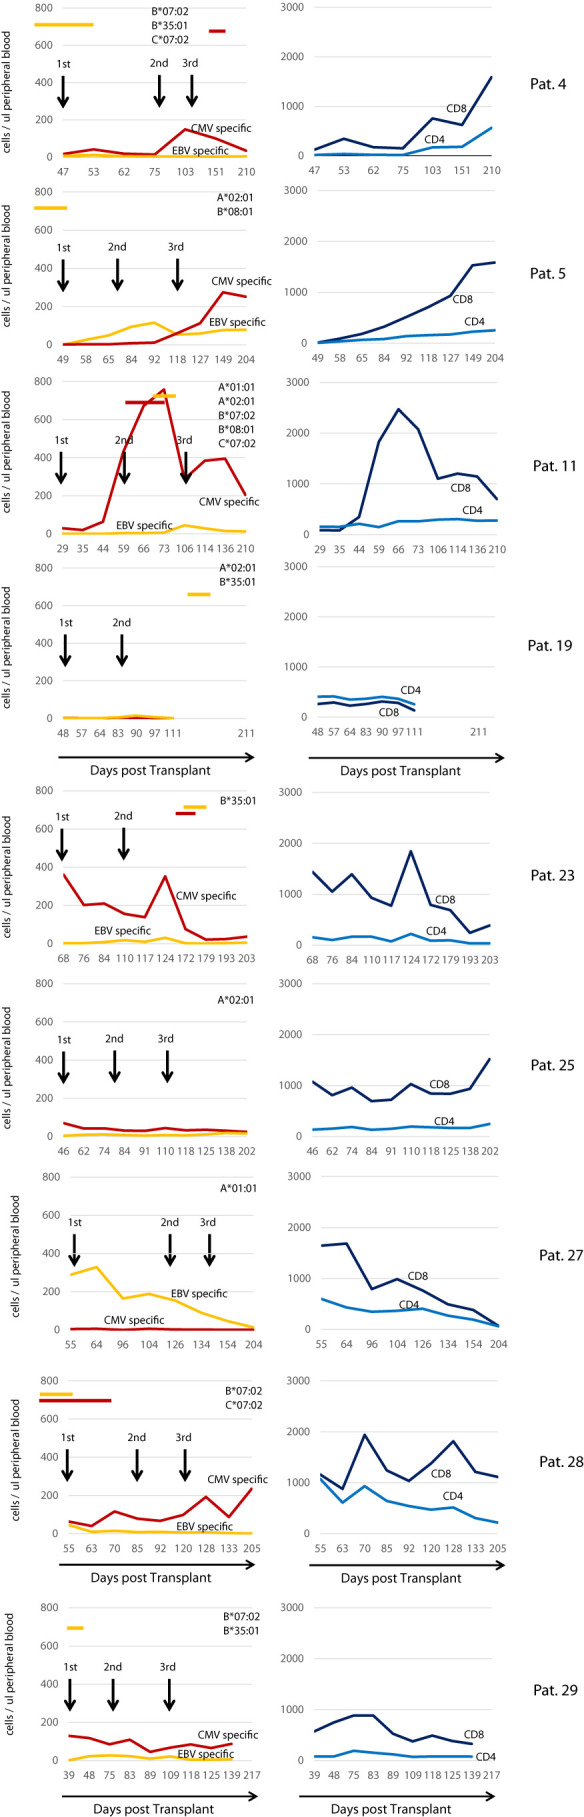
Results: Thirty-three patients were screened and 9 patients were treated with a total of 25 doses of the T cell product. We show that central manufacturing can be achieved successfully under study conditions and the product can be applied without major side effects. Overall survival, transplant related mortality, cumulative incidence of graft versus host disease and number of severe adverse events were not different between treatment and control groups. Expansion of CMV/EBV specific T cells was observed in a fraction of patients, but overall there was no difference in virus reactivation.

Discussion: Our study results indicate peptide stimulated epitope specific T cells derived from stem cell grafts can be administered safely for prevention and preemptive treatment of reactivation without evidence for induction of acute graft versus host disease.

Clinical trial registration: https://clinicaltrials.gov, identifier NCT02227641.

Keywords: Epstein-Barr virus EBV; allogeneic; cytomegalovirus CMV; epitope specificity; prevention; reactivation; stem cell transplantation (SCT).


Conflict of interest statement

The authors declare that the research was conducted in the absence of any commercial or financial relationships that could be construed as a potential conflict of interest. The author(s) declared that they were an editorial board member of Frontiers, at the time of submission. This had no impact on the peer review process and the final decision.

Figures

Figure 1
Figure 1
Prevalence of required HLA class I loci among patients screened. Peptides chosen for stimulation required the presence of distinct HLA class I loci. (A) The map displays the combination of the 6 different loci and the frequency of each locus (B) among the study participant screened. 11 out of 33 patients only had a single HLA class I locus. (C) The chart shows the percentage of patients according to the number of HLA matches.
Figure 2
Figure 2
Manufacturing of the T cell product. (A) Total number of all leukocytes (CD45+) during the manufacturing process. Raw material indicates the PBMC fraction derived from the stem cell graft. Post Thaw indicates the number after the first cryopreservation process. Day 0 indicates before peptide stimulation and Day 9 indicates the time of cell harvest before final cryopreservation. (B) Total number of CD3+ T cells during the manufacturing process. (C) Viabilities of CD45+ cells during the manufacturing process in percent. (D) Viabilities of CD3+ T cells during the manufacturing process in percent. (E) Composition of the T cell product: unstimulated (Day 0), peptide stimulated (Day 9) and after cryopreservation (Post Thaw) which is equivalent to the composition of the final product infused. Numbers (A–E) are shown as average ± standard deviation. The percentage of CMV- (F) and EBV- (G) specific T cells within the CD8+ T-cell fraction was significantly increased during the 9 days of expansion (Day 0 vs. Day 9) and percentage of specific T cells was not affected by cryopreservation (Day 9 vs. Post Thaw, Mann-Whitney-U test).
Figure 3
Figure 3
Application of the T cell product. (A) Average number of cells/kg bodyweight transfused with each dose. Data are shown as means for all products applied ± standard deviation. The active substance of the T cell product was peptide-stimulated CD3+ cells. The targeted dose was 50,000 CD3+ cells/kg bodyweight/dose. There were only small fractions of contaminations with NK cells (CD56+, 763 ± 812/kg bodyweight/dose) and B cells (CD19+, 1257 ± 2760/kg bodyweight/dose). (B) Average total number of CD3+ T cells infused with each dose and average total number of CD3+ T cells infused per patient. Data are shown as means ± standard deviation. (C) Three doses were planned throughout the study targeting day 30, day 60 and day 90. The table shows the actual application days for each patient. (D) Schematic illustration of the application days for each patient and their deviation from the actual schedule. As indicated in (C, D) patient 19 and 23 received only 2 doses.
Figure 4
Figure 4
Outcomes. Database was closed on Dec 31st 2020 with a median follow up of 930 days. (A) Kaplan-Meier estimates of overall survival of patients in both groups. (B) Cumulative incidence of transplant related mortality during the entire observation period. (C) Cumulative incidence of Relapse. Cumulative incidence of acute GvHD (all grades, (D)) and grade II-IV (E) requiring treatment during the study observation period of 204 days. There was no statistically significant difference between the groups for all outcomes shown.
Figure 5
Figure 5
Reactivation of CMV and EBV. (A) Cumulative incidence of CMV reactivation among patients. The dashed line in both graphs shows the targeted day of first T cell product infusion (day 30), the dotted line shows the average day of the first infusion (day 49) among the 9 patients. Nine out of 14 patients reactivated CMV within the control arm during the observation period of 204 days, and 4 out of 9 patients in the treatment arm respectively. (B) Cumulative incidence of EBV reactivation among patients. Six out of 14 patients reactivated EBV during the observation period, and 7 out of 9 in the treatment arm. The dashed line indicates the targeted day of first infusion, while the dotted line indicates the average day of the first infusion (49).
Figure 6
Figure 6
T cell reconstitution during study treatment. Patients (n=9) randomized into treatment group (red line) were analyzed at the time of the visit before the T cell transfer (24-48h, visits 2, 8, and 12). Patients in the control arm (n=13, black line) were analyzed at study visits aligned as possible with the treatment group at day 30 ± 3 (visit 2), 60 ± 3 (visit 8), 90 ± 3 (visit 8), and at the end of study at approximately day 204 ± 7 (visit 17). The graph shows average numbers of CD4+ (A) and CD8+ (B) T cells per ul peripheral blood ± standard deviation. Statistical differences between both groups were calculated for each time point using a non-parametric Mann-Whitney-U test.
Figure 7
Figure 7
Reconstitution of CMV/EBV specific T cell immunity in treated individuals. Left Panel: Reconstitution of CMV- and EBV-specific T cells during the study observation period. Red lines indicate the sum of all CMV specific in the peripheral blood (cells/ul), yellow lines the sum of all EBV-specific CD8+ T cells detected by using peptide-loaded HLA class I multimers according to the HLA class I loci present in the patient on the top right of each graph. Black arrows indicate the transfusion of the IMP. Red and yellow horizontal bars indicate the presence of CMV and EBV respectively as assessed by PCR in the peripheral blood. Right Panel shows the overall reconstitution (number of cells/ul peripheral blood) of CD4+ (light blue line) and CD8+ (dark blue line) T cells in each individual patient.

References

    1. Huntjens DW, Dijkstra JA, Verwiel LN, Slijkhuis M, Elbers P, Welkers MRA, et al. Optimizing antiviral dosing for HSV and CMV treatment in immunocompromised patients. Pharmaceutics (2023) 15(1). doi: 10.3390/pharmaceutics15010163 - DOI - PMC - PubMed
    1. Atallah-Yunes SA, Salman O, Robertson MJ. Post-transplant lymphoproliferative disorder: Update on treatment and novel therapies. Br J Haematol (2023) 201:283–395. doi: 10.1111/bjh.18763 - DOI - PubMed
    1. Tangye SG, Palendira U, Edwards ES. Human immunity against EBV-lessons from the clinic. J Exp Med (2017) 214(2):269–83. doi: 10.1084/jem.20161846 - DOI - PMC - PubMed
    1. Eiz-Vesper B, Ravens S, Maecker-Kolhoff B. alphabeta and gammadelta T-cell responses to Epstein-Barr Virus: insights in immunocompetence, immune failure and therapeutic augmentation in transplant patients. Curr Opin Immunol (2023) 82:102305. doi: 10.1016/j.coi.2023.102305 - DOI - PubMed
    1. Hislop AD, Taylor GS, Sauce D, Rickinson AB. Cellular responses to viral infection in humans: lessons from Epstein-Barr virus. Annu Rev Immunol (2007) 25:587–617. doi: 10.1146/annurev.immunol.25.022106.141553 - DOI - PubMed

Publication types

MeSH terms

Associated data