. 2023 Oct 14;2(11):pgad335.
doi: 10.1093/pnasnexus/pgad335. eCollection 2023 Nov.

Arrhythmia-associated calmodulin variants interact with KCNQ1 to confer aberrant membrane trafficking and function

Affiliations

Arrhythmia-associated calmodulin variants interact with KCNQ1 to confer aberrant membrane trafficking and function

Po Wei Kang et al. PNAS Nexus. .

Abstract

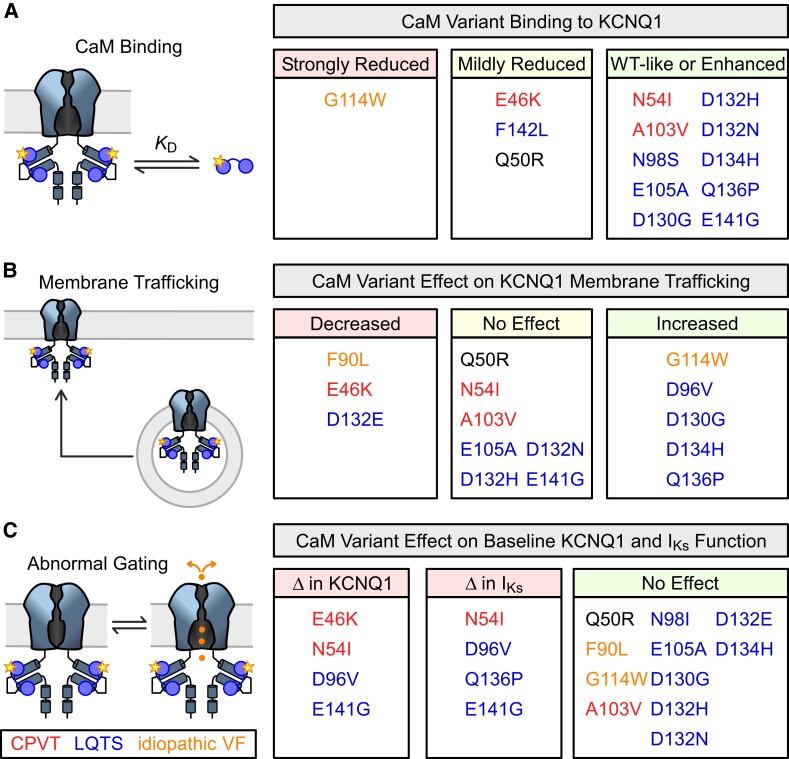
Missense variants in calmodulin (CaM) predispose patients to arrhythmias associated with high mortality rates ("calmodulinopathy"). As CaM regulates many key cardiac ion channels, an understanding of disease mechanism associated with CaM variant arrhythmias requires elucidating individual CaM variant effects on distinct channels. One key CaM regulatory target is the KCNQ1 (KV7.1) voltage-gated potassium channel that carries the IKs current. Yet, relatively little is known as to how CaM variants interact with KCNQ1 or affect its function. Here, we take a multipronged approach employing a live-cell fluorescence resonance energy transfer binding assay, fluorescence trafficking assay, and functional electrophysiology to characterize >10 arrhythmia-associated CaM variants for effect on KCNQ1 CaM binding, membrane trafficking, and channel function. We identify one variant (G114W) that exhibits severely weakened binding to KCNQ1 but find that most other CaM variants interact with similar binding affinity to KCNQ1 when compared with CaM wild-type over physiological Ca2+ ranges. We further identify several CaM variants that affect KCNQ1 and IKs membrane trafficking and/or baseline current activation kinetics, thereby delineating KCNQ1 dysfunction in calmodulinopathy. Lastly, we identify CaM variants with no effect on KCNQ1 function. This study provides extensive functional data that reveal how CaM variants contribute to creating a proarrhythmic substrate by causing abnormal KCNQ1 membrane trafficking and current conduction. We find that CaM variant regulation of KCNQ1 is not uniform with effects varying from benign to significant loss of function, suggesting how CaM variants predispose patients to arrhythmia via the dysregulation of multiple cardiac ion channels. Classification: Biological, Health, and Medical Sciences, Physiology.

Keywords: KCNQ1; KV7.1; arrhythmia; calmodulin; calmodulinopathy; ion channels.


Figures

Fig. 1.
Fig. 1.
A FRET-based live-cell assay to probe CaM interaction with full-length KCNQ1. A) KCNQ1 topology and CaM interacting regions. CaM binds HA and HB within the C-terminus domain (CTD) of KCNQ1. VSD is voltage-sensing domain. The sequence for KCNQ1 HA is shown, with the key CaM-interacting “IQ” residues bolded. B) Cryo-EM structural depiction (PDB: 6UZZ) of the human KCNQ1–CaM complex with red spheres indicating positions with known CaM variants. Two yellow spheres on the right side of the CaM structure are calcium ions. C) Sequence of CaM. Each EF hand (colored highlights) can coordinate one Ca2+ ion. Red residues correspond to positions with known CaM variants. D) Cartoon illustration of the KCNQ1-VenHAB and CaM-Cerulean FRET pair. The Venus insertion site is shown. E) FRET workflow to detect CaM interaction with full-length KCNQ1 in live cells. F) Fitted FRET binding curves of Cerulean-tagged CaM with KCNQ1-VenHAB-WT (blue [top trace], n = 1768) and KCNQ1-VenHAB-IQ/AA (red [bottom], n = 217). Each dot is one cell. For WT, best-fit EMax = 0.317 and KD,Eff = 30.2 AU with 95% CI = (23.9, 36.7). For IQ/AA, no fitting was performed because of the lack of rise in FRET signal.
Fig. 2.
Fig. 2.
Arrhythmia-associated CaM variants binding to full-length KCNQ1 in live cells. A) FRET binding curves measured between KCNQ1-VenHAB and Cerulean-tagged CaM variants as labeled under resting Ca2+ conditions. Each dot is one cell. Dotted blue lines are the FRET binding curves with EMax normalized to the same level as WT for KD,Eff comparison. Top, middle, and bottom plots illustrate variants exhibiting decreased, increased, and similar binding affinity to KCNQ1-VenHAB, respectively. Afree corresponds to estimated free concentration of KCNQ1-VenHAB. n = 708 (E46K), 291 (G114W), 244 (D130G), 623 (N54I), and 686 (A103V). B) Format as in A but showing FRET binding curves measured under elevated Ca2+ conditions. n = 292 (G114W) and 622 (A103V). C and D) Bar plot summary for fitted KD,Eff between KCNQ1-VenHAB and the indicated CaM variant under resting or elevated Ca2+ conditions. Colored (red and blue) bars indicate CaM variants with significantly different KD,Eff compared with WT. Error bars are 95% CI. Orange dotted lines denote 95% CI for WT. See Tables S1 and S2 for all fitted binding curve parameters.
Fig. 3.
Fig. 3.
Effect of CaM variants on KCNQ1 membrane trafficking. A) Cartoon illustration of KCNQ1 construct used for membrane trafficking assay (KCNQ1-psWT-HA-Cer). Cerulean fluorophore and HA tag were inserted into KCNQ1 as diagrammed. Total KCNQ1 expressed within the cell correlates with Cerulean signal, while membrane-trafficked KCNQ1 was estimated with Alexa-594 signal. An apparent trafficking efficiency for each cell was derived by dividing the Alexa-594 signal to that of Cerulean on confocal microscopy. B) Confocal microscopy images of KCNQ1-psWT-HA-Cer coexpressed with CaM; left cyan and right red images show Cerulean and Alexa-594 signals, respectively. KCNQ1-psWT-Cer is a construct with a Cerulean fused to the carboxy-terminus but no HA tag in the S1-S2 linker. C) Summary data for apparent trafficking efficiency for KCNQ1 coexpressed with different CaM variants. Each dot indicates the mean and error bars represent 95% CI. Dashed lines denote 95% CI for WT control. n indicates number of cells analyzed for the corresponding CaM variant. Green (right side) and red (left side) denote statistically significant increased and decreased membrane trafficking when compared with WT control, respectively. Statistical significance calculated with one-way ANOVA followed by Dunnett's test. See Table S3 for all parameters.
Fig. 4.
Fig. 4.
Arrhythmia-associated CaM variants effect on baseline KCNQ1 steady-state activation and activation kinetics. A) Exemplar currents recorded from KCNQ1 WT coexpressed with either CaM WT or CaM variants. B) Summary half-activation voltage (V1/2) of the GV curves for KCNQ1 when coexpressed with various CaM variants. C) Exemplar biexponential fitting for KCNQ1 activation kinetics. D and E) Summary bar plots for fitted fast and slow time constants for KCNQ1 coexpressed with CaM variants when tested at 20 mV. F) Biexponential fitting parameters for KCNQ1 WT coexpressed with CaM WT, E46K, and G114W as a function of voltage. All error bars are SEM.
Fig. 5.
Fig. 5.
Arrhythmia-associated CaM variants effect on IKs (KCNQ1 + KCNE1) steady-state activation and activation kinetics. A) Exemplar IKs recordings from Xenopus oocytes when coexpressed with CaM WT, E141G, or G114W. B) Summary activation V1/2 fitted in GV curves for IKs coexpressed with CaM variants. Statistical significance determined by one-way ANOVA and Dunnett's test. C) Exemplar activation kinetics fitting for IKs coexpressed with CaM variants when depolarized to 30 mV. Currents were fitted to the equation I(t) = A·exp(−(ttLag)/τ), with points prior to tLag excluded from the fitting procedure. Plotted ionic currents were normalized to the fitted A for comparison. Vertical scale bars show 25% of normalized current. Left panel: gray and black represent normalized ionic current for IKs coexpressed with CaM WT and E141G, respectively. Right panel: black and green indicate normalized ionic current and kinetics fit for IKs coexpressed with CaM E141G. Red line shows identical WT fit seen in the left panel. D) Fitted activation time constant for IKs coexpressed with CaM WT, N54I, G114W, and E141G as a function of step voltage from 30 to 100 mV. Error bars are SEM. E) Summary of fitted activation time constant for IKs coexpressed with CaM WT or variants when depolarized to 30 mV. Significance was determined by one-way ANOVA followed by Dunnett's test.
Fig. 6.
Fig. 6.
Summary of the effect of CaM variants on KCNQ1. Classification of CaM variants effect on (A) KCNQ1 binding, (B) KCNQ1 membrane trafficking, and (C) KCNQ1 function. Variants are color-coded by associated arrhythmia: CPVT, red (E46K, N54I, A103V); LQTS, blue (N98S, E105A, D130G, D132H, D132N, D134H, Q136P, E141G, F142L); idiopathic ventricular fibrillation, orange (F90L, G114W); none, black (Q50R).

Update of

References

    1. Ben-Johny M, Yue DT. 2014. Calmodulin regulation (calmodulation) of voltage-gated calcium channels. J gen Physiol. 143(6):679–692. - PMC - PubMed
    1. Meissner G. 2017. The structural basis of ryanodine receptor ion channel function. J Gen Physiol. 149(12):1065–1089. - PMC - PubMed
    1. Sorensen AB, Søndergaard MT, Overgaard MT. 2013. Calmodulin in a heartbeat. FEBS J. 280(21):5511–5532. - PubMed
    1. Van Petegem F. 2012. Ryanodine receptors: structure and function. J Biol Chem. 287(38):31624–31632. - PMC - PubMed
    1. Shamgar L, et al. 2006. Calmodulin is essential for cardiac IKS channel gating and assembly: impaired function in long-QT mutations. Circ Res. 98(8):1055–1063. - PubMed