. 2023 Oct 26:11:1298486.
doi: 10.3389/fcell.2023.1298486. eCollection 2023.

Unravelling the functional development of vertebrate pathways controlling gaze

Affiliations

Unravelling the functional development of vertebrate pathways controlling gaze

Marta Barandela et al. Front Cell Dev Biol. .

Abstract

Animals constantly redirect their gaze away or towards relevant targets and, besides these goal-oriented responses, stabilizing movements clamp the visual scene avoiding image blurring. The vestibulo-ocular (VOR) and the optokinetic reflexes are the main contributors to gaze stabilization, whereas the optic tectum integrates multisensory information and generates orienting/evasive gaze movements in all vertebrates. Lampreys show a unique stepwise development of the visual system whose understanding provides important insights into the evolution and development of vertebrate vision. Although the developmental emergence of the visual components, and the retinofugal pathways have been described, the functional development of the visual system and the development of the downstream pathways controlling gaze are still unknown. Here, we show that VOR followed by light-evoked eye movements are the first to appear already in larvae, despite their burrowed lifestyle. However, the circuits controlling goal-oriented responses emerge later, in larvae in non-parasitic lampreys but during late metamorphosis in parasitic lampreys. The appearance of stabilizing responses earlier than goal-oriented in the lamprey development shows a stepwise transition from simpler to more complex visual systems, offering a unique opportunity to isolate the functioning of their underlying circuits.

Keywords: eye movements; goal-oriented movements; lamprey; optic tectum; optokinetic reflex; pretectum; vestibulo-ocular reflex; visual system.


Conflict of interest statement

The authors declare that the research was conducted in the absence of any commercial or financial relationships that could be construed as a potential conflict of interest.

Figures
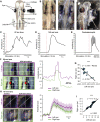
FIGURE 1
FIGURE 1
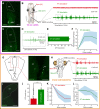
Lamprey larvae exhibit eye movements. (A) Schematic showing the preparation used to monitor eye movements. (B) Preparations of 58 (Bi) and 161 (Bii) mm long larvae showing eye development in relation to body size. A preparation of an adult animal is shown in Biii. (C–E) Traces representing the eye position in response to a four pulses stimulation (10 Hz) of the anterior octavomotor nucleus (AON) in a 67 (C) and a 145 (D) mm larva, and a postmetamorphic (E) lamprey. The red dotted line indicates when the first pulse was applied. (F) Right: Traces showing the position of the right (green) and left (purple) eyes in response to a four pulses 10 Hz AON stimulation in a 68 mm larva, showing coordinated movements. Note that the trajectory of the right eye is inverted to better reflect the coordination between both eyes (see also Movie 3). Left: Frames showing the position of the eyes (top, left eye; bottom, right eye) before (left) and after (right) AON stimulation. (G) Graph showing the correlation between the movements of both eyes of the 68 mm larva shown in (F), indicating their coordination after AON stimulation. (H) Right: Traces showing the position of the right (green) and left (purple) eyes in response to a four pulses 10 Hz AON stimulation in a 161 mm larva. Data are shown as mean ± s.d. Left: Frames showing the position of the eyes (top, left eye; bottom, right eye) before (left) and after (right) AON stimulation. (I) Graph showing the correlation between the right and left eye movements of the 161 mm larva shown in (H). Abbreviations: nIV Trochlear Motor Nucleus. Scale bar = 300 µm in (Bi-iii).
FIGURE 2
FIGURE 2
Lamprey larvae exhibit VOR. (A) Schematic showing the preparation used to monitor eye movements in response to labyrinth mechanical stimulation. (B) Eye of a 67 mm larva before (left) and after (right) vestibular stimulation. (C) Graph showing the eye movement of the same larva after labyrinth stimulation. The shaded area indicates the duration of the vestibular stimulation. (D) Schematic dorsal view of a larval brain showing the location of the tracer injection site (Anterior octavomotor nucleus, AON) and its anterograde projections (blue line) reaching the contralateral oculomotor nucleus (nIII). (E–I) The level of the drawings shown in (F) and (I) (left) corresponds to the blue rectangle in (D) and the dotted rectangle in both drawings indicates the location of the photomicrographs at the level of the contralateral nIII showing axons anterogradely labeled from the AON in a 67 (E) and a 161 (G) mm larva and a postmetamorphic animal [(I) right]. (H) Representative injection site in the AON of a 67 mm larva. (J) Left: Frames showing eye position (top, left eye; bottom, right eye) before (left) and after (right) vestibular stimulation. Right: Traces showing the position of the right (green) and left (purple) eyes in response to labyrinth stimulation in a 161 mm larva. The blue shaded area denotes the duration of the vestibular stimulation. (K) Graph showing the correlation between the movements of both eyes. Data are shown as mean ± s.d. Abbreviations: OT Optic Tectum, PT Pretectum. Scale bar = 100 µm in (E) and (H); 50 µm in (G) and (I).
FIGURE 3
FIGURE 3
Light-evoked responses. (A) Left: Eye of a 118 mm larva before (left) and after (right) a four pulses electric stimulation of the pretectum (PT; 10 Hz). Right: Graph showing the eye movement in response to the stimulation. In (B) the eye movement is shown in response to optic tectum (OT; 10 Hz) stimulation. The red dotted line in (A) and (B) indicates when the first pulse was applied. (C) Representative frames (left) showing the eye position before and after light stimulation for the eye movement shown in the graph (right). The shadowed area indicates light stimulation to both eyes. (D) Representative traces showing extracellular activity in the middle rhombencephalic reticulospinal nucleus (MRRN) of a 161 mm larva in response to a 10 s (top trace) and to a 50 s (bottom trace) light stimulation presented to one eye (see schematic). The shadowed area denotes the duration of the stimulation, whereas the red asterisk signals the short latency evoked responses.
FIGURE 4
FIGURE 4
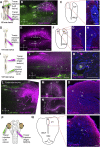
Tectal and pretectal motor outputs in larvae/early metamorphic. The colored rectangles group results belonging to the developmental stage indicated under the schematic of the experimental preparation (magenta: 153 mm larva; orange: stage 2 metamorphic). (A) Photomicrograph showing the lack of retrogradely labeled neurons in the pretectum (PT, indicated by a dashed line) after a dextran injection in the middle rhombencephalic reticulospinal nucleus (MRRN) of a 153 mm larva. Retrogradely labeled neurons can be seen in the nucleus of the medial longitudinal fasciculus (nMLF; arrows). (B) Schematic showing the preparation used to record neuronal activity in the MRRN of the same larva (left). PT stimulation did not evoke activity in the MRRN (right, red trace), whereas optic tectum (OT) stimulation resulted in extracellular activity (right, green trace). (C) No retrogradely labeled neurons were observed in the OT after a dextran injection in the MRRN (surrounded by a dashed line). (D) Magnified view of the region indicated by a dashed line square in the trace shown in (B) indicating the onset of the evoked response (vertical dashed green line). (E) Plot showing the average onset times of the responses evoked in the MRRN after OT stimulation. (F) Mean responses in the MRRN in response to 4 pulses OT stimulation (10 Hz), combining data of 5 larvae from 65 to 161 mm. (G) Schematic (left) indicating the location of the photomicrograph (right) showing bilateral retrogradely labeled MRRN projecting neurons in the periventricular aspect of the PT in a stage 2 metamorphic lamprey (arrows). (H) Left, schematic showing the preparation used to record extracellular activity in the MRRN (right) in response to PT (red trace) and OT (green trace) stimulation. Vertical dashed lines indicate the onset of the evoked responses. (I) Photomicrograph showing the lack of retrogradely labeled neurons in the OT after tracer injection in the MRRN. (J) Graph showing the difference between response onsets in the MRRN after PT (red) and OT (green) stimulation. (K,L) Graphs showing the mean MRRN activity in a stage 2 animal evoked by PT (K) and OT (L) stimulation. Values are normalized to the first local field potential (LFP). Stimulation artifacts were removed for clarity. Data are shown as mean ± s.d. Abbreviations: pc Posterior commissure, SNc Substantia Nigra pars compacta, TS Torus Semicircularis. Scale bar = 100 µm in (A), (C), (G) and (I).
FIGURE 5
FIGURE 5
Tectal and pretectal projections to the MRRN in metamorphic and postmetamorphic lampreys. The colored rectangles group results belonging to the developmental stage indicated under the schematic of the experimental preparation (blue: stage 5 metamorphic; green: stage 7 metamorphic/postmetamorphic). (A) Schematic (left) indicating the location of the photomicrograph (right) showing retrogradely labeled neurons in the pretectum (PT) of a stage 5 metamorphic lamprey after a Neurobiotin injection in the middle rhombencephalic reticulospinal nucleus (MRRN). Projection neurons can be observed both in the periventricular region (dashed line oval), and in lateral aspects (arrows). (B) Extracellular responses in the MRRN after PT (red trace) and optic tectum (OT, green trace) stimulation. The onset of the extracellular activity is indicated by a dashed red line for PT stimulation, and a dashed green line for OT stimulation. (C) Photomicrograph showing that no retrogradely labeled neurons can be seen in the OT (dashed area) of a stage 5 metamorphic lamprey after Neurobiotin injection in the MRRN. (D) Graph showing that the onsets of MRRN responses evoked by PT stimulation (red) were significantly shorter than those evoked by OT stimulation (green). (E, F) Graphs showing the mean responses evoked in the MRRN of a stage 5 metamorphic animal evoked by PT (E) and OT (F) stimulation in response to 4 pulses (10 Hz). Values are normalized to the first local field potential (LFP). (G) Schematic (left) indicating the location of the photomicrograph (right) showing a few retrogradely labeled neurons from the MRRN (arrows) in the OT of a late metamorphic animal. (H) Extracellular responses in the MRRN of a late metamorphic animal in response to OT stimulation (4 pulses, 10 Hz). A two-components response can be observed: a fast onset weak response (indicated by a dashed line rectangle) followed by a stronger signal. In the electrophysiological traces, stimulation artifacts were removed for clarity. Data are shown as mean ± s.d. Abbreviations: nMLF Nucleus of the Medial Longitudinal Fasciculus, pc Posterior commissure, SNc Substantia Nigra pars compacta, TS Torus Semicircularis, nIII Oculomotor Nucleus, M5 Retinopetal Nucleus of Schöber. Scale bar = 100 µm in (A, G); 200 µm in (C).
FIGURE 6
FIGURE 6
Tectal and pretectal projections to the MRRN in non-parasitic lampreys. (A) Schematic indicating the location of the tracer injections sites in the left retina and the right middle rhombencephalic reticulospinal nucleus (MRRN). (B) Whole-brain confocal image showing dual labeling of the optic nerve fibers (green) and MRRN projecting tectal neurons (magenta) in a 62 mm larva, dorsal view. The optic nerve predominantly projects to the pretectum (PT) via the pretectal tract (tPT). The optic tectum (OT) contains retrogradely labeled neurons in its rostrocaudal extent (arrows). (C) Schematic (left) indicating the location of the photomicrograph (right) at the level depicted in B showing a retrogradely labeled neuron in the OT of a 62 mm larva. The labeled neuron is not in the superficial (SL) but in the deep periventricular (DL, arrow) layer. (D) Schematic indicating the location of the tracer injection site in the MRRN. (E) Whole-brain confocal image showing MRRN-projecting tectal neurons (magenta) in a 141 mm larva, dorsal view (arrows). (F–H) Schematic and photomicrographs at the levels depicted in (E) showing retrogradely labeled neurons in the left (G) and right (H) DL of the OT in a 141 mm larva (arrows). The location of the photomicrographs in (G) and (H) is shown in the schematic in (F). (I) Schematic indicating the location of the tracer injection sites in the right OT and the spinal cord (SC). (J) Whole-brain confocal image showing dual labeling of retrogradely labeled SC-projecting cells (green) and anterogradely labeled tectal fibers (magenta) in a 137 mm larva, dorsal view. Numerous MRRN-projecting tectal fibers are observed (arrows). (K) Photomicrograph showing anterogradely labeled tectal terminals on a large Müller neuron (Mü) in the MRRN region. (L) Whole-brain confocal image showing dual labeling of the optic nerve fibers (green) and MRRN-projecting tectal neurons (magenta) in postmetamorphic animals, dorsal view. In addition to tPT, the tectal tract (tOT) of the optic nerve is observed. Some contralateral MRRN-projecting tectal neurons are also distinguished (arrows). (M, N) Region-specific images for the right (M) and left (N) OT, generated by different Z-stack projections to visualize ipsilateral MRRN-projecting tectal neurons and contralateral MRRN-projecting pretectal neurons, respectively. (O) Photomicrograph at the level depicted in (M) showing retrogradely labeled neurons from MRRN in the DL (arrows) of the ipsilateral OT. (P) Schematic indicating the location of the tracer injection sites in the left retina and the right MRRN. (Q) Schematic (left) indicating the location of the photomicrograph (right) at the level depicted in (N), showing retrogradely labeled neurons from MRRN in the contralateral PT (arrows) in postmetamorphic animals. Abbreviations: A Anterior, L left, pc Posterior Commisure, nMLF Nucleus of the Medial Longitudinal Fasciculus, P posterior, R right, SNc Substantia Nigra pars compacta. Scale bars = 100 µm in (B), (E), (J), (L), (M), and (N); 50 µm in (C), (G), (H), (K), (O), and (Q).
FIGURE 7
FIGURE 7
The nMLF mediates tectal responses in larvae and metamorphic lampreys. (A) Schematic (left) indicating the location of the photomicrograph (right) showing bilateral retrogradely labeled neurons in the nucleus of the medial longitudinal fasciculus (nMLF) of a 145 mm larva after tracer injection in the middle rhombencephalic reticulospinal nucleus (MRRN). (B) Schematic (left) indicating the location of the photomicrograph (right) showing MRRN projecting neurons in the nMLF of a postmetamorphic animal. (C) The polysynaptic responses evoked in the MRRN after optic tectum stimulation (OT; black trace) are drastically reduced after lesioning the nMLF in a stage 7/recent postmetamorphic (red trace). Stimulation artifacts were removed for clarity. (D) Graph showing the significant reduction in MRRN activity in response to OT stimulation after lesioning the nMLF. Abbreviations: Hb Habenula, Th Dorsal Thalamus. Scale bars = 100 µm in (A) and (B).
FIGURE 8
FIGURE 8
Development of gaze-controlling circuits in lampreys. Schematic showing the appearance stage of the main subcortical pathways mediating gaze control during development. Pathways that develop during embryo-prolarval stage are indicated in green, those stablished in larvae in blue, those that appear at the beginning of metamorphosis in orange, and those that develop only in late metamorphosis are indicated in red. The red asterisks denote pathways that in non-parasitic lampreys start developing in larvae. Abbreviations: EOMn Extraocular Muscles Motor Nuclei; MRRN Middle Rhombencephalic Reticulospinal Nucleus, nMLF Nucleus of the Medial Longitudinal Fasciculus, OT Optic Tectum, PT Pretectum, RS Reticulospinal Neurons, SC Spinal Cord, VA Vestibular A.rea.

Similar articles

Cited by

References

    1. Barreiro-Iglesias A., Fernández-López B., Sobrido-Cameán D., Anadón R. (2017). Organization of alpha-transducin immunoreactive system in the brain and retina of larval and young adult Sea Lamprey (Petromyzon marinus), and their relationship with other neural systems. J. Comp. Neurol. 52517, 3683–3704. 10.1002/cne.24296 - DOI - PubMed
    1. Branoner F., Chagnaud B. P., Straka H. (2016). Ontogenetic development of vestibulo-ocular reflexes in Amphibians. Front. Neural Circuits 10, 91. 10.3389/fncir.2016.00091 - DOI - PMC - PubMed
    1. Capantini L., von Twickel A., Robertson B., Grillner S. (2017). The pretectal connectome in lamprey. J. Comp. Neurol. 525, 753–772. 10.1002/cne.24102 - DOI - PubMed
    1. Cornide-Petronio M. E., Barreiro-Iglesias A., Anadón R., Rodicio M. C. (2011). Retinotopy of visual projections to the optic tectum and pretectum in larval sea lamprey. Exp. Eye Res. 92, 274–281. 10.1016/j.exer.2011.01.011 - DOI - PubMed
    1. Dayton G. O. J., Jones M. H., Aiu P., Rawson R. A., Steele B., Rose M. (1964). Developmental study of coordinated eye movements in the human infant. I. Visual acuity in the newborn human: a study based on induced optokinetic nystagmus recorded by electro-oculography. Arch. Ophthalmol. 71, 865–870. 10.1001/archopht.1964.00970010881017 - DOI - PubMed

LinkOut - more resources