Trained immunity induced by high-salt diet impedes stroke recovery
- PMID: 37965920
- PMCID: PMC10702837
- DOI: 10.15252/embr.202357164
Trained immunity induced by high-salt diet impedes stroke recovery
Abstract
A high-salt diet (HSD) elicits sustained sterile inflammation and worsens tissue injury. However, how this occurs after stroke, a leading cause of morbidity and mortality, remains unknown. Here, we report that HSD impairs long-term brain recovery after intracerebral hemorrhage, a severe form of stroke, despite salt withdrawal prior to the injury. Mechanistically, HSD induces innate immune priming and training in hematopoietic stem and progenitor cells (HSPCs) by downregulation of NR4a family and mitochondrial oxidative phosphorylation. This training compromises alternative activation of monocyte-derived macrophages (MDMs) without altering the initial inflammatory responses of the stroke brain. Healthy mice transplanted with bone marrow from HSD-fed mice retain signatures of reduced MDM reparative functions, further confirming a persistent form of innate immune memory that originates in the bone marrow. Loss of NR4a1 in macrophages recapitulates HSD-induced negative impacts on stroke outcomes while gain of NR4a1 enables stroke recovery in HSD animals. Together, we provide the first evidence that links HSD-induced innate immune memory to the acquisition of persistent dysregulated inflammatory responses and unveils NR4a1 as a potential therapeutic target.
Keywords: high-salt diet; intracerebral hemorrhage; macrophages; nr4a1; trained immunity.
© 2023 The Authors. Published under the terms of the CC BY 4.0 license.
Conflict of interest statement
The authors declare that they have no conflict of interest.
Figures

Schematic of experimental design using a blood injection ICH model.
Cylinder test of ND (n = 15) and HSD (n = 13) mice on days 1, 3, and 7 following blood injection, two‐way ANOVA, and Bonferroni test. n: biological replicates.
Representative images and quantification of Ly76+ (red) hematoma co‐labeled with DAPI in ND and HSD brains (n = 5/group) on day 7 post‐ICH, Student's t‐test. n: biological replicates. Scale bar: 1 mm.
Schematic of experimental design using a collagenase injection ICH model.
Neurologic score, hindlimb abduction test, corner turn test, and cylinder test for ND and HSD mice on days 3, 7, 10, 14, and 21 following ICH (n = 11/group), two‐way ANOVA, and Bonferroni test. n: biological replicates.
Representative images and quantification of Ly76+ hematoma, NeuN+ neurons, and GFAP+ cells co‐labeled with DAPI in ND and HSD mice on day 21 post‐ICH. n = 10 for hematoma and GFAP quantification, n = 8 for NeuN quantification, Student's t‐test. n: biological replicates. Scale bar: 1 mm, 100 μm for high‐magnification insets.

Graphs depicting body weight, food intake, water intake, and sodium intake in ND (n = 22–33) and HSD (n = 24–35) mice over 8 weeks of diet manipulation. Two‐way ANOVA and Bonferroni test. n: biological replicates.
Graphs depicting heart rate, mean arterial pressure, systolic blood pressure, and diastolic blood pressure in ND and HSD animals over 8 weeks of diet manipulation. n = 7–11/group, two‐way ANOVA and Bonferroni test. n: biological replicates.
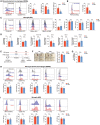
Left: representative histograms of CD36 and CD206 expression on monocytes (gray), HSD (blue), and ND (red) MDMs. Right: percentages of CD36+, CD206+, and CD36+CD206+ MDMs in ND (n = 9) and HSD (n = 8) mice, Student's t‐test. n: biological replicates.
Left: representative histogram shows intensity of fluorescently labeled erythrocytes in MDMs from ND and HSD mice at day 7 after ICH. Right: quantification of percentage of MDMs that contain labeled erythrocytes. n = 7/group, Student's t‐test. n: biological replicates.
Left: representative histograms of CD36, CD206, ARG1, and MerTK expression on naive (gray), HSD (blue), and ND (red) microglia. Right: percentages of CD36+, CD206+, ARG1+, and MerTK+ microglia in ND (n = 8–9) and HSD (n = 8) mice. Student's t‐test. n: biological replicates.
Gene expression of proinflammatory markers (Tnf, Tspo, and Tmem119), reparative phenotype (Apoe), and epigenetic regulation (Hdac1 and Hdac2) in microglia from ND (n = 4) and HSD (n = 3) ICH brains. Student's t‐test. n: biological replicates, each biological replicate pooled from three independent animals.
Schematic of investigating initial ICH injury following 8‐week ND or HSD. Histological assay and flow cytometry were performed 3 days after blood ICH induction.
Left: representative coronal sections show visible hematoma in the ND and HSD mice on day 3 after blood injection. Right: quantification of hematoma volume. n = 4/group, Student's t‐test. Scale bar: 5 mm. n: biological replicates.
Percentages of brain‐infiltrating MDMs from ND and HSD animals on day 3 post‐ICH. n = 4/group, Student's t‐test. n: biological replicates.
Top: representative histograms showing MHCII, CD86, TNF, IL‐1α, and IL‐6 expressions on monocytes (gray), HSD MDMs (blue), and ND MDMs (red). Bottom: quantifications showing percentages of MHCII+, CD86+, TNF+, IL‐1α+, and IL‐6+ MDMs between ND and HSD groups. n = 5‐7/group, Student's t‐test. n: biological replicates.
Top: representative histograms showing MHCII, CD86, TNF, IL‐1α, and IL‐6 expressions on HSD (blue) and ND microglia (red). Bottom: quantifications showing percentages of MHCII+, CD86+, TNF+, IL‐1α+, and IL‐6+ microglia (MG) between ND and HSD groups. n = 5‐7/group, Student's t‐test. n: biological replicates.

Schematic of experimental design.
Bar graphs depicting the percentages of CD36+ and CD206+ peritoneal macrophages from ND and HSD mice on days 0, 3, and 7 following thioglycollate injection. n = 4/group on day 0, n = 3 ND, 4 HSD on day 3, and n = 8/group on day 7, two‐way ANOVA and Bonferroni test. n: biological replicates.
Representative images showing engulfment of heat‐shocked PKH26‐labeled erythrocytes (red) in CD11b+ (green) ND and HSD peritoneal macrophages with or without thrombin stimulation. Quantifications of erythrophagocytosis in ND and HSD peritoneal macrophages with or without thrombin stimulation. n = 7/group, Student's t‐test. n: biological replicates. Scale bar: 50 μm and 5 μm high‐magnification insets.
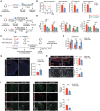
Schematic of experimental design.
OCR traces and quantifications of basal respiration, ATP production, and maximal respiration of BMDMs derived from ND (red) and HSD (blue) BM. n = 3/group, Student's t‐test. n: biological replicates, each averaged from n = 2–3 technical replicates.
Schematic of in vitro differentiation of ND and HSD BM cells into BMDMs under different sodium concentrations.
Gene expression of reparative markers Apoe, Arg1, and Trem2 in BMDMs derived from ND BM under normal sodium conditions (red), HSD BM under normal sodium conditions (blue), and ND BM under high‐sodium conditions (green) upon thrombin stimulation. n = 4/group, two‐way ANOVA and Bonferroni test. n: biological replicates.
Schematic of experimental design for ND➔ND and HSD➔ND BM chimeras.
Cylinder test of ND➔ND (n = 10) and HSD➔ND (n = 12) chimeras on days 3, 7, and 10 post‐ICH. Two‐way ANOVA and Bonferroni test. n: biological replicates.
Representative images and quantification of Ly76+ hematomas co‐labeled with DAPI in ND➔ND and HSD➔ND chimeras. n = 7/group, Student's t‐test. n: biological replicates. Scale bar: 500 μm.
Representative images and quantifications of NeuN+ neurons and GFAP+ cells co‐labeled with DAPI in ND➔ND and HSD➔ND chimeras. n = 9/group for NeuN, n = 6/group for GFAP, Student's t‐test. n: biological replicates. Scale bar: 100 μm and 50 μm for high‐magnification insets.
Representative images and quantifications of CD206+IBA1+ and MAC2+IBA1+ cells in ND➔ND and HSD➔ND chimeras. n = 7/group, Student's t‐test. n: biological replicates. Scale bar: 100 μm and 50 μm for high‐magnification insets.
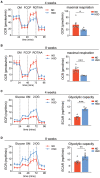
OCR traces and maximum respiratory capacity of BM cells after 4‐week ND and HSD. n = 9 ND, 6 HSD, Student's t‐test. n: biological replicates.
OCR traces and maximum respiratory capacity of BM cells after 8‐week ND and HSD. n = 9 ND, 6 HSD, Student's t‐test. n: biological replicates.
ECAR traces and glycolytic capacity of BM cells after 4‐week ND and HSD. n = 5/group, Student's t‐test. n: biological replicates.
ECAR traces and glycolytic capacity of BM cells after 8‐week ND and HSD. n = 8/group, Student's t‐test. n: biological replicates.

Schematic of the 4‐week diet regimen. Six‐week‐old mice were fed with ND or HSD for 4 weeks before being subjected to ICH surgery. Behavioral tests and flow cytometry were performed 1 week after blood ICH induction.
Cylinder test results of mice after 4‐week ND and HSD on days 1, 3, and 7 after ICH. n = 9 ND, 11 HSD, two‐way ANOVA and Bonferroni test. n: biological replicates.
Percentages of CD36+, CD206+, and CD36+CD206+ MDMs in 4‐week ND and HSD mice after ICH. n = 5/group, Student's t‐test. n: biological replicates.
Percentages of CD36+ or CD206+ microglia (MG) after 4‐week ND and HSD. n = 5/group, Student's t‐test. n: biological replicates.
Survival rates of ND and HSD chimeras that were subjected to a collagenase ICH model.
Cylinder test and forelimb placement test results of ND➔ND and HSD➔ND chimeras. n = 6 ND chimeras and 3 HSD chimeras on day 3, n = 4 ND chimeras and 2 HSD chimeras on day 10.
Schematic of experimental design. ND and HSD BM were transplanted into HSD recipients.
Cylinder test of ND➔HSD (n = 7) and HSD➔HSD (n = 8) chimeric mice on days 3, 7, and 10 post‐ICH. Two‐way ANOVA and Bonferroni test. n: biological replicates.
Representative images and quantification of Ly76+ hematomas co‐labeled with DAPI in ND➔HSD (n = 7) and HSD➔HSD (n = 8) chimeras. Student's t‐test. n: biological replicates. Scale bar: 500 μm.
Representative images and quantifications of NeuN+ neurons and GFAP+ cells co‐labeled with DAPI in ND➔HSD (n = 7) and HSD➔HSD (n = 8) chimeras. Student's t‐test. n: biological replicates. Scale bar: 100 μm.
Representative images and quantifications of CD206+IBA1+ and MAC2+IBA1+ cells in ND➔HSD (n = 8) and HSD➔HSD (n = 8) chimeras. Student's t‐test. n: biological replicates. Scale bar: 100 μm.
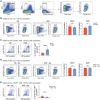
Gating strategy of HSPCs and GMPs.
Left: representative pseudocolor plots of HSPCs and GMPs from ND and HSD mice. Right: quantifications showing percentages of GMPs and HSPCs in ND and HSD mice, respectively. n = 4/group, Student's t‐test. n: biological replicates.
Left: representative pseudocolor plots of proinflammatory monocytes from blood samples of ND and HSD mice. Right: bar graph depicting percentages of proinflammatory monocytes in ND and HSD mice. n = 8/group, Student's t‐test. n: biological replicates.
Left: representative pseudocolor plots of HSPCs and GMPs from ND‐ND and HSD‐ND mice. Right: quantifications depicting percentages of GMPs and HSPCs in these two groups. n = 4/group, Student's t‐test. n: biological replicates.
Left: representative pseudocolor plots of proinflammatory monocytes from blood samples of ND‐ND and HSD‐ND mice. Right: bar graph depicting percentages of proinflammatory monocytes from these two groups. n = 4/group, Student's t‐test. n: biological replicates.
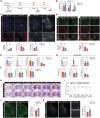
Schematic of diet reversal from HSD to ND.
Cylinder test of ND‐ND and HSD‐ND mice on days 1, 3, and 7 post‐ICH. n = 8/group, two‐way ANOVA and Bonferroni test. n: biological replicates.
Representative images and quantification of Ly76+ hematoma, NeuN+ neurons, and GFAP+ astrocytes co‐labeled with DAPI in ND‐ND and HSD‐ND mice. n = 8/group, Student's t‐test. n: biological replicates. Scale bar: 1 mm, 100 μm for high magnification, and 50 μm for high‐magnification insets.
Representative images and quantifications of CD206+IBA1+ (n = 6/group) and MAC2+ IBA1+cells (n = 7/group) in ND‐ND and HSD‐ND mice 7 days post‐ICH. Student's t‐test. n: biological replicates. Scale bar: 100 μm and 50 μm for high‐magnification insets.
Representative histograms of CD36 and CD206 expression on monocytes (gray), HSD‐ND (blue), and ND‐ND (red) MDMs at day 7 after ICH. Percentages of CD36+ and CD206+ MDMs in ND‐ND and HSD‐ND mice. n = 10/group, Student's t‐test. n: biological replicates.
Percentages of total infiltrating MDMs, CD86+ MDMs, and MHCII+ MDMs in ND‐ND and HSD‐ND mice. n = 10/group, Student's t‐test. n: biological replicates.
Representative histograms showing CD36 and CD206 expression on naive (gray), HSD‐ND (blue), and ND‐ND (red) microglia (MG). Percentages of CD36+, CD206+, CD86+, and MHCII+ MG in ND‐ND and HSD‐ND mice. n = 10/group, Student's t‐test. n: biological replicates.
Representative serial Nissl‐stained coronal sections of ND‐ND and HSD‐ND brains using the transient middle cerebral artery occlusion (tMCAO) ischemic stroke model. Scale bar: 1 mm.
Quantification of mean and total infarct volumes in ND‐ND (n = 5) and HSD‐ND (n = 6) mice. Student's t‐test. n: biological replicates.
Representative images of MAP2+ staining and quantification of the neuronal damage area in ND‐ND (n = 5) and HSD‐ND (n = 6) brains. Student's t‐test. n: biological replicates. Scale bar: 1 mm.
Representative images and quantification of GFAP+ cells in ND‐ND (n = 5) and HSD‐ND (n = 6) brains. Student's t‐test. n: biological replicates. Scale bar: 1 mm and 100 μm for high‐magnification insets.

Heatmap of differentially expressed genes (DEGs) determined by bulk sequencing of ND and HSD HSPCs (n = 3/group). Normalized Z‐scores (high, red; low, blue) were calculated for each DEG (row). n: biological replicates, each biological replicate pooled from three independent animals.
Principal component analysis (PCA) shows clear separation of the transcriptomes of HSD versus ND HSPCs.
Ingenuity pathway analysis (IPA) revealed enrichment of several pathways in HSD HSPCs, including glycolysis, cholesterol biosynthesis, NFAT‐mediated regulation of immune responses, inflammasome, and toll‐like receptor signaling.
Heatmap of DEGs involved in pathways related to inflammatory responses and cellular movement between ND HSPCs and HSD HSPCs.
Gene set enrichment analysis (GSEA) of genes related to glycolysis and fatty acid metabolism. NES, normalized enrichment score; FDR, false discovery rate.
Volcano plot showing the distribution of P‐values (−log10 P‐value) and their fold changes (log2 fold change). Significantly upregulated genes in HSD HSPCs are indicated in red and downregulated genes, in blue.
Venn diagram showing overlap of DEGs between HSD HSPCs and ND HSPCs with or without ICH. NR4a1 and NR4a3 were both downregulated in HSPCs from HSD mice with or without ICH induction.

Representative images and quantification of Ly76+ hematoma and NeuN+ cells in control (n = 5) and NR4a triple conditional knockout (NR4a TKO, n = 6) brains on day 7 post‐blood injection. Student's t‐test. n: biological replicates. Scale bar: 1 mm for Ly76+ hematoma and 100 μm for NeuN+ cells.
Representative images and quantification of MAC2 and ARG1 expression in IBA1+ cells in control (n = 5) and NR4a TKO (n = 7) mice. Student's t‐test. n: biological replicates. Scale bar: 100 μm and 50 μm for high‐magnification insets.
Cylinder test result of control (n = 8) and NR4a TKO mice (n = 11) on days 1, 3, and 7 post‐ICH. Two‐way ANOVA and Bonferroni test. n: biological replicates.
Left: schematic of in vitro differentiation of control and NR4a1 conditional knockout (NR4a1 cKO) BM cells into BMDMs. Right: quantification of gene expression of reparative markers Trem2, Arg1, and Retnla in BMDMs derived from control and NR4a1 cKO BMs upon IL‐4 stimulation. n = 4/group, Student's t‐test. n: biological replicates.
Representative histograms and quantifications of CD36+, ARG1+, CD206+, and HO‐1+ MDMs in control and NR4a1 cKO ICH mice. n = 6/group, Student's t‐test. n: biological replicates.
Representative images and quantification of hematoma in control and NR4a1 cKO ICH mice on day 7 post‐ICH. n = 6/group, Student's t‐test. n: biological replicates. Scale bar: 5 mm.
Cylinder test of control and NR4a1 cKO mice on days 1, 3, and 7 post‐ICH. n = 6/group, two‐way ANOVA and Bonferroni test. n: biological replicates.

Schematic of viral overexpression of NR4a1 in wild‐type BM cells and subsequent in vitro differentiation into BMDMs under different sodium conditions.
Gene expression of reparative markers Trem2 and Apoe in BMDMs transduced with control lentivirus and differentiated under normal sodium (lenti‐ctrl + NS), control lentivirus under high sodium (lenti‐ctrl + HS), and NR4a1‐overexpressing lentivirus under high sodium (lenti‐NR4a1 + HS). n = 5/group, one‐way ANOVA and Bonferroni test. n: biological replicates, each averaged from n = 2–3 technical replicates.
Left: representative images showing engulfment of heat‐shocked PKH26‐labeled erythrocytes (red) by CD11b+ (green) BMDMs transduced with control lentivirus and differentiated under normal sodium (lenti‐ctrl + NS), control lentivirus under high sodium (lenti‐ctrl + HS), and NR4a1‐overexpressing lentivirus under high sodium (lenti‐NR4a1 + HS). Scale bar: 50 μm. Right: quantifications of BMDM erythrophagocytosis. n = 5/group, one‐way ANOVA and Bonferroni test. n: biological replicates.
Schematic of celastrol treatment in HSD mice after a blood injection ICH.
Cylinder test of HSD mice that received either vehicle or celastrol treatment n = 10/group, two‐way ANOVA and Bonferroni. n: biological replicates.
Representative images and quantification of Ly76+ hematoma and NeuN+ cells co‐labeled with DAPI in mice receiving vehicle (n = 7) or celastrol (n = 8) treatment on day 7 post‐ICH. Student's t‐test. n: biological replicates. Scale bar: 1 mm for Ly76+ hematoma and 100 μm for NeuN+ cells.
Representative images and quantification of MAC2 expression in IBA1+ cells on day 7 post‐ICH in the perihematomal brain regions of mice receiving vehicle (n = 7) or celastrol (n = 8). Student's t‐test. n: biological replicates. Scale bar: 100 μm and 50 μm for high‐magnification insets.

Top: representative pseudocolor plots showing Ly6Chi and Ly6Clow monocytes in HSD mice that received vehicle or celastrol treatments. Bottom: quantifications showing percentages of Ly6Clow and Ly6Chi monocytes in vehicle and celastrol groups. n = 6/group, Student's t‐test. n: biological replicates.
Schematic of celastrol treatment in NR4a1 cKO mice and experimental design.
Representative images and quantification of brain hematoma in vehicle‐ and celastrol‐treated NR4a1 cKO mice on day 7 post‐ICH. n = 5/group, Student's t‐test. n: biological replicates. Scale bar: 5 mm.
Representative histograms and quantifications of ARG1+, CD36+, CD206+, and HO‐1+ MDMs in vehicle‐ and celastrol‐treated NR4a1 cKO ICH mice. n = 5/group, Student's t‐test. n: biological replicates.
References
-
- Askenase MH, Goods BA, Beatty HE, Steinschneider AF, Velazquez SE, Osherov A, Landreneau MJ, Carroll SL, Tran TB, Avram VS et al (2021) Longitudinal transcriptomics define the stages of myeloid activation in the living human brain after intracerebral hemorrhage. Sci Immunol 6: eabd6279 - PMC - PubMed
-
- Babu R, Bagley JH, Di C, Friedman AH, Adamson C (2012) Thrombin and hemin as central factors in the mechanisms of intracerebral hemorrhage‐induced secondary brain injury and as potential targets for intervention. Neurosurg Focus 32: E8 - PubMed
-
- Bekkering S, Arts RJW, Novakovic B, Kourtzelis I, van der Heijden C, Li Y, Popa CD, Ter Horst R, van Tuijl J, Netea‐Maier RT et al (2018) Metabolic induction of trained immunity through the mevalonate pathway. Cell 172: 135–146 - PubMed
Publication types
MeSH terms
Substances
Associated data
- Actions
Grants and funding
LinkOut - more resources
Full Text Sources
Medical
Molecular Biology Databases

