Review
. 2024 Jan;1531(1):29-48.
doi: 10.1111/nyas.15084. Epub 2023 Nov 15.

Multimodal investigations of emotional face processing and social trait judgment of faces

Affiliations
Review

Multimodal investigations of emotional face processing and social trait judgment of faces

Hongbo Yu et al. Ann N Y Acad Sci. 2024 Jan.

Abstract

Faces are among the most important visual stimuli that humans perceive in everyday life. While extensive literature has examined emotional processing and social evaluations of faces, most studies have examined either topic using unimodal approaches. In this review, we promote the use of multimodal cognitive neuroscience approaches to study these processes, using two lines of research as examples: ambiguity in facial expressions of emotion and social trait judgment of faces. In the first set of studies, we identified an event-related potential that signals emotion ambiguity using electroencephalography and we found convergent neural responses to emotion ambiguity using functional neuroimaging and single-neuron recordings. In the second set of studies, we discuss how different neuroimaging and personality-dimensional approaches together provide new insights into social trait judgments of faces. In both sets of studies, we provide an in-depth comparison between neurotypicals and people with autism spectrum disorder. We offer a computational account for the behavioral and neural markers of the different facial processing between the two groups. Finally, we suggest new practices for studying the emotional processing and social evaluations of faces. All data discussed in the case studies of this review are publicly available.

Keywords: amygdala; autism spectrum disorder; emotion; face processing; multimodal approaches; social trait judgment.


Conflict of interest statement

COMPETING INTERESTS

The authors declare no competing interests.

Figures
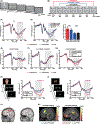
FIGURE 1
FIGURE 1
The late positive potential (LPP) is a physiological signature for perceptual ambiguity. (A, B) Sample task and stimuli to study facial emotion ambiguity. (A) A face is presented for 1 s followed by a question asking participants to identify the facial emotion (fearful or happy). After a blank screen of 500 ms, participants are then asked to indicate their confidence in their decision (“1” for “very sure,” “2” for “sure,” “3” for “unsure”). (B) Sample stimuli of one female identity ranging from 100% happy/0% fearful to 0% happy/100% fearful are shown on the right. Three ambiguity levels (unambiguous, intermediate, and high) are grouped as shown above the stimuli. (C) The LPP at the electrode Pz differentiates ambiguity levels. Gray shaded area denotes the LPP interval. The top magenta bars illustrate the points with significant difference across three ambiguity levels (one-way repeated-measure ANOVA, p < 0.05, corrected by FDR for Q < 0.05). (D) LPPs from trials with similar RTs are similar even for different ambiguity levels. Mean LPP amplitude for each condition is shown on the right (averaged across the entire LPP interval). Error bars denote one SEM across participants. n.s., not significant. (E) The LPP is abolished when participants freely view the faces without judging emotions (passive viewing). (F) The LPP is abolished when participants judge whether the stimulus is a human face or an animal, an unambiguous aspect of the stimuli. (G) The LPP is not only modulated by ambiguity levels, but also by the context of ambiguous stimuli. Specifically, the LPP for the same anchor (unambiguous) stimuli is enhanced when there are ambiguous stimuli presented in the same block (Block 2). Only unambiguous stimuli are shown in Block 1 and Block 3. (H) Face judgment task with anger-disgust morphed emotions. (I) Animal judgment task with cat-dog morphs. (J) Source localization of the LPP. Mean differential ERPs (unambiguous minus high ambiguity) are used to obtain the sources. Source locations are in standard Talairach space. Left: Sources estimated using a distributed model. The locations and intensities (color coding) of the regional sources are shown for a 40-ms time interval within the LPP time window (560–600 ms) for illustration. Right: Sources estimated using a discrete model. Five dipoles (four fixed and one free) were fitted for the time interval of 400–700 ms after stimulus onset. (K) fMRI results. Left: Increasing ambiguity is correlated with increasing BOLD activity in the bilateral IFG/anterior insula and dmPFC/dACC. Right: Decreasing ambiguity is correlated with increasing BOLD activity in the left vACC, PCC, dlPFC, IPL, and right postcentral gyrus. The generated statistical parametric map is superimposed on anatomical sections of the standardized MNI T1-weighted brain template. Figure adapted from Refs. and .
FIGURE 2
FIGURE 2
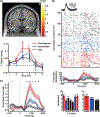
The human amygdala encodes facial emotion ambiguity. (A) fMRI result. Upper: Ambiguity levels were correlated with the BOLD activity in the right amygdala (functional ROI defined by localizer task). Lower: Time course of the BOLD response in the right amygdala (averaged across all voxels in the cluster) in units of TR (TR = 2 s) relative to face onset. Error bars denote one SEM across participants. One-way repeated ANOVA at each TR: *p < 0.05. (B) An example neuron that fires most to the anchors and least to the most ambiguous stimuli (linear regression: p < 0.05). Each raster (top), PSTH (middle), and average firing rate (bottom) is color coded according to ambiguity levels as indicated. Trials are aligned to face stimulus onset (left gray bar, fixed 1-s duration) and sorted by reaction time (black line). PSTH bin size is 250 ms. Shaded area and error bars denote ±SEM across trials. Asterisk indicates a significant difference between the conditions in that bin (p < 0.05, one-way ANOVA, Bonferroni-corrected). Bottom left shows the average firing rate for each morph level 250- to 1750-ms post-stimulus-onset. Bottom right shows the average firing rate for each ambiguity level 250- to 1750-ms post-stimulus-onset. Waveform for this unit is shown at the top of the raster plot. (C) Group average normalized firing rate of ambiguity-coding neurons that increased (n = 29) firing rate for the least ambiguous faces. Asterisk indicates a significant difference between the conditions in that bin (p < 0.05, one-way ANOVA, Bonferroni-corrected). Figure adapted from Ref. .
FIGURE 3
FIGURE 3
People with autism spectrum disorder (ASD) show a deficit when judging ambiguous facial expressions. (A) Group average of psychometric curves. The psychometric curves show the proportion of trials judged as fearful as a function of morph levels (ranging from 0% fearful [100% happy; on the left] to 100% fearful [0% happy; on the right]). Shaded area denotes ±SEM across participants. (B) Inflection point of the logistic function (xhalf). (C) Steepness of the psychometric curve (α). Error bars denote one SEM across participants. Asterisks indicate a significant difference using two-tailed two-sample t-test. **: p < 0.01. n.s., not significant (p > 0.05). (D) Time-frequency plots depicting the power of pupil oscillations for each group of participants. Black dashed line denotes stimulus onset (time = 0). (E) Mean power of pupil oscillation in the 3–12 Hz frequency range between 200 and 600 ms after stimulus onset. Error bars denote ±SEM across participants. Asterisk indicates a significant difference using two-tailed two-sample t-test. *: p < 0.05. Figure adapted from Refs. and .
FIGURE 4
FIGURE 4
Leveraging computational models to probe the neurobehavioral markers of face emotion recognition differences observed in ASD. (A) Quantification of image-by-image differences in behavior between ASD and neurotypicals. (B) ANN models of the primate ventral stream (typically comprising V1, V2, V4, and IT-like layers) can be trained to predict human facial emotion judgments. This involves building a regression model, that is, determining the weights w based on the model layer activations (as the predictor) to predict the image ground truth (“level of happiness”) on a set of training images, and then testing the predictions of this model on held-out images. (C). An ANN model’s predicted psychometric curves (e.g., AlexNet, shown here) show the proportion of trials judged as “happy” as a function of facial emotion morph levels ranging from 0% happy (100% fearful; left) to 100% happy (0% fearful; right). This curve demonstrates that activations of ANN layers (layer “fc7,” which corresponds to the “model-IT” layer) can be successfully trained to predict facial emotions. (D) ANN behavior better matches the behavior measured in neurotypicals compared to ASD. (E) IT-like layers of ANN best discriminate between behaviors of ASD and neurotypicals. (F) Ratio of ANN behavioral predictivity of noisy versus noise-free ANNs. At specific levels of noise, referred to as the “ASD-relevant noise levels,” the ANNs trained with noise show much higher predictivity for behavior measured in ASD while suffering a reduction in predictivity of the neurotypicals. Error bars denote bootstrapped confidence intervals (CIs). Figure adapted from Ref. .
FIGURE 5
FIGURE 5
A neuronal social trait space in the human brain. (A) Distribution of face images in the social trait space based on their consensus social trait ratings after dimension reduction using t-distributed stochastic neighbor embedding (t-SNE). (B) Correlation between dissimilarity matrices (DMs). The social trait DM (left matrix) was correlated with the neural response DM (right matrix). Color coding shows dissimilarity values (1−r). (C) Observed versus permuted correlation coefficient between DMs. The correspondence between DMs was assessed using permutation tests with 1000 runs. The magenta line indicates the observed correlation coefficient between DMs. The null distribution of correlation coefficients (shown in the gray histogram) was calculated by permutation tests of shuffling the face identities. (D) Example neurons that showed a significant correlation between the mean normalized firing rate and the mean z-scored rating for a social trait. Each dot represents a face identity, and the gray line denotes the linear fit. Sample face images with a range of consensus social trait ratings are illustrated below the correlation plots, and the corresponding consensus ratings (z-scored) are shown under each sample face image. (E) Encoding of each social trait. The bars show the average correlation coefficient across all face-responsive neurons for each social trait. Error bars denote ±SEM across neurons. Asterisks indicate a significant difference from 0 (two-tailed paired t-test). *p < 0.05; **p < 0.01; and ***p < 0.001. (F) Decoding of each social trait using a linear decoding model on face identities. Model predictability was assessed using the Pearson correlation between the predicted and actual trait ratings in the test dataset. The magenta bars show the observed response and the gray bars show the permuted response. Error bars denote ±SEM across permutation runs. Asterisks indicate a significant decoding performance (two-tailed two-sample t-test between observed vs. permuted). **p < 0.01 and ****p < 0.0001. (G) Feature-selective neurons (i.e., neurons that differentiate fixations on the eyes vs. mouth) are related to social traits. Shown is the correlation between the firing rate for fixations on the eyes and perceived social traits. Similar analysis can be performed for fixations on the mouth. Error bars denote ±SEM across neurons. Asterisks indicate a significant difference above 0 (two-tailed paired t-test) or between feature-selective versus nonselective neurons (two-tailed two-sample t-test) after Bonferroni correction for multiple comparisons. **p < 0.01 and ***p < 0.001. Figure adapted from Refs. and 45.
FIGURE 6
FIGURE 6
Correlation between personality factors and social trait judgments. (A) The correlation matrix of 33 questionnaire subscales and loadings of each subscale for the four factors. (B) Correlations between factor scores and social trait judgments. Asterisks indicate a significant correlation. Figure adapted from Ref. .
FIGURE 7
FIGURE 7
Multifaceted investigation of atypical social trait judgment in ASD. (A) PCA loadings of social traits on the first four PCs. Each column plots the strength of the loadings (x-axis, absolute value) across traits (y-axis). Color coding indicates the sign of the loading (orange for positive and purple for negative). Saturated colors highlight each trait’s most strongly correlated PC. (B) Aggregate ratings. Error bars denote ±SEM across rating modules. Asterisks indicate a significant difference between participants with ASD and neurotypicals using two-tailed two-sample t-test. *p < 0.05; **p < 0.01; ***p < 0.001; and ****p < 0.0001. (C) Ratings for each face identity rank-ordered by mean ratings from neurotypicals. Red: ASD. Blue: neurotypicals. Error bars and error shades denote ±SEM across rating modules. (D, E) Features within faces that contribute to atypical trait ratings in ASD. Relevance of each pixel to classification was revealed using layer-wise relevance propagation (LRP). Color coding shows LRP values in arbitrary units (a.u.). Yellow pixels positively contributed to the classification, whereas blue pixels negatively contributed to the classification. (D) An example face and its corresponding LRP maps (trait strong). (E) Difference in LRP maps for each trait. Red contours show the regions with a significant difference between participants with ASD and neurotypicals. (F) The social trait dissimilarity matrix (DM) from participants with ASD. (G) Bootstrap distribution of DM correspondence for each participant group. Blue: neurotypicals. Red: ASD. The dots show the mean value of each distribution. Participants with ASD show a weaker correspondence with the neural response DM compared to neurotypicals. (H) Observed versus permuted difference in DM correspondence between participant groups. The magenta line indicates the observed difference in DM correspondence between participant groups. The null distribution of difference in DM correspondence (shown in the gray histogram) is calculated by permutation tests of shuffling the participant labels (1000 runs). (I) Group differences in personality factor scores. As expected, the ASD group is significantly higher on Factor 1, which is primarily associated with standard autistic trait measures (i.e., AQ and SRS), social anxiety, and alexithymia. ***p < 0.001. (J) Relationship between social trait judgment and personality factors derived using representational-similarity analysis. The dissimilarity matrix structure of the social trait judgments (trustworthy and warm) is predicted by the dissimilarity matrices of the four personality dimensions or factors. Shown are regression coefficients of each personality dimension (factor) for trustworthy (left) and warm (right) judgments. The asterisks on the margins indicate a significant main effect of a personality dimension in predicting the social trait judgments, while the asterisks with curly brackets indicate a significant group-by-factor interaction, or in other words, a significant group difference in the predictive power of a given personality dimension. Figure adapted from Refs. , , and .

References

    1. Barrett LF, Adolphs R, Marsella S, Martinez AM, & Pollak SD (2019). Emotional expressions reconsidered: Challenges to inferring emotion from human facial movements. Psychological Science in the Public Interest, 20, 1–68. 10.1177/1529100619832930 - DOI - PMC - PubMed
    1. Jack RE (2013). Culture and facial expressions of emotion. Visual Cognition, 21, 1248–1286. 10.1080/13506285.2013.835367 - DOI
    1. Todorov A, Said CP, Engell AD, & Oosterhof NN (2008). Understanding evaluation of faces on social dimensions. Trends in Cognitive Sciences, 12, 455–460. 10.1016/j.tics.2008.10.001 - DOI - PubMed
    1. Meeren HKM, van Heijnsbergen CCRJ, & de Gelder B (2005). Rapid perceptual integration of facial expression and emotional body language. Proceedings of the National Academy of Sciences, 102, 16518–16523. 10.1073/pnas.0507650102 - DOI - PMC - PubMed
    1. Todorov A, Mende-Siedlecki P, & Dotsch R (2013). Social judgments from faces. Current Opinion in Neurobiology, 23, 373–380. 10.1016/j.conb.2012.12.010 - DOI - PubMed