. 2023 Nov 15;133(22):e165718.
doi: 10.1172/JCI165718.

Intratumoral androgen biosynthesis associated with 3β-hydroxysteroid dehydrogenase 1 promotes resistance to radiotherapy in prostate cancer

Affiliations

Intratumoral androgen biosynthesis associated with 3β-hydroxysteroid dehydrogenase 1 promotes resistance to radiotherapy in prostate cancer

Shinjini Ganguly et al. J Clin Invest. .

Abstract

Half of all men with advanced prostate cancer (PCa) inherit at least 1 copy of an adrenal-permissive HSD3B1 (1245C) allele, which increases levels of 3β-hydroxysteroid dehydrogenase 1 (3βHSD1) and promotes intracellular androgen biosynthesis. Germline inheritance of the adrenally permissive allele confers worse outcomes in men with advanced PCa. We investigated whether HSD3B1 (1245C) drives resistance to combined androgen deprivation and radiotherapy. Adrenally permissive 3βHSD1 enhanced resistance to radiotherapy in PCa cell lines and xenograft models engineered to mimic the human adrenal/gonadal axis during androgen deprivation. The allele-specific effects on radiosensitivity were dependent on availability of DHEA, the substrate for 3βHSD1. In lines expressing the HSD3B1 (1245C) allele, enhanced expression of DNA damage response (DDR) genes and more rapid DNA double-strand break (DSB) resolution were observed. A correlation between androgen receptor (AR) expression and increased DDR gene expression was confirmed in 680 radical prostatectomy specimens. Treatment with the nonsteroidal antiandrogen enzalutamide reversed the resistant phenotype of HSD3B1 (1245C) PCa in vitro and in vivo. In conclusion, 3βHSD1 promotes prostate cancer resistance to combined androgen deprivation and radiotherapy by upregulating DNA DSB repair. This work supports prospective validation of early combined androgen blockade for high-risk men harboring the HSD3B1 (1245C) allele.

Keywords: Endocrinology; Prostate cancer; Radiation therapy; Sex hormones; Therapeutics.


Conflict of interest statement

Conflict of interest: NS is a coinventor of a Cleveland Clinic patent (US20180023146A1, “3β-hydroxysteroid dehydrogenase in steroid-dependent disease”) on HSD3B1 and has grant support from Astellas and BMS. OYM has research support from Varian, PathomIQ, Bayer, and Gilead.

Figures

Figure 1
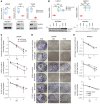
Figure 1. Loss of 3βHSD1 expression reduces colony formation and cell survival in irradiated PCa cells.
HSD3B1 mRNA (top panels) and 3βHSD1 protein expression (bottom panels) in (A) LNCaP, C4-2, and VCaP cells stably expressing shRNA targeting HSD3B1 (shHSD3B1) or nonsilencing shRNA (shControl). Gene expression was normalized to ACTB, and GAPDH was used as a loading control for immunoblotting. All data are represented as mean ± 95% CI from triplicates of 2 independent experiments (unpaired 2-tailed t test) (B) LAPC4 and RWPE-1 cells stably expressing dox-inducible restrictive (1245A) or permissive (1245C) HSD3B1. Gene expression of HSD3B1 (top panels) was assessed by qPCR (normalized to ACTB). All data are represented as mean ± SEM from triplicates of 2 independent experiments (1-way ANOVA with Bonferroni’s multiple-comparison test), and protein levels of 3βHSD1 (bottom panels) were measured by immunoblotting (normalized to β-actin). (C) Surviving cell fraction and (D) colony formation assay of LNCaP cells expressing shHSD3B1 or shControl treated with 4 or 8 Gy radiation and cultured for 14 days in csFBS medium containing ethanol (top panel), 50 nM DHEA (middle panel), or 1 nM R1881 (bottom panel) followed by crystal violet staining. Representative images of colonies formed after treatment with 0, 4, or 8 Gy radiation and cultured in the presence or absence of androgens. Original magnification, ×2. (E) The number of viable RWPE1 colonies stably expressing 1245A or 1245C HSD3B1 treated with 0, 4, or 8 Gy radiation and cultured in csFBS media containing ethanol (top panel), 50 nM DHEA (middle panel), or 1 nM R1881 (bottom panel). All data are represented as mean values ± 95% CI from triplicates in 2 independent experiments (unpaired 2 tailed t test). *P < 0.05; **P < 0.01; ***P < 0.001.
Figure 2
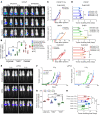
Figure 2. Loss of 3βHSD1 suppresses tumor growth of LNCaP cells following radiation treatment.
(A) Representative bioluminescence images of LNCaP subcutaneous tumors expressing shRNA targeting HSD3B1 (right panels) or a nontargeting control (left panels) grown in male NSG mice after radiation. Following subcutaneous injection of LNCaP cells, mice were divided into 3 groups: eugonadal (top panels), castrated with DHEA pellet supplement (middle), and castration alone (bottom). Mice from each group were sham irradiated or irradiated with 8 Gy and imaged when tumors reached 2.5 cm3. (B) The average number of days required for control (n = 6) and shHSD3B1 (n = 6) LNCaP tumors grown in eugonadal, castrated, and DHEA pellet–implanted mice to reach an end point size of 1.5 cm3. Data are represented as mean ± 95% CI (P values were calculated using 1-way ANOVA with Bonferroni’s multiple-comparison test). (C) Tumor growth of shControl and shHSD3B1 LNCaP xenograft tumors following radiation treatment in eugonadal (top), castrated (bottom), and DHEA-supplemented mice (middle). Red arrows, time of irradiation; green arrows, time of surgery. (D) Tumor-doubling time of irradiated shControl and shHSD3B1 LNCaP xenografts in eugonadal mice (top), castrated mice (bottom), and castrated mice with DHEA implantation (middle). Data are represented as mean ± SEM (P values were calculated using 1-way ANOVA with Bonferroni’s multiple comparison test).(E) Representative bioluminescence imaging and (F) tumor growth of LAPC4 subcutaneous tumors expressing 1245A, 1245C HSD3B1, or EV allele after sham (left panel, n = 8 per group) or 8 Gy radiation (right panel, n = 8 per group). (G) The number of days after irradiation for EV (n = 8), 1245A (n = 8), and 1245C (n = 8) HSD3B1 LAPC4 tumors to reach an end point size of 1.5 cm3. Data are represented as mean ± 95% CI (P values were calculated using 1-way ANOVA with Bonferroni’s multiple-comparison test). (H) Tumor-doubling time of irradiated or sham-treated LAPC4 xenograft tumors expressing EV, 1245A, and 1245C allele. For C and F, data are represented as mean ± SEM. P values were calculated using Mann-Whitney U test for nonparametric data analysis. For B, D, G, and H, data are represented as mean ± 95% CI (P values were calculated using 1-way ANOVA with Bonferroni’s multiple-comparison test). *P < 0.05; **P < 0.01; ***P < 0.001; ****P < 0.0001.
Figure 3
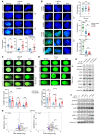
Figure 3. 3βHSD1 enhances DNA repair in irradiated PCa cells treated with DHEA.
(A) Representative immunofluorescence images (top) and quantitation (bottom) of phospho-γH2AX foci in LNCaP cells expressing shControl or shHSD3B1 pretreated with 50 nM DHEA for 48 hours followed by 0 Gy or 4 Gy irradiation. The γH2AX foci were quantified as foci per nucleus at each time point. All data are represented as mean values ± 95% CI (P values were calculated using 2-tailed t test). (B) Representative immunofluorescence images (top) and quantification (bottom) of γH2AX foci in LAPC4 cells stably expressing HSD3B1 1245A, 1245C, or EV control. The cells were treated for 48 hours with DHEA, followed by 0 Gy or 4 Gy irradiation. All data are represented as mean values ± 95% CI (P values were calculated using 2-way ANOVA with Bonferroni’s multiple comparison test). (C) Neutral COMET assay and tail moment quantitation of LNCaP and (D) C4-2 cells expressing shControl and shHSD3B1 following pretreatment with DHEA and irradiation (0 Gy and 4 Gy). All data are represented as mean values ± 95% CI (P values were calculated using 2-tailed t test) (47). *P < 0.05; **P < 0.01; ***P < 0.001. Scale bars: 5 μm. (E) Immunoblot of DDR markers 12 hours after irradiation in LNCaP cells pretreated with 50 nM DHEA. Lamin B1 was used as a loading control. (F) Immunoblot analysis of DDR markers 12 hours after irradiation in LAPC4 expressing HSD3B1 (1245A, 1245C, or EV control) pretreated with 50 nM DHEA. (G) Volcano plots depicting differentially expressed genes in HSD3B1 (1245A) LAPC4 cells (left) and HSD3B1 (1245C) LAPC4 cells (right) compared with the EV control. Key DDR genes are highlighted in black.
Figure 4
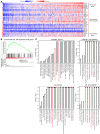
Figure 4. HSD3B1 expression levels are correlated with AR and AR-regulated genes involved in DDR.
(A) Heatmap showing expression levels of genes associated with androgen biosynthesis and DDRs in 681 PCa patients (Cleveland Clinic). Deidentified transcriptome data were obtained from the clinical use of the Decipher PCa test (Veracyte) at our institution between 2013 and 2021, as previously described (48). (B) GSEA of DDR genes regulated by ARs curated from Polkinghorn et al. (8). (C) Lollipop plots showing gene sets with FDR q < 0.25; pathways highlighted in red are involved in AR and DDR response.
Figure 5
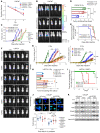
Figure 5. Enza pretreatment restores radiosensitivity.
(A) Clonogenic survival of Enza-treated cells following 0, 4, and 8 Gy IR treatment. Data are represented as mean ± 95% CI of 3 technical replicates. (B) Representative bioluminescence images of LNCaP xenografts undergoing oral gavage with either vehicle or Enza. (C)Tumor volume changes over the experimental duration for shControl and shHSD3B1 xenografts after 8 Gy IR, with and without Enza (shControl; n = 8, shHSD3B1; n = 8, shControl+Enza; n = 6) for each 0 Gy and 8 Gy IR treatment arm. P values were calculated using Mann-Whitney U test for nonparametric data analysis. Data are represented as mean ± SEM. (D) Doubling time of vehicle-treated shControl and shHSD3B1 tumors compared with Enza-treated shControl LNCaP tumors. All data are represented as mean values ± 95% CI (P values were calculated using 1-way ANOVA with Bonferroni’s multiple-comparison test). (E) Kaplan-Meier curve depicting the time to meet tumor volume greater than 1.5 cc for LNCaP xenografts. P values were calculated using log-rank test between groups. (F) Representative bioluminescence images of LAPC4 xenografts undergoing oral gavage with either vehicle or Enza with or without IR (n = 6 for each experimental condition for each HSD3B1 genotype). (G) Changes in tumor volume of LAPC4 (EV, 1245A, and 1245C) xenografts after 0 Gy (left) and 8 Gy IR (right). P values were calculated using Mann-Whitney U test for nonparametric data analysis. Data are represented as mean ± SEM. (H) Tumor-doubling time of LAPC4 xenografts that had undergone 8 Gy IR treatment. All data are represented as mean values ± 95% CI (P values were calculated using 1-way ANOVA with Bonferroni’s multiple-comparison test). (I) Kaplan-Meier curve depicting the time to meet tumor volume greater than 1.5 cc for LAPC4 xenografts. P values were calculated using log-rank test between groups. (J) Phospho-γ H2A.X foci formation and resolution after 4 Gy IR with Enza treatment in LNCaP cells in vitro. All data are represented as mean values ± 95% CI (P values were calculated using 2-tailed t test). (K) Immunoblot from LNCaP cells treated with DHEA or R1881 with or without Enza after 4 Gy IR showing Enza suppresses DDR protein expression. *P < 0.05; **P < 0.01; ***P < 0.001; ****P < 0.0001

References

    1. Lam ET, Glodé LM. Neoadjuvant and adjuvant hormonal and chemotherapy for prostate cancer. Hematol Oncol Clin North Am. 2013;27(6):1189–204. doi: 10.1016/j.hoc.2013.08.004. - DOI - PubMed
    1. Hanks GE, et al. Phase III trial of long-term adjuvant androgen deprivation after neoadjuvant hormonal cytoreduction and radiotherapy in locally advanced carcinoma of the prostate: the Radiation Therapy Oncology Group Protocol 92-02. J Clin Oncol. 2003;21(21):3972–3978. doi: 10.1200/JCO.2003.11.023. - DOI - PubMed
    1. Yang DD, Nguyen PL. Optimizing androgen deprivation therapy with radiation therapy for aggressive localized and locally advanced prostate cancer. Urol Oncol. 2021;39(10):720–727. doi: 10.1016/j.urolonc.2017.10.020. - DOI - PubMed
    1. Michalski JM, et al. Effect of standard vs dose-escalated radiation therapy for patients with intermediate-risk prostate cancer: the NRG Oncology RTOG 0126 randomized clinical trial. JAMA Oncol. 2018;4(6):e180039–e180039. doi: 10.1001/jamaoncol.2018.0039. - DOI - PMC - PubMed
    1. Krauss DJ, et al. Dose escalated radiotherapy alone or in combination with short-term androgen suppression for intermediate risk prostate cancer: outcomes from the NRG oncology/RTOG 0815 Randomized Trial. Int J Radiat Oncol Biol Phys. 2021;111(3):S1. doi: 10.1016/j.ijrobp.2021.07.039. - DOI

Publication types

MeSH terms