. 2023 Nov 15;133(22):e166666.
doi: 10.1172/JCI166666.

FXYD3 functionally demarcates an ancestral breast cancer stem cell subpopulation with features of drug-tolerant persisters

Affiliations

FXYD3 functionally demarcates an ancestral breast cancer stem cell subpopulation with features of drug-tolerant persisters

Mengjiao Li et al. J Clin Invest. .

Abstract

The heterogeneity of cancer stem cells (CSCs) within tumors presents a challenge in therapeutic targeting. To decipher the cellular plasticity that fuels phenotypic heterogeneity, we undertook single-cell transcriptomics analysis in triple-negative breast cancer (TNBC) to identify subpopulations in CSCs. We found a subpopulation of CSCs with ancestral features that is marked by FXYD domain-containing ion transport regulator 3 (FXYD3), a component of the Na+/K+ pump. Accordingly, FXYD3+ CSCs evolve and proliferate, while displaying traits of alveolar progenitors that are normally induced during pregnancy. Clinically, FXYD3+ CSCs were persistent during neoadjuvant chemotherapy, hence linking them to drug-tolerant persisters (DTPs) and identifying them as crucial therapeutic targets. Importantly, FXYD3+ CSCs were sensitive to senolytic Na+/K+ pump inhibitors, such as cardiac glycosides. Together, our data indicate that FXYD3+ CSCs with ancestral features are drivers of plasticity and chemoresistance in TNBC. Targeting the Na+/K+ pump could be an effective strategy to eliminate CSCs with ancestral and DTP features that could improve TNBC prognosis.

Keywords: Breast cancer; Drug therapy; Oncology; Stem cells.


Figures

Figure 1
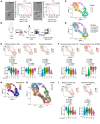
Figure 1. Tumor cells with mammary immature traits correlate with drug resistance.
(A) Workflow of scRNA-Seq of patient-derived xenografts (PDXs). (B) UMAP visualization of scRNA-Seq data from 3 PDX samples (P1, P2, and P3), colored by their unsupervised clusters (top) and samples (bottom). (C) Gene set variation analysis (GSVA) score of gene signatures of luminal progenitors and alveolar progenitors. (D) UMAP visualization of integrated single-nucleus RNA-Seq profiles of 4 drug-sensitive and 4 drug-resistant patients, who received neoadjuvant chemotherapy (NAC). (E and F) GSVA score of gene signatures of mammary gland progenitors (E) compared between pre- and mid-/post-NAC subgroups (F). Wilcoxon’s rank sum test (F) was used to determine significant P values.
Figure 2
Figure 2. Ancestor-like CSCs possess mammary stem– or luminal progenitor–like traits and quiescence.
(A) Tumor spheroids and data of the extreme limiting dilution assay (ELDA) of P3-derived cancer cells. Scale bars: 100 μm. (B) Graphical scheme describing the workflow of scRNA-Seq of breast CSCs. (C and D) UMAP visualization of SMART-seq data from all the cells in 4 cell populations (IGF1Rhi cells in P1, NRP1hi cells in P3, IGF1Rhi cells in P3, and NRP1hi cells in P4), colored by their unsupervised clusters (C) and samples (D). (E) Top: GSVA score of gene signatures of mammary gland stem/progenitors. Bottom: Violin plots of GSVA score for each cluster. (F) Top: GSVA score of quiescent stem cell gene signatures. Bottom: Violin plots of GSVA score for each cluster. (G) UMAP visualization of SMART-seq data from the cells colored by pseudotime. (H) UMAP visualization of RNA velocity derived from UniTVelo methods. (I) Top: GSVA score of gene signatures of human mammary gland immature cells. Bottom: Violin plots of GSVA score for each cluster. Statistical significance in E, F, and I was determined by 1-way ANOVA with Bonferroni’s post hoc test.
Figure 3
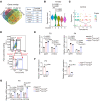
Figure 3. Plasma membrane FXYD3 demarcates ancestor-like CSCs.
(A) Venn diagram of upregulated genes (log2[fold change] > 0.2, Wilcoxon’s rank sum test P < 0.05) in the quiescent clusters (MKI67lo), compared with genes in other clusters of the SMART-Seq data. (B) Violin plots of FXYD3 expression (Seurat, https://satijalab.org/seurat/ log[normalized counts]) in each cluster shown in Figure 2C. Statistical significance was determined by Kruskal-Wallis test with Dunn’s multiple-comparison test. (C) Changes in FXYD3 expression (Seurat, log[normalized counts]) during pseudotime. (D) FACS sorting strategy using combination of NRP1 and FXYD3 antibodies. (EG) Relative mRNA expression of NRP1, FXYD3, FXYD3a, FXYD3b, and MKI67 measured by quantitative PCR (qPCR) between NRP1lo, NRP1hiFXYD3lo, and NRP1hiFXYD3hi cells. Values were normalized to ACTB, and fold changes were calculated relative to the values of NRP1lo (E and G) or NRP1hiFXYD3lo (F) cells. (E and G) Statistical significance was determined by 1-way ANOVA with Bonferroni’s post hoc test. (F) Statistical significance was determined by unpaired, 2-tailed Student’s t tests. Results are shown as means ± SD. n = 3.
Figure 4
Figure 4. FXYD3 expression demarcates ancestor-like CSCs and cellular plasticity of each CSC population.
(A) Tumor spheroids and data of the ELDA of P3-derived cancer cells and their FXYD3-knockdown cells in vitro. Scale bars: 50 μm. (B) Images of tumors generated in mice and data of the ELDA of P3-derived cancer cells and their FXYD3-knockdown cells in vivo. (C) FACS sorting (day 0) according to the expression levels of NRP1 and FXYD3. (D) FACS plot of cells in each population after culture for 31 days in the organoid medium. (E) Quantification of each population of NRP1hiFXYD3hi, NRP1hiFXYD3lo, and NRP1lo cells after culture for 19 and 29 days in the organoid medium. Statistical significance was determined by 1-way ANOVA with Tukey’s multiple-comparison test. Results are shown as means ± SEM. n = 4.
Figure 5
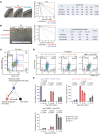
Figure 5. Drug resistance of FXYD3hi ancestor-like CSCs by harnessing of the Na+/K+ pump.
(A and B) Cell growth (A) and drug sensitivity assays (B). n = 3. (C) P4 patient-derived cancer cells after 48 hours of paclitaxel (10 μM) treatment. Scale bars: 100 μm. Bottom left: FACS analysis. Bottom right: The ratio (percent) of NRP1hiFXYD3hi cells to total cells was quantitated based on FACS analysis. n = 3. (D) Relative mRNA expression levels of ATP1A1 and ATP1B1 measured by qPCR. Values were normalized to ACTB, and fold changes were calculated relative to the values of NRP1lo cells. n = 3. (E) Left: Immunofluorescence staining of P3 cells using antibodies against NRP1, FXYD3, ATP1A1, or ATP1B1. Nuclei were stained by DAPI. Green arrows indicate cells positive for NRP1 but negative for FXYD3. Red arrows indicate cells negative for NRP1 but positive for FXYD3. White arrows indicate cells double-positive for NRP1 and FXYD3. Blue arrows indicate cells triple-positive for NRP1, FXYD3, and ATP1A1, or NRP1, FXYD3, and ATP1B1. Scale bars: 20 μm. Right: Ratio (percent) of ATP1A1-positive cells or ATP1B1-positive cells to total number of NRP1-negative cells, NRP1-positive but FXYD3-negative cells, or NRP1-positive and FXYD3-positive cells. Statistical significance was determined by Kruskal-Wallis test with Dunn’s multiple-comparison test. Results are shown as means ± SEM. n = 14 random fields for ATP1A1 and n = 12 random fields for ATP1B1 were counted. (F) Function of Na+/K+ pump. (A and C) Statistical significance was determined by unpaired, 2-tailed Student’s t tests. (B and D) Statistical significance was determined by 1-way ANOVA with Bonferroni’s post hoc test. Results are shown as means ± SD.
Figure 6
Figure 6. Na+/K+ pump inhibition decreases the proportion of FXYD3hi ancestor-like CSCs and sensitizes them to drugs.
(A) Geometric mean of fluorescence intensity (GeoMFI) of intracellular Ca2+ levels. n = 3. (B) GeoMFI of cellular ROS levels. n = 3. (C) Relative mRNA expression levels of GCLC measured by qPCR. Values were normalized to ACTB, and fold changes were calculated relative to the values of NRP1lo cells. n = 3. (D) P3 cells after treatment with Na+/K+ pump inhibitor ouabain (50 nM) or vehicle alone (negative control [NC]). Scale bars: 100 μm. Bottom left: FACS analysis. Bottom right: The ratio (percent) of NRP1hiFXYD3hi cells to total cells was quantitated based on FACS analysis. (E) After knockdown of ATP1B1, cells were treated with paclitaxel with serial concentrations for 72 hours. n = 3. (F) After knockdown of ATP1B1, NRP1hiFXYD3hi cells were sorted by FACS and treated with paclitaxel or doxorubicin with serial concentrations for 72 hours. Statistical significance was determined by 1-way ANOVA with Dunnett’s multiple-comparison test. n = 3. (A, D, and E) Statistical significance was determined by unpaired, 2-tailed Student’s t tests. (B and C) Statistical significance was determined by 1-way ANOVA with Bonferroni’s post hoc test. Results are shown as means ± SD.
Figure 7
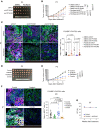
Figure 7. Knockdown of ATP1B1 sensitizes TNBC PDX tumors to paclitaxel treatment and decreases proportion of FXYD3-positive ancestor-like CSCs.
(A) Images of tumors generated in mice. (B) Tumor growth curves during paclitaxel treatment. n = 4 for each condition of P3 PDX. Statistical significance was determined by 2-way ANOVA with 2-stage linear step-up procedure of Benjamini, Krieger, and Yekutieli post hoc tests. Results are shown as means ± SEM. (C) Left: Immunofluorescence staining of frozen tissues of PDX tumors using antibodies against NRP1 and FXYD3; nuclei were stained using Hoechst 33342. Yellow arrows indicate cells double-positive for NRP1 and FXYD3. Scale bars: 20 μm. Right: Quantification of the ratio (percent) of NRP1 and FXYD3 double-positive cells to total NRP1-positive cells. n = 16–20 random fields were collected for each condition. Outliers were excluded with the ROUT method before statistical analysis. Statistical significance was determined by 2-way ANOVA with 2-stage linear step-up procedure of Benjamini, Krieger, and Yekutieli post hoc tests. Results are shown as means ± SEM. (D) Images of tumors generated in mice. Combo, combination of paclitaxel and ouabain. (E) Tumor growth curves during paclitaxel treatment. n = 8 for each condition of P3 PDX. Statistical significance was determined by 2-way ANOVA with 2-stage linear step-up procedure of Benjamini, Krieger, and Yekutieli post hoc tests. Results are shown as means ± SEM. (F) Left: Immunofluorescence staining of paraffin tissues of PDX tumors using antibodies against NRP1 and FXYD3; nuclei were stained using DAPI. Yellow arrows indicate cells double-positive for NRP1 and FXYD3. Scale bars: 20 μm. Right: Quantification of the ratio (percent) of NRP1 and FXYD3 double-positive cells to total NRP1-positive cells. n = 21 random fields were collected for each condition. Outliers were excluded with the ROUT method before statistical analysis. Statistical significance was determined by 2-way ANOVA with 2-stage linear step-up procedure of Benjamini, Krieger, and Yekutieli post hoc tests. Results are shown as means ± SEM. (G) Quantification of the ejection fraction (EF) by transthoracic echocardiography. n = 7 mice for each condition. Statistical significance was determined by unpaired, 2-tailed Student’s t test. Results are shown as means ± SEM.
Figure 8
Figure 8. Ancestor-like CSCs are related to poor clinical prognosis.
(A) Forty-eight genes (outlined by thick black lines) from the Venn diagram shown in Figure 3A were upregulated in quiescent clusters across 3 of 4 samples and selected as the ancestor-like CSC signature genes. (B) UMAP visualization of scRNA-Seq data from PDX models shown in Figure 1B colored using GSVA score of the ancestor-like CSC signature. (C and D) UMAP visualization of single-nucleus RNA-Seq data from NAC-sensitive or NAC-resistant TNBC cancer tissues shown in Figure 1D colored using GSVA score for the ancestor-like CSC signature and compared between pre- and mid-/post-treatment subgroups (C). Wilcoxon’s rank sum test (D) was used to determine significant P value. (E) Kaplan-Meier survival analysis between high (>0) and low (<0) subgroups of the ancestor-like CSC signature score in METABRIC cohort of breast cancer patients who received chemotherapy (not hormone therapy; n = 213) or belonged to TNBC subtype (n = 299). OS, overall survival; PFS, progression-free survival. (F) Kaplan-Meier survival analysis between NRP1hiFXYD3lo and NRP1hiFXYD3hi groups in METABRIC cohort of TNBC breast cancer patients. n = 149. Medians were used for cutoff value. P value was obtained using log-rank test. (G) Representative images of H&E staining and immunofluorescence staining of paired tumor samples of pre- and post-NAC from patients with TNBC, using antibodies against FXYD3 and NRP1 or IGF1R. Nuclei were stained using DAPI. Yellow arrows indicate cells double-positive for NRP1 and FXYD3 (top) and cells double-positive for IGF1R and FXYD3 (bottom). Scale bars: 20 μm. (H) Quantification of the ratio (percent) of the cells double-positive for NRP1 and FXYD3 to total NRP1-positive cells (top) and the cells double-positive for IGF1R and FXYD3 to total IGF1R-positive cells (bottom). n = 5 random fields were collected for each condition. Statistical significance was determined by 2-tailed Mann-Whitney U tests. Results are shown as means ± SEM.
Figure 9
Figure 9. Ancestor-like CSCs possess features of DTPs.
(A and B) Top: GSVA score of reported enriched gene sets in DTPs projected onto the UMAP derived from the SMART-seq data shown in Figure 2C. Bottom: Violin plots of GSVA score for each cluster. Statistical significance was determined by moderated t tests, and P value was adjusted by false discovery rate.

References

    1. Bianchini G, et al. Triple-negative breast cancer: challenges and opportunities of a heterogeneous disease. Nat Rev Clin Oncol. 2016;13(11):674–690. doi: 10.1038/nrclinonc.2016.66. - DOI - PMC - PubMed
    1. Loibl S, et al. Breast cancer. Lancet. 2021;397(10286):1750–1769. doi: 10.1016/S0140-6736(20)32381-3. - DOI - PubMed
    1. Prager BC, et al. Cancer stem cells: the architects of the tumor ecosystem. Cell Stem Cell. 2019;24(1):41–53. doi: 10.1016/j.stem.2018.12.009. - DOI - PMC - PubMed
    1. Al-Hajj M, et al. Prospective identification of tumorigenic breast cancer cells. Proc Natl Acad Sci U S A. 2003;100(7):3983–3988. doi: 10.1073/pnas.0530291100. - DOI - PMC - PubMed
    1. Ginestier C, et al. CXCR1 blockade selectively targets human breast cancer stem cells in vitro and in xenografts. J Clin Invest. 2010;120(2):485–497. doi: 10.1172/JCI39397. - DOI - PMC - PubMed

Publication types

MeSH terms