. 2023 Dec 19;14(6):e0251323.
doi: 10.1128/mbio.02513-23. Epub 2023 Nov 15.

Essential role of the conserved oligomeric Golgi complex in Toxoplasma gondii

Affiliations

Essential role of the conserved oligomeric Golgi complex in Toxoplasma gondii

Clem Marsilia et al. mBio. .

Abstract

The Golgi is an essential eukaryotic organelle and a major place for protein sorting and glycosylation. Among apicomplexan parasites, Toxoplasma gondii retains the most developed Golgi structure and produces many glycosylated factors necessary for parasite survival. Despite its importance, Golgi function received little attention in the past. In the current study, we identified and characterized the conserved oligomeric Golgi complex and its novel partners critical for protein transport in T. gondii tachyzoites. Our results suggest that T. gondii broadened the role of the conserved elements and reinvented the missing components of the trafficking machinery to accommodate the specific needs of the opportunistic parasite T. gondii.

Keywords: AP-5; COPI; COPII; Golgi; Toxoplasma gondii; anterograde transport; apicomplexa; glycosylation; retrograde transport; vesicular transport.


Conflict of interest statement

The authors declare no conflict of interest.

Figures

Fig 1
Fig 1
Identification of the Toxoplasma COG complex subunits. (A) Endogenously tagged TgCog8AID-HA (green) colocalizes with Golgi marker GRASP55RFP (red). The blue DAPI stain marks the tachyzoite nucleus. (B) The schematic shows the two-lobe composition of the COG complex. Previously identified subunits are shown with bright colors. (C) Equal amounts of the input fraction (S, soluble), proteins not retained on the αHA beads (UB, unbound), and proteins retained on αHA beads (B, bound) were examined by western blot analysis to confirm the efficiency of the TgCog8AID-HA pulldown. The tubulin A probe confirms the specificity of the TgCog8AID-HA pulldown. (D) The log2 values of the protein spectra detected by mass spectrometry analysis of the TgCog8AID-HA complexes and non-specific interactions detected in the parental strain are plotted on the graph. Proteins maximally enriched in the TgCog8AID-HA complexes are encircled and listed in the table on the right. (E) The diagram shows the protein organization of the Toxoplasma COG complex subunits.
Fig 2
Fig 2
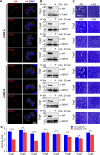
Eight essential subunits of the Toxoplasma COG complex (A) Immunofluorescence microscopy shows the Golgi expression of the HATgCog1 tet-OFF model and AID models of TgCog2AID-HA–TgCog8AID-HA subunits using α-HA (red) and DAPI (blue) staining. The gray line represents parasite staining with antibodies against surface marker TgIMC1. (B) Western blot analysis confirmed the expression and downregulation of HATgCog after 16 h of treatment with 2 µM anhydrotetracycline (ATc) and TgCog2AID-HA–TgCog8AID-HA after 30 min of treatment with 500 µM auxin (indole-3-acetic acid, IAA). Western blots were probed with α-HA to detect the COG complex subunits, with either α-tubulin A or α-GRA7 to confirm equal loading of the total lysates. (C) Images of host cell monolayers infected with HATgCog1 tet-OFF or TgCog2AID-HA–TgCog8AID-HA AID tachyzoites and grown with or without the indicated treatment for 7 days. Representative images of three independent experiments are shown. (D) The average number of parasites per vacuole after 16 h of growth in the presence or absence of 2 µM ATc (TgCog1) or 500 µM IAA (TgCog2–TgCog8) was quantified in three independent experiments. A hundred random vacuoles were evaluated. Mean values −/+ SD are plotted on the graph. The raw counts and the t-test values are included in Table S3.
Fig 3
Fig 3
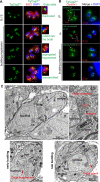
Cell cycle dynamics of the Toxoplasma Golgi. (A) Major cell cycle phases were determined based on the parasite cytoskeletal morphology (α-IMC1, internal budding) and the shape of the nucleus (DAPI). Various Golgi states and transitions, including organelle duplication, segregation, fragmentation, and reassembly, were visualized using the TgCog2HA marker. (B) The Golgi-centrosome relationship was examined by co-staining TgCog2HA and centrosome marker centrin 1 (α-Centrin1). (C) TEM images of dividing tachyzoites. Major organelles and structures are labeled.
Fig 4
Fig 4
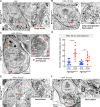
The COG complex is required for proper Golgi morphology and function. (A) A TEM microphotograph of the tachyzoite expressing the entire COG complex (−IAA). The enlarged image on the right depicts four cisterns of the Golgi apparatus. (B) The image shows changes in the Golgi region of the RH TgCog3AID-HA tachyzoite after 30 min of IAA treatment. Note the accumulation of large Golgi vesicles. (C) The prolonged TgCog3 deprivation on the tachyzoite internal membranes leads to inflation of the internal membranes, including the ER (red arrowheads). (D) Quantification of Golgi-derived vesicles in the tachyzoites after 30 min of TgCog3 and TgCog7 deficiency. Ten TEM images were evaluated. The raw counts and t-tests are included in Table S3. (E) Images of TgCog7-depleted parasites (30 min, IAA) show persistent vesiculation in the Golgi region. (F) The images depict Golgi vesiculation in the RH TgCog7AID-HA tachyzoite after 8 h of IAA treatment.
Fig 5
Fig 5
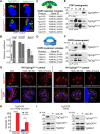
Toxoplasma COG complex interacts with COPI and COPII coatomer proteins. (A) Images of the 3D reconstruction of the Golgi-localized TgCog3AID-HA (red), TgCog7AID-HA (red), TgδCOPImyc (green), and TgSec31myc (green) in the perinuclear region (nucleus, DAPI, blue). (B) The Pearson coefficient was determined based on the colocalization analysis of a minimum of 10 tachyzoites. (C and D) The diagrams of the COPI (C) and COPII (D) coatomer complexes and the tables of T. gondii orthologs of individual subunits. (E and F) Immunoisolation of the TgδCOPImyc (E) and TgSec31myc (F) complexes from parasites co-expressing endogenous TgCog3AID-HA or TgCog7AID-HA. The insoluble (P, pellet), soluble (S), and depleted soluble fractions (nB, not bound) and the beads with precipitated complexes (B) (10 times more than the other fractions) were probed with α-myc and α-HA antibodies to detect potential interactions (the co-IP panels) and to confirm the efficient pulldown of the bait protein (the IP panel). (G) Immunofluorescence microscopy analysis of TgδCOPImyc in parasites expressing (−IAA) or lacking TgCog3AID-HA or TgCog7AID-HA (+IAA). The coat protein was visualized with α-myc antibodies and co-stained with DAPI (blue) and α-TgIMC1 (traced with a gray line). (H) Quantification of the TgδCOPImyc Golgi association in parasites treated or not treated with IAA for 8 h. The mean and SD values of the vacuole counts are plotted on the graph. The raw counts and t-test values are shown in Table S3. (I) Western blot analysis of TgδCOPImyc stability in TgCog3- and TgCog7-deficient parasites (α-myc probe). The equal loading and the downregulation of TgCog3 and TgCog7 were confirmed with α-GRA7 and α-HA antibodies, respectively.
Fig 6
Fig 6
Toxoplasma COG complex interacts with a novel Uso1-like factor. (A) Localization of TGME49_289120AID-HA protein was determined by co-staining of the factor (α-HA), nuclear stain DAPI, and parasite surface marker TgIMC1 (traced with a gray line). A 30-min treatment with 500 μM IAA resulted in robust TGME49_289120AID-HA downregulation. (B) Images of the host cell monolayers infected with Tg289120AID-HA tachyzoites and grown with or without 500 μM IAA for 7 days. (C) Immunofluorescence analysis of the parasites expressing Tg289120myc in the RH TgCog3AID-HA or TgCog7AID-HA mutants. Parasites were co-stained with α-myc (green), α-HA (red), and DAPI (blue). Inset shows that the proteins overlap in the Golgi region. (D) Western blot analysis of immunoprecipitated Tg289120myc complexes from parasites co-expressing endogenous TgCog3AID-HA or TgCog7AID-HA. The insoluble (P, pellet), soluble (S), and depleted soluble fractions (nB, not bound) and the beads with precipitated complexes (B) (10 times more than the other fractions) were probed with α-myc and α-HA antibodies to detect protein interactions (the co-IP panels) and to confirm the efficient Tg289120myc pulldown (the IP panel). (E) The log2 values of the protein spectra detected by mass spectrometry analysis of the Tg289120myc complexes and proteins detected in the pulldown from the parental strain are plotted on the graph. The differently colored dots represent categories of transport proteins. (F) Schematic of Homo sapiens p115 and T. gondii Ulp1 protein organization. The signature domains and regions of similarity are shown. (G) Folding prediction for Mus musculus p115 and selected regions of T. gondii Ulp1 are shown (AlphaFold2, PyMol, and SwissProt). Note that the image of the coiled-coil region of T. gondii Ulp1 is a compilation of five different models listed in the legend below. (H) Phylogenetic tree of TgUlp1 and various Uso1/p115 orthologs.
Fig 7
Fig 7
TgGlp1 is a novel T. gondii Golgi transport factor. (A) Localization of TGME49_258080AID-HA protein was determined by co-staining of the factor (α-HA), nuclear stain DAPI, and parasite surface marker TgIMC1 (traced with a gray line). A 30-min treatment with 500 μM IAA resulted in robust TGME49_258080AID-HA downregulation. (B) Images of the host cell monolayers infected with Tg258080AID-HA tachyzoites and grown with or without 500 µM IAA for 7 days. (C) Schematic of TgGlp1 protein organization. The identified domains are shown. The regions of similarity are listed below. (D) The log2 values of the protein spectra detected by mass spectrometry analysis of the TgGlpmyc complexes and proteins detected in the pulldown from the parental strain are plotted on the graph. The differently colored dots represent categories of the selected transport proteins. (E) Images of tachyzoites expressing or lacking TgCog3 or TgCog7 for the indicated time. The associated changes in TgGlp1myc expression were visualized by co-staining parasites with α-myc and DAPI (blue). The insets are overexposed images of the selected Golgi regions.
Fig 8
Fig 8
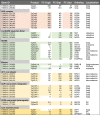
Summary of TgCog8, TgUlp1, and TgGlp1 protein interactions. The table lists the major groups of TgCog8, TgUlp1, and TgGlp1 interactors identified in the proteomic studies. The FC column shows the fold change calculated as a ratio of spectra detected in the indicated protein IP and in the IP from the parental strain. FC also accounts for protein size. The ortholog column contains the abbreviated name of the human ortholog protein. The localization column indicates the known localization of the factor in the studied model organisms. NP, not present.
Fig 9
Fig 9
The model of the COG complex function in T. gondii. The drawing depicts a portion of the secretory pathway (from bottom to top): endoplasmic reticulum (ER); cis-, mid-, and trans-Golgi; trans-Golgi network (TGN); and endosome-like compartment (ELC). The organelles are colored according to the predicted localization of the COG complex (red), TgUlp1 (orange), and TgGlp1 (yellow). The arrows show the direction of vesicular transport and the type of transported vesicles. The lobe A subunit TgCog3 is predicted to localize to the acceptor Golgi membrane. The immediate effect of acute TgCog3 degradation (30 min) is the block of the Golgi receiving function. In the absence of the Golgi tether, the anterograde and retrograde vesicles cannot dock or fuse with the Golgi and accumulate in the cytoplasm. The large membranous compartment with functional tethers, the ER, likely accepts rogue vesicles. Continued TgCog3 deprivation (8 h) leads to ER inflation, and impaired anterograde transport contributes to the phenotype. The created disbalance of the anterograde and retrograde flows results in Golgi reduction and fragmentation of the late Golgi compartments.

References

    1. Venugopal K, Marion S. 2018. Secretory organelle trafficking in Toxoplasma gondii: a long story for a short travel. Int J Med Microbiol 308:751–760. doi: 10.1016/j.ijmm.2018.07.007 - DOI - PubMed
    1. Wang K, Peng ED, Huang AS, Xia D, Vermont SJ, Lentini G, Lebrun M, Wastling JM, Bradley PJ. 2016. Identification of novel O-linked glycosylated Toxoplasma proteins by Vicia villosa lectin chromatography. PLoS One 11:e0150561. doi: 10.1371/journal.pone.0150561 - DOI - PMC - PubMed
    1. Joiner KA, Roos DS. 2002. Secretory traffic in the eukaryotic parasite Toxoplasma gondii: less is more. J Cell Biol 157:557–563. doi: 10.1083/jcb.200112144 - DOI - PMC - PubMed
    1. Bandini G, Albuquerque-Wendt A, Hegermann J, Samuelson J, Routier FH. 2019. Protein O- and C-Glycosylation pathways in Toxoplasma gondii and Plasmodium falciparum. Parasitology 146:1755–1766. doi: 10.1017/S0031182019000040 - DOI - PMC - PubMed
    1. Gas-Pascual E, Ichikawa HT, Sheikh MO, Serji MI, Deng B, Mandalasi M, Bandini G, Samuelson J, Wells L, West CM. 2019. CRISPR/Cas9 and glycomics tools for Toxoplasma glycobiology. J Biol Chem 294:1104–1125. doi: 10.1074/jbc.RA118.006072 - DOI - PMC - PubMed

Substances

LinkOut - more resources