. 2024 Feb 8;14(2):348-361.
doi: 10.1158/2159-8290.CD-23-0240.

Tumor Explants Elucidate a Cascade of Paracrine SHH, WNT, and VEGF Signals Driving Pancreatic Cancer Angiosuppression

Affiliations

Tumor Explants Elucidate a Cascade of Paracrine SHH, WNT, and VEGF Signals Driving Pancreatic Cancer Angiosuppression

Marie C Hasselluhn et al. Cancer Discov. .

Abstract

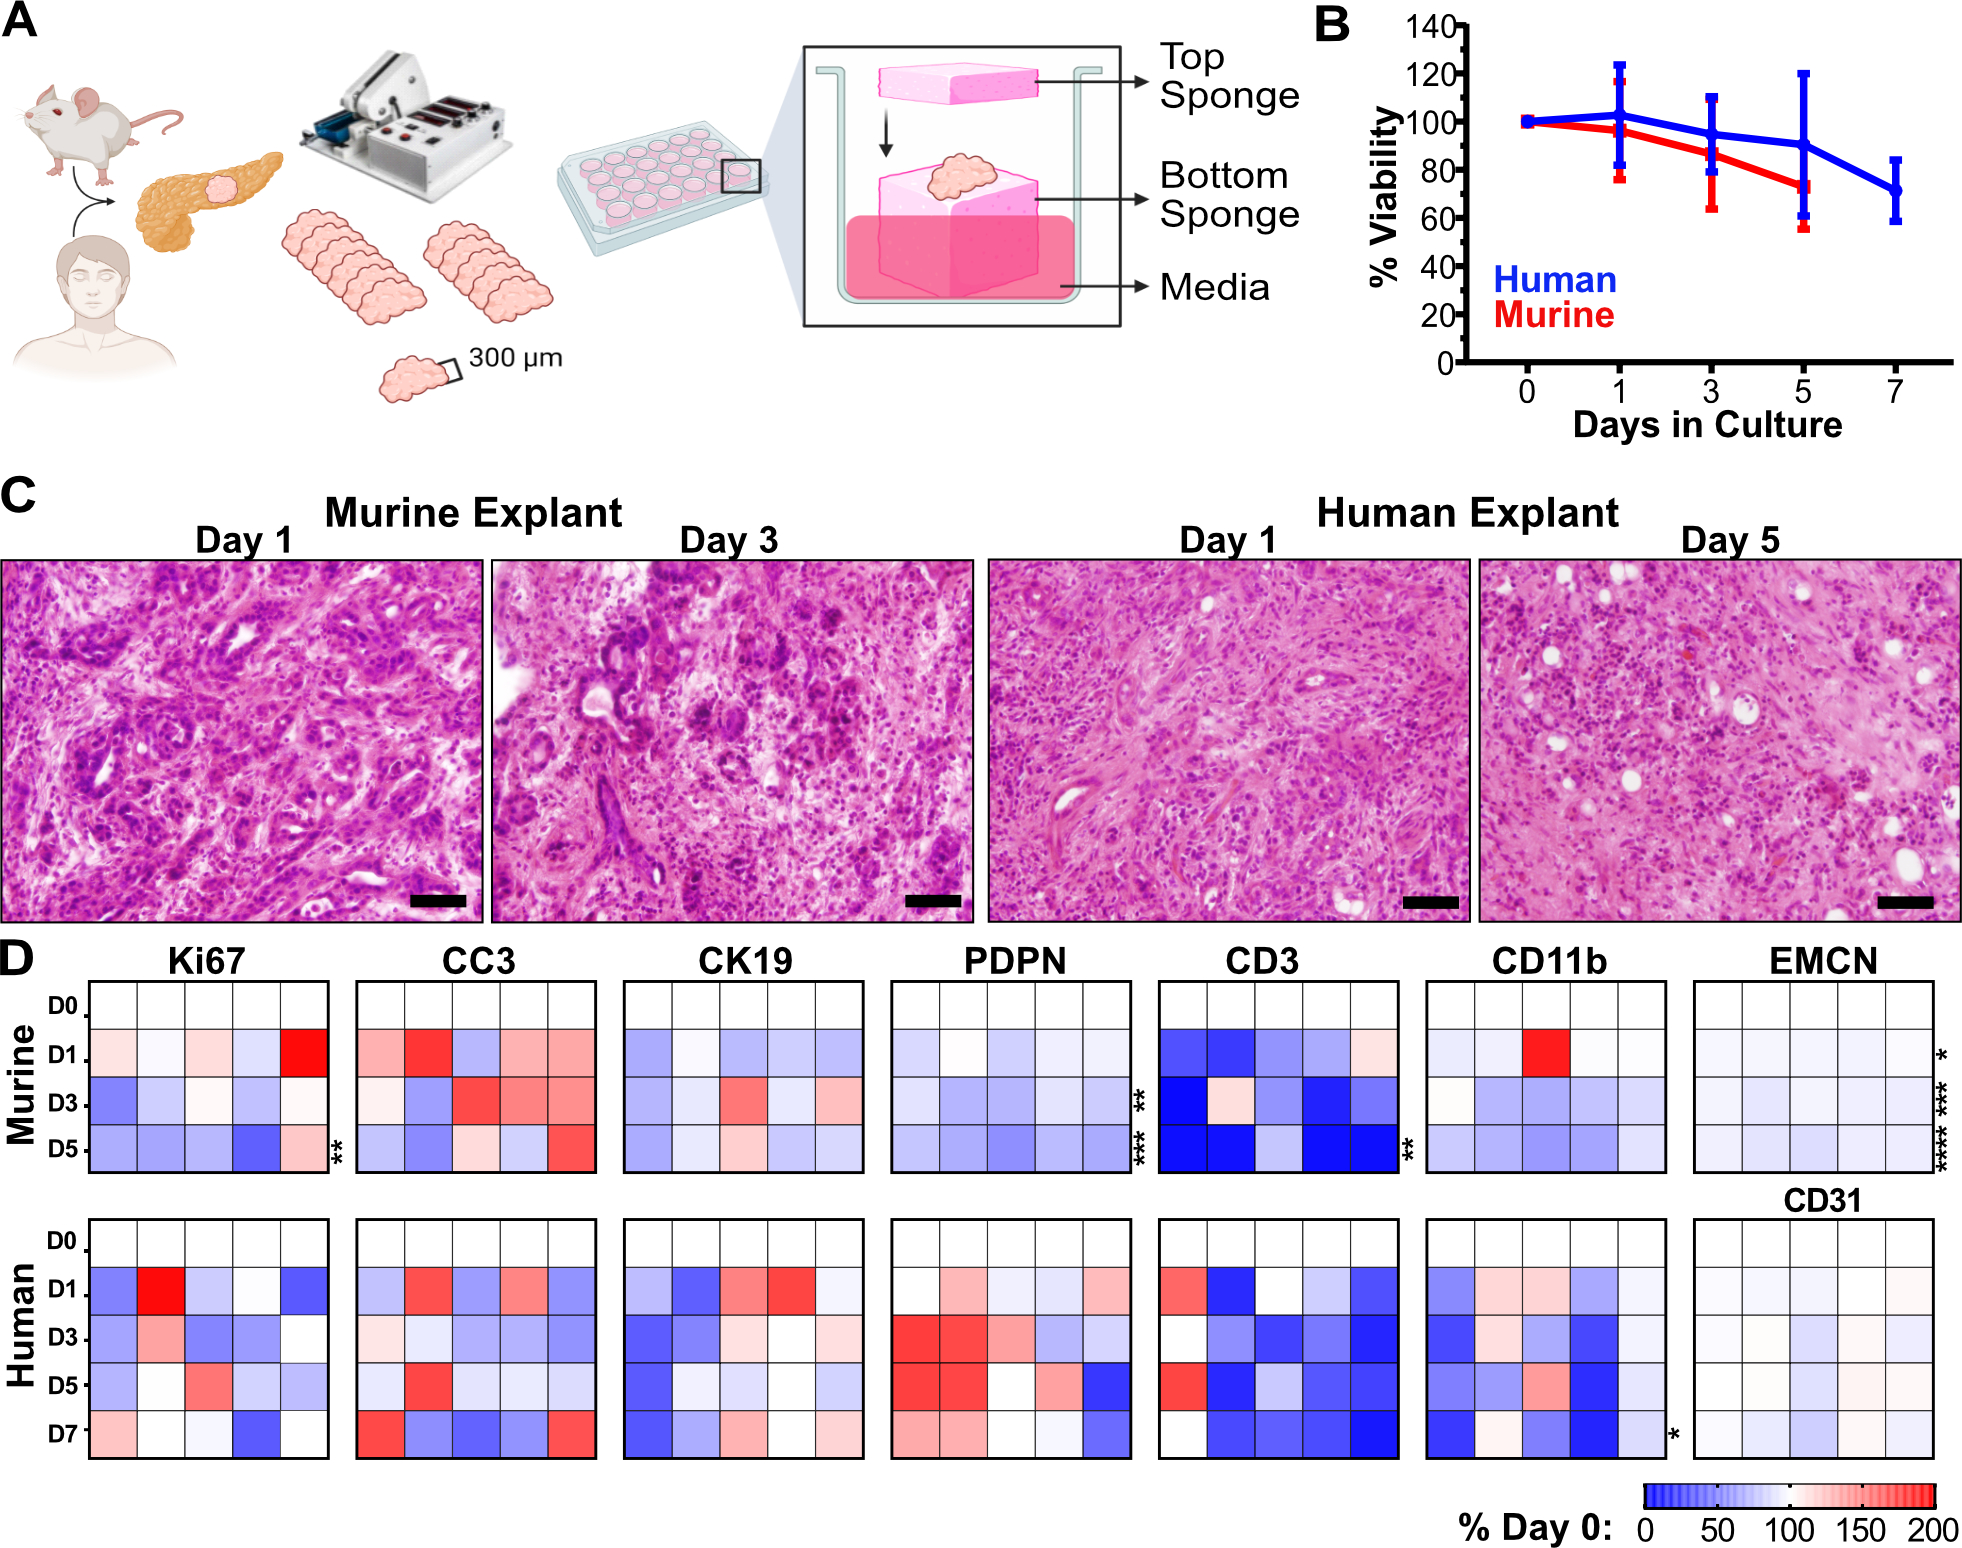
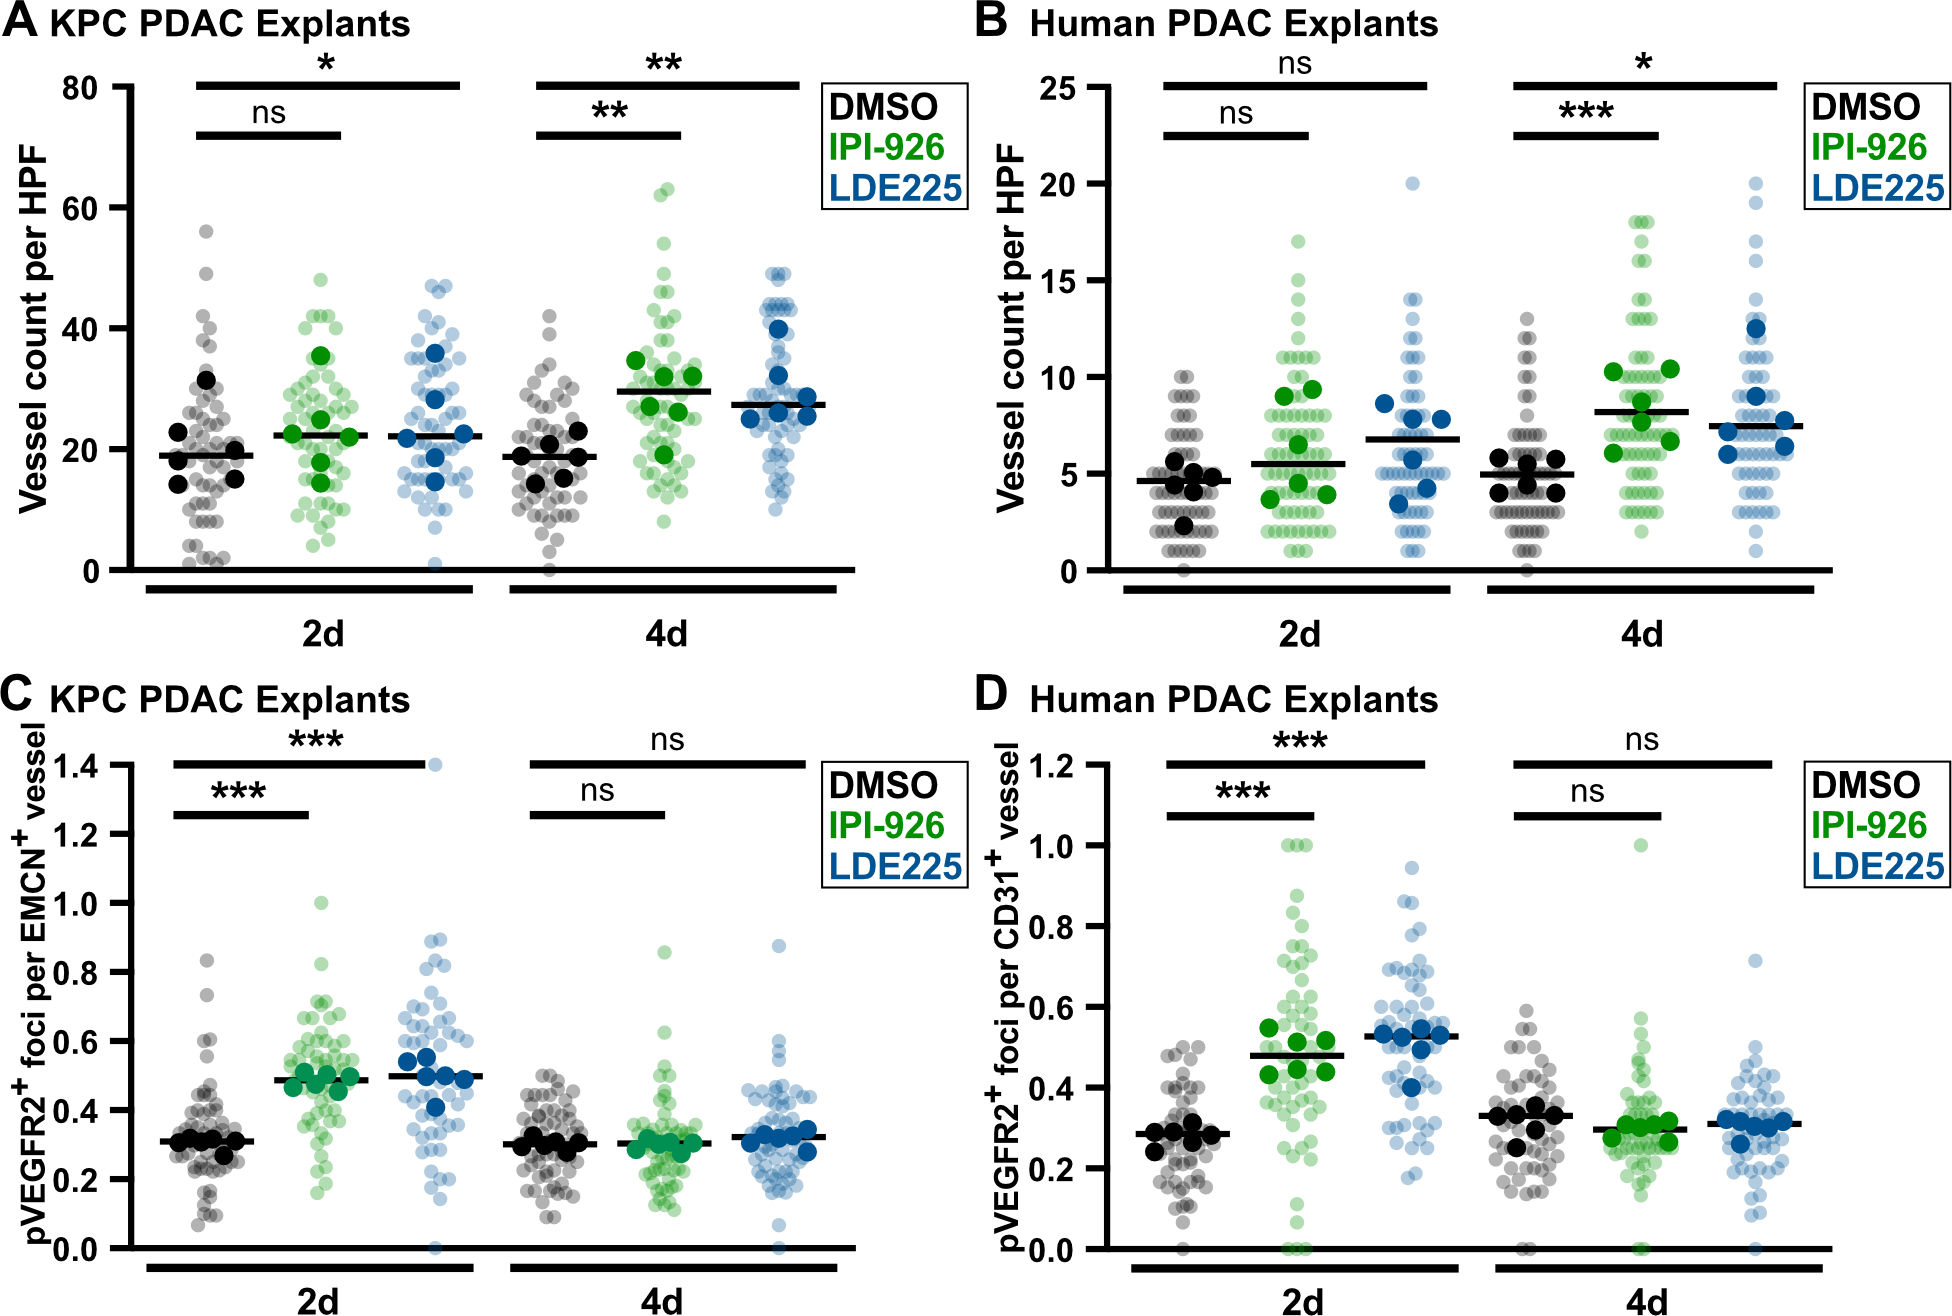
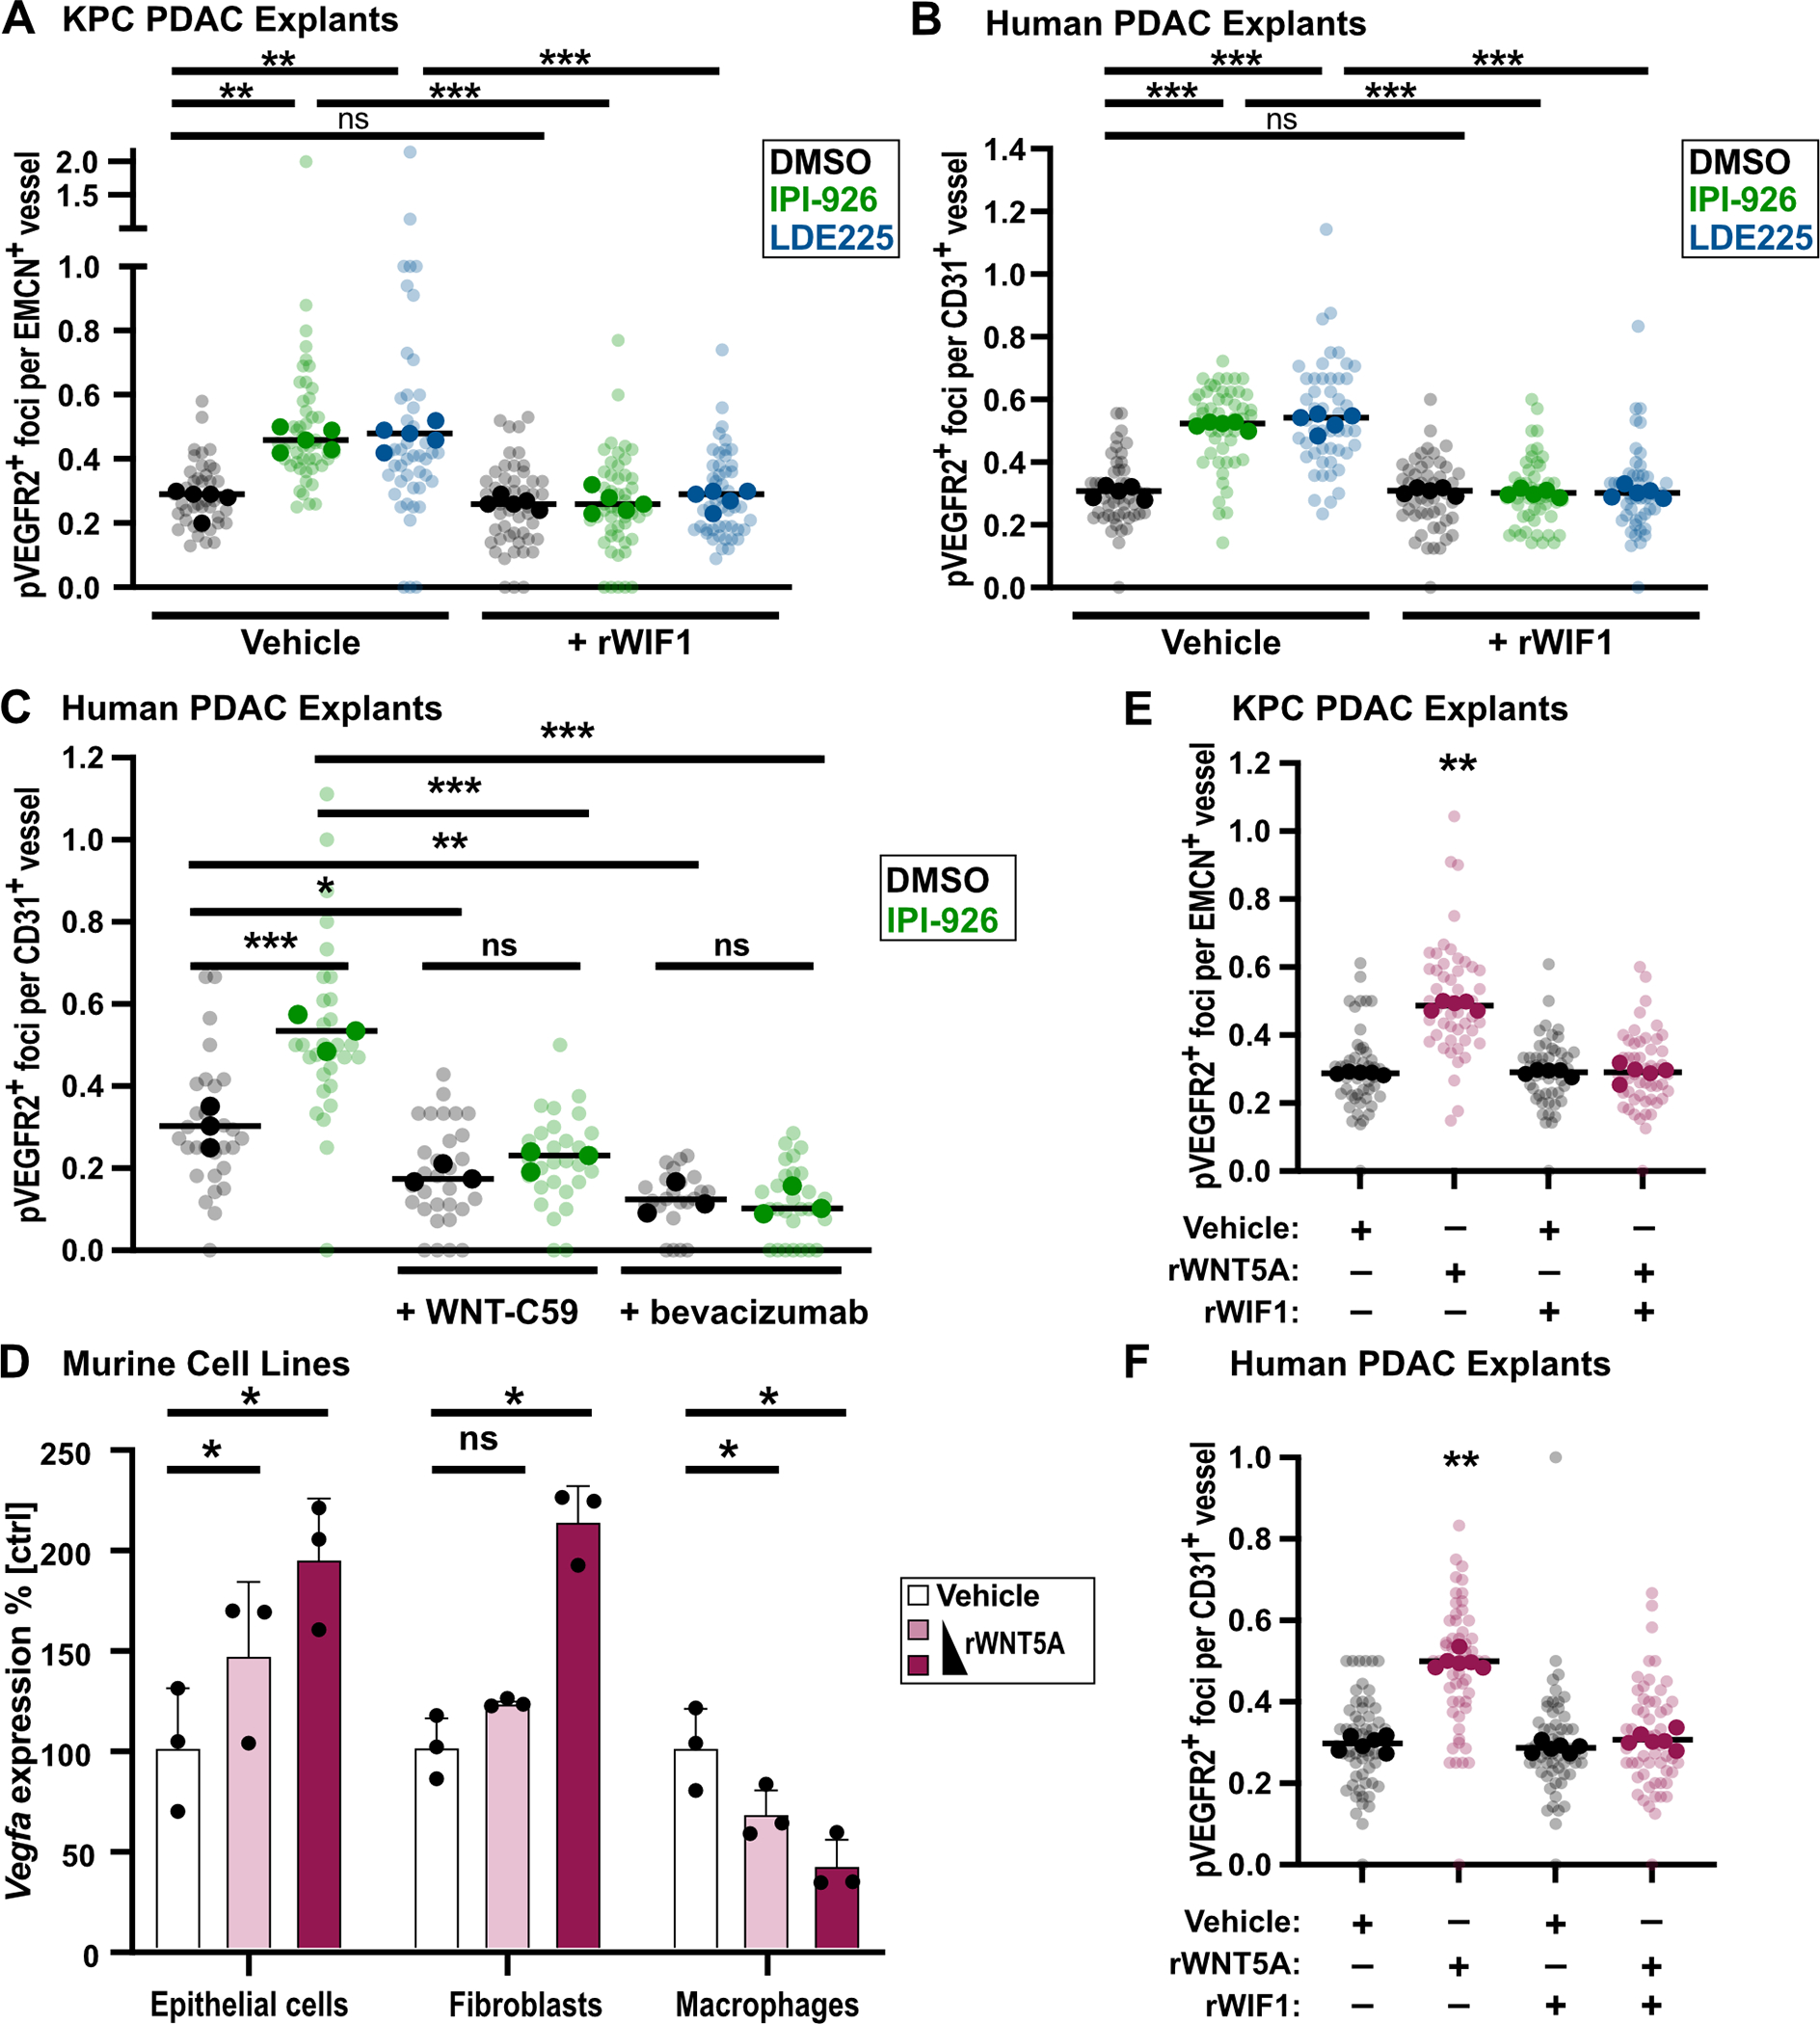
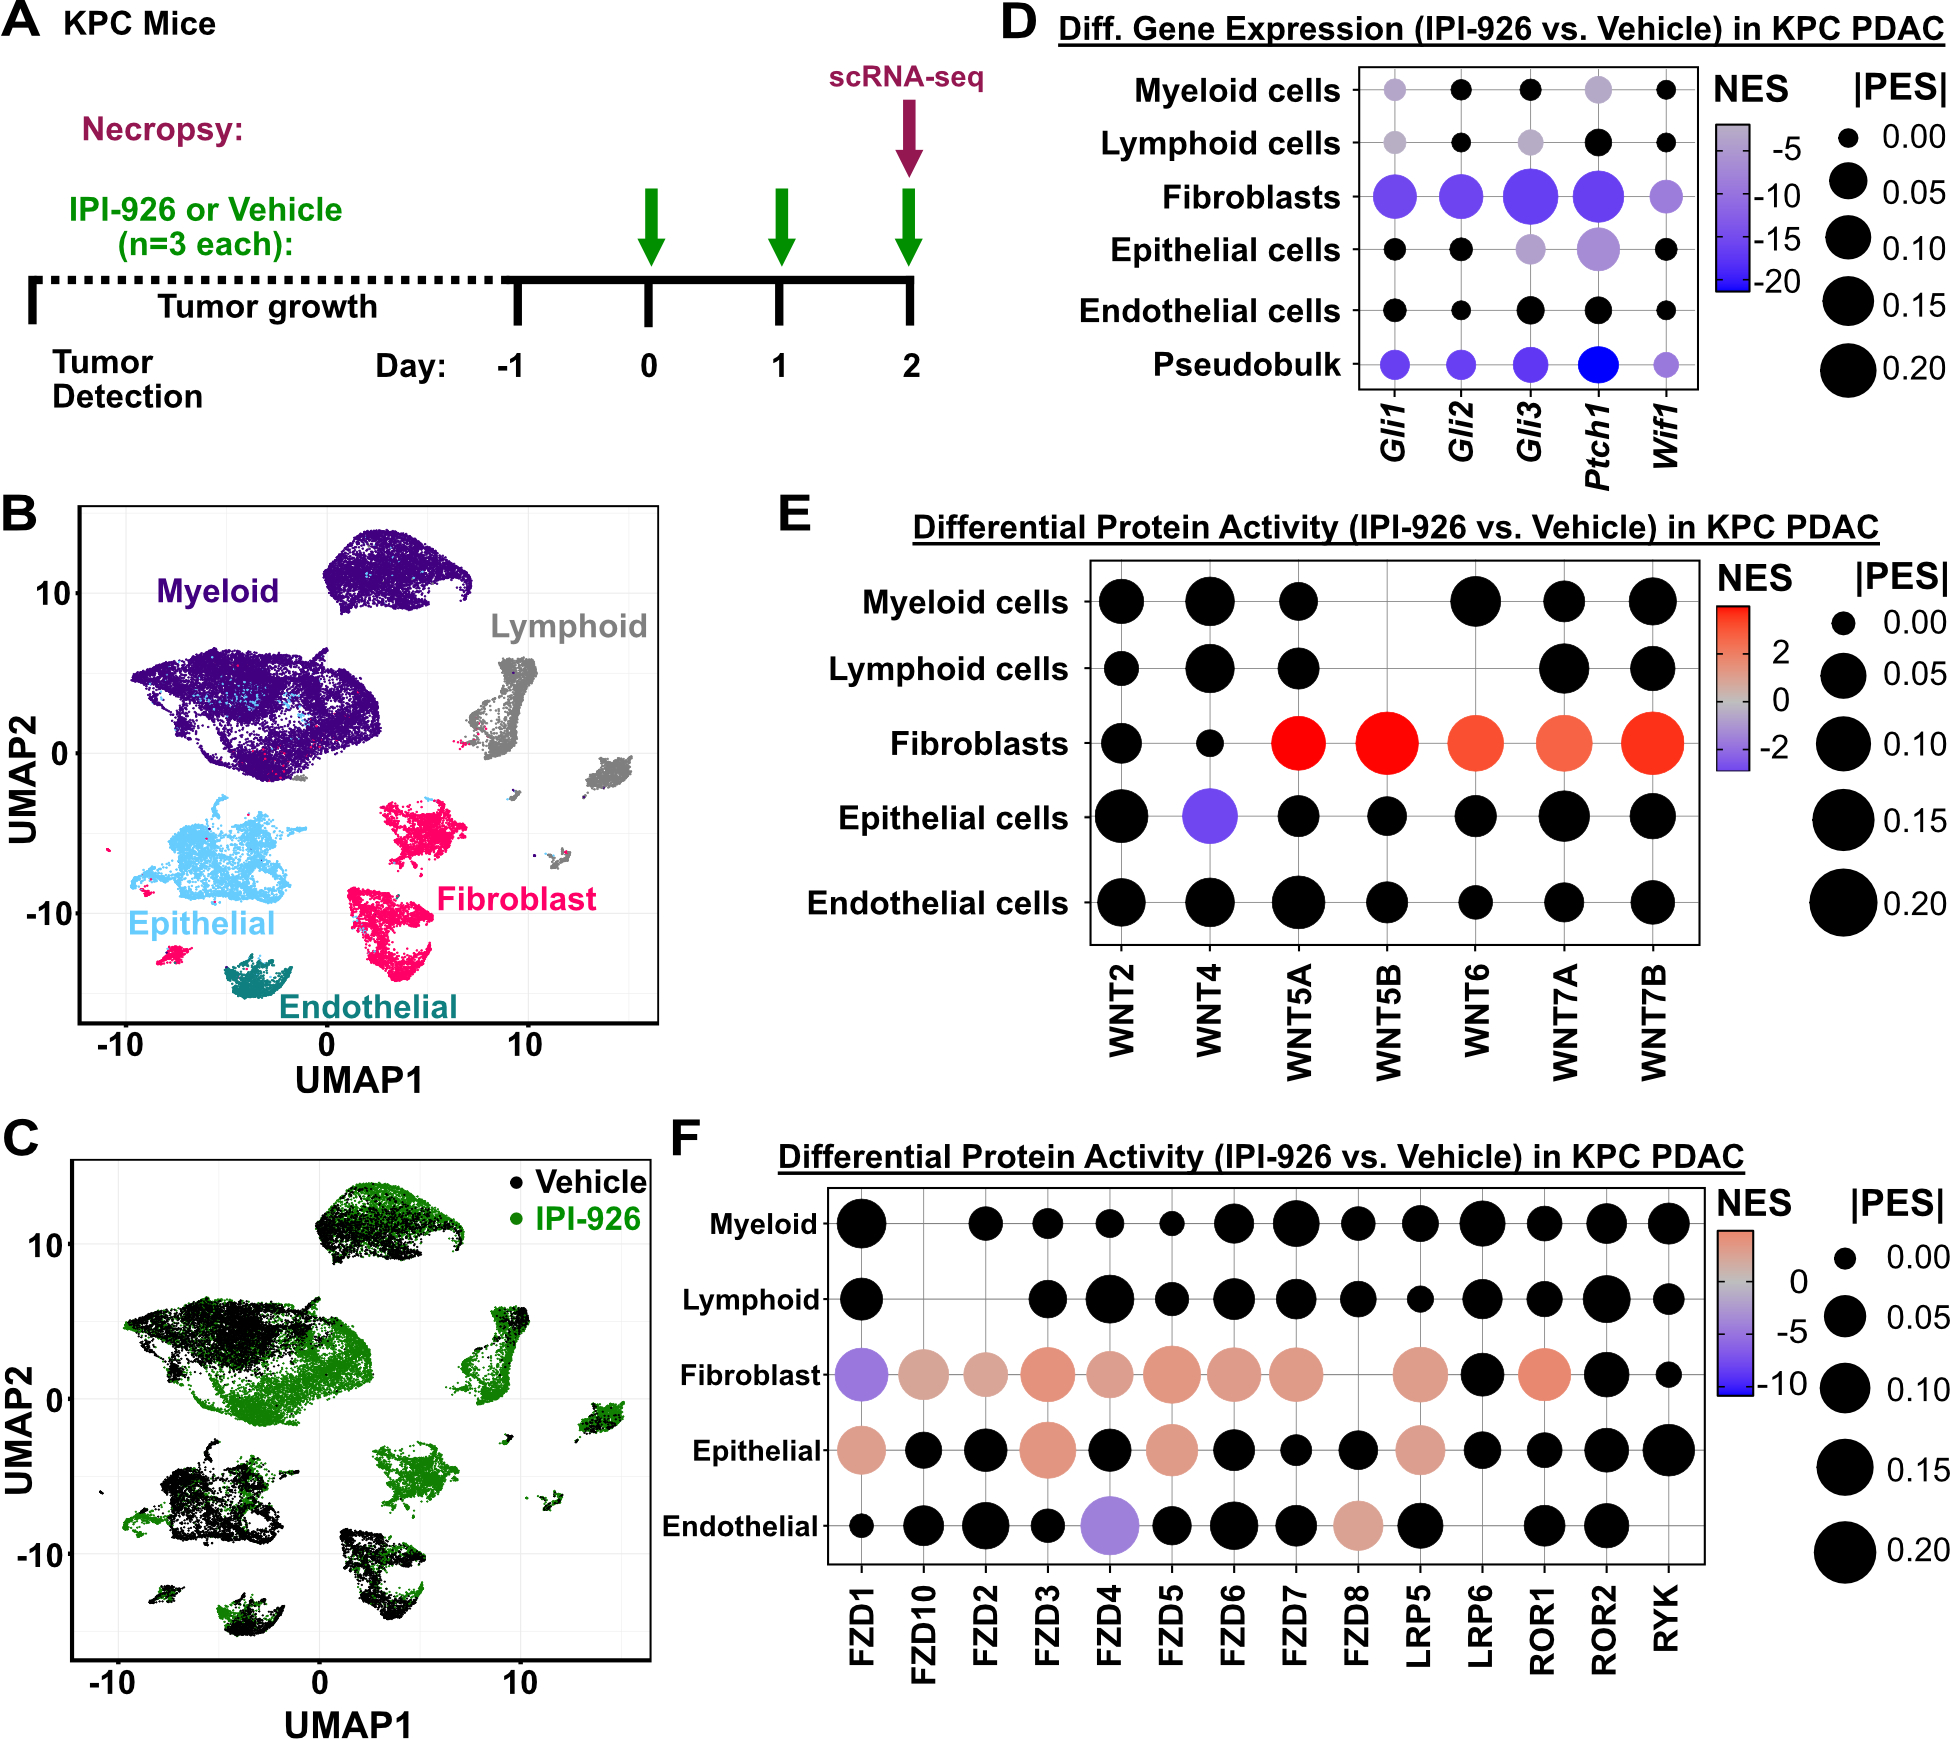
The sparse vascularity of pancreatic ductal adenocarcinoma (PDAC) presents a mystery: What prevents this aggressive malignancy from undergoing neoangiogenesis to counteract hypoxia and better support growth? An incidental finding from prior work on paracrine communication between malignant PDAC cells and fibroblasts revealed that inhibition of the Hedgehog (HH) pathway partially relieved angiosuppression, increasing tumor vascularity through unknown mechanisms. Initial efforts to study this phenotype were hindered by difficulties replicating the complex interactions of multiple cell types in vitro. Here we identify a cascade of paracrine signals between multiple cell types that act sequentially to suppress angiogenesis in PDAC. Malignant epithelial cells promote HH signaling in fibroblasts, leading to inhibition of noncanonical WNT signaling in fibroblasts and epithelial cells, thereby limiting VEGFR2-dependent activation of endothelial hypersprouting. This cascade was elucidated using human and murine PDAC explant models, which effectively retain the complex cellular interactions of native tumor tissues.

Significance: We present a key mechanism of tumor angiosuppression, a process that sculpts the physiologic, cellular, and metabolic environment of PDAC. We further present a computational and experimental framework for the dissection of complex signaling cascades that propagate among multiple cell types in the tissue environment. This article is featured in Selected Articles from This Issue, p. 201.


Conflict of interest statement

Conflict of Interest Disclosure Statement

A.C. is founder, equity holder, and consultant of DarwinHealth Inc., which has licensed some of the algorithms used in this manuscript from Columbia University. Columbia University is also an equity holder in DarwinHealth Inc.

Figures

Figure 1.
Figure 1.
SMO inhibition abrogates SHH-induced WIF1 expression in CAFs. A, Tumors from KPC mice treated for the indicated times points with either vehicle or IPI-926 (40 mg/kg) (n=5–8) were stained for the vessel marker EMCN. Quantification of vessel count based on 12 40x fields of view (light dots), averaged per tumor (dark dots), and compared by one-way ANOVA with Tukey correction (*, p<0.05; ***, p<0.001). B, Colocalization of pVEGFR2 foci and EMCN as evaluated via co-IF. Quantification of pVEGFR2 foci per EMCN+ vessel based on 10 fields of view (light dots), averaged per tumor (dark dots), compared by one-way ANOVA with Tukey correction (*, p<0.05). C, Diagram of KPC mouse treatments with vehicle or IPI-926 (40 mg/kg) (n=10 each) for tumor biopsy/necropsy study. D, Tumor necropsy samples were stained for EMCN, evaluating mean vessel density (n=9–10). Quantification of vessel count based on 12 fields of view (light shade), averaged per tumor (dark shade), compared by student t-test (**, p<0.01). E, Co-IF of pVEGFR2 foci at EMCN+ vessels (n=5). Quantification of pVEGFR2 foci per EMCN+ vessel based on 10 fields of view (light shade), averaged per tumor (dark shade), compared by student t-test (*, p<0.05). F, Significantly regulated genes (green) comparing IPI-926-treated necropsy samples normalized to matching biopsies to HPBCD controls (n=10 each). G, Downregulation of HH-responsive genes upon SMO inhibition. Log2 Fold Change of necropsy samples normalized to matching biopsies. Significance indicated (**, p<0.01; ***, p<0.005), based on raw p values, FDR threshold 1.5. H, ChIP for GLI1 followed by qRT-PCR on the WIF1 promoter (n=3) in FPI34 cells, compared by paired t-test (*, p<0.01). Mean and SD are displayed. I, Representative image of WIF1 staining in KPC-derived tumors treated with 40 mg/kg IPI-926 for 10 days. Scale = 50μm. J, QRT-PCR-based expression analysis of Gli1, Wif1, and VEGF-A in murine fibroblasts in response to treatment with SHH conditioned medium (n=4). Data are normalized to samples treated with SHH-CM. compared by student t-tests (**, p<0.01), mean and SD are shown.
Figure 2.
Figure 2.
Human and murine PDAC explants maintain tissue architecture, viability, and cellular diversity. A, Schematic of human and KPC mouse PDAC explants processing and culturing. B, Explant bulk metabolic viability over time as assayed by Alamar Blue (n=5 each). Error bars, SD. C, Representative images of Hematoxylin & Eosin (H&E) staining for tissue architecture. Scale = 50μm. D, Murine and human explant time points were stained for various IHC markers for viability (Ki67, proliferation, and CC3, apoptosis) and cell populations (CK19, malignant epithelia; EMCN/CD31, vasculature; Podoplanin, pan-fibroblast; CD3, pan T-cells; CD11b, pan myeloid cells). All quantification time points included day 0, 1, 3 and 5 for murine explants and day 0, 1, 3, 5, and 7 for human explants (n=5 each). Quantification of IHC staining was based on 10–12 fields of view, of which the averaged values per sample per timepoint are represented in the heat maps normalized to day 0 value, compared with two-way ANOVA tests with Dunnett’s correction (*, p<0.05; **, p<0.01; ***, p<0.005; ****, p<0.0001).
Figure 3.
Figure 3.
SMO inhibition increases vessel count and induces endothelial hypersprouting in murine and human PDAC explants. A, KPC explants treated with DMSO, 1μM IPI-926, or 1μM LDE225, ex vivo vessel count using EMCN staining (n=6). Quantification based on 7–12 fields of view (light shade), averaged per tumor (dark shade), compared by one-way ANOVA tests with Tukey correction (*, p<0.05; **, p<0.01). B, Human explants treated with DMSO, 1μM IPI-926, or 1μM LDE225, ex vivo vessel count using CD31 staining. Quantification based on 7–12 fields of view (light shade), averaged per tumor (dark shade), compared by one-way ANOVA tests with Tukey correction (*, p<0.05; ***, p<0.001). C, Co-IF for pVEGFR2/EMCN on KPC explants (n=6). Quantification based on 5–10 fields of view (light shade), averaged per tumor (dark shade), compared by one-way ANOVA tests with Tukey correction (***, p<0.001). D, Co-IF for pVEGFR2/CD31 on human PDAC explants (n=6). Quantification based on 5–10 fields of view (light shade), averaged per tumor (dark shade), compared by one-way ANOVA tests with Tukey correction (***, p<0.001).
Figure 4.
Figure 4.
WIF1 blocks WNT5A-induced angiogenesis. A, KPC explants treated for 2d with DMSO, 1μM IPI-926, or 1μM LDE225, co-IF for pVEGFR2/EMCN (n=5). Quantification based on 5–10 fields of view (light shade), averaged per tumor (dark shade) compared by one-way ANOVA test with Tukey correction (**, p<0.01; ***, p<0.001). B, Human explants treated for 2d with DMSO, 1μM IPI-926, or 1μM LDE225, co-IF for pVEGFR2/CD31 (n=5). Quantification based on 5–10 fields of view (light shade), averaged per tumor (dark shade) compared by one-way ANOVA test with Tukey correction (***, p<0.001). C, Human explants treated for 2d with DMSO, 1μM IPI-926; additional treatment with 100nM WNT-C59 or 250μg/ml bevacizumab are indicated. Co-IF for pVEGFR2/CD31 (n=3). Quantification based on 7–10 fields of view (light shade), averaged per tumor (dark shade) compared by one-way ANOVA test with Tukey correction (*, p<0.05; **, p<0.01; ***, p<0.001). D, QRT-PCR for VEGF-A expression in murine macrophages, epithelial tumor cells, and fibroblasts after 24h treatment with 150ng and 375ng recombinant WNT5A protein (n=3), compared by one-way ANOVA tests with Tukey correction (*, p<0.05). Mean and SD are shown. E, KPC explants incubated ex vivo under indicated conditions for 2d (750ng rWNT5A, 1μg rWIF1), co-IF for pVEGFR2/EMCN (n=5). Quantification based on 5–10 fields of view (light shade), averaged per tumor (dark shade), compared by one-way ANOVA test with Tukey correction (**, p<0.01). F, Human PDAC explants incubated ex vivo under indicated conditions for 2d (750ng rWNT5A, 1μg rWIF1), co-IF for pVEGFR2/CD31 (n=6). Quantification based on 5–10 fields of view (light shade), averaged per tumor (dark shade) compared by one-way ANOVA test with Tukey correction for multiple comparisons (**, p<0.01).
Figure 5.
Figure 5.
Single cell analyses of KPC pancreatic tumors in response to SMO inhibition. A, Diagram of KPC mouse single cell study. Tumor-bearing KPC mice were identified by ultrasound, treated for two days with 40mg/kg IPI-926 or vehicle control, and harvested 2 hours after the final treatment for scRNA-seq of tumor tissues. B, UMAP clustering of cells from KPC pancreatic tumors, with cell type assignments. C, UMAP clustering of cells from vehicle or IPI-926-treated tumors (n=3 each). D, Differential expression of HH-pathway genes comparing IPI-926 to vehicle, in each major cell type. Black dots indicate non-significant differences (p>0.05) according to Mann-Whitney U test. Pseudobulk shows all cells together. E, Differential regulatory protein activity analysis shows changes in the inferred activity of WNT ligands, comparing IPI-926 to vehicle, in each major cell type. No dots are displayed for ligands whose activity could not be calculated. Black dots indicate non-significant differences (p>0.05). F, Differential regulatory protein activity analysis shows changes in the inferred activity of WNT receptors, comparing IPI-926 to vehicle, in each major cell type. No dots are displayed for receptors whose activity could not be calculated in that cell type. Black dots indicate non-significant differences (p>0.05).

References

    1. Neesse A, Michl P, Frese KK, Feig C, Cook N, Jacobetz MA, et al. Stromal biology and therapy in pancreatic cancer. Gut 2011;60(6):861–8 doi 10.1136/gut.2010.226092. - DOI - PubMed
    1. Jacobetz MA, Chan DS, Neesse A, Bapiro TE, Cook N, Frese KK, et al. Hyaluronan impairs vascular function and drug delivery in a mouse model of pancreatic cancer. Gut 2013;62(1):112–20 doi 10.1136/gutjnl-2012-302529. - DOI - PMC - PubMed
    1. Provenzano PP, Cuevas C, Chang AE, Goel VK, Von Hoff DD, Hingorani SR. Enzymatic targeting of the stroma ablates physical barriers to treatment of pancreatic ductal adenocarcinoma. Cancer Cell 2012;21(3):418–29 doi 10.1016/j.ccr.2012.01.007. - DOI - PMC - PubMed
    1. Olive KP, Jacobetz MA, Davidson CJ, Gopinathan A, McIntyre D, Honess D, et al. Inhibition of Hedgehog signaling enhances delivery of chemotherapy in a mouse model of pancreatic cancer. Science 2009;324(5933):1457–61 doi 10.1126/science.1171362. - DOI - PMC - PubMed
    1. Kahn BM, Lucas A, Alur RG, Wengyn MD, Schwartz GW, Li J, et al. The vascular landscape of human cancer. J Clin Invest 2021;131(2) doi 10.1172/JCI136655. - DOI - PMC - PubMed

Substances