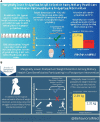
The potential for graphical abstracts to enhance science communication
- PMID: 37966942
- PMCID: PMC10724116
- DOI: 10.1093/tbm/ibad069
The potential for graphical abstracts to enhance science communication
Abstract
Science communication, including formats such as podcasts, news interviews, or graphical abstracts, can contribute to the acceleration of translational research by improving knowledge transfer to patient, policymaker, and practitioner communities. In particular, graphical abstracts, which are optional for articles published in Translational Behavioral Medicine as well as many other journals, are created by authors of scientific articles or by editorial staff to visually present a study's design, findings, and implications, to improve comprehension among non-academic audiences. The use of graphical abstracts in scientific journals has increased in the past 10-15 years; however, most scientists are not trained in how to develop them, which presents a challenge for creating graphical abstracts that engage the public. In this article, the authors describe graphical abstracts and offer suggestions for their construction based on the extant literature. Specifically, graphical abstracts should use a solid background, employ an easily readable font, combine visuals with words, convey only the essential study design information and 1-3 "take-home" points, have a clear organizational structure, contain restrained and accessible use of color, use single-color icons, communicate ways to access the full-text article, and include the contact information for the lead author. Authors should obtain feedback on graphical abstract drafts prior to dissemination. There is emerging research on the benefits of graphical abstracts in terms of impact and engagement; however, it will be essential for future research to determine how to optimize the design of graphical abstracts, in order to engage patient, policymaker, and practitioner communities in improving behavioral health.
Keywords: access to information; communications media; health communication; information dissemination; public health; publications; scholarly communication.
Plain language summary
It is important that scientists find ways to make their discoveries easier to understand by the public to help turn research into action. Graphical abstracts are a fairly new strategy for communicating science using pictures and words. They focus on just the important details of the study and the key points to remember. In this article, we describe the existing research about how to create engaging graphical abstracts. For example, graphical abstracts should have clear organization, use a solid background, employ an easily readable font, use simple pictures, contain restrained and accessible use of color, provide access the full article, and include the contact information for the lead author. Authors should get feedback on the graphical abstract prior to sharing it. We also discuss how graphical abstracts may improve access to research discoveries. However, more research is necessary on how to improve the design of graphical abstracts, to better engage patient, policymaker, and provider communities in improving health.
© Society of Behavioral Medicine 2023. All rights reserved. For permissions, please e-mail: journals.permissions@oup.com.
Conflict of interest statement
None declared.
Figures

References
-
- Mohammadi E, Thelwall M, Haustein S, et al. . Who reads research articles? An altmetrics analysis of Mendeley user categories. J Assoc Inf Sci Technol 2015;66:1832–46. 10.1002/asi.23286 - DOI
-
- Lazard A, Atkinson L.. Putting environmental infographics center stage: the role of visuals at the elaboration likelihood model’s critical point of persuasion. Sci Commun 2015;37:6–33. 10.1177/1075547014555997 - DOI
-
- Yoon J, Chung E.. An investigation on graphical abstracts use in scholarly articles. Int J Inf Manage 2017;37:1371–9. 10.1016/j.ijinfomgt.2016.09.005 - DOI
MeSH terms
Grants and funding
LinkOut - more resources
Full Text Sources
Miscellaneous

