. 2023 Nov 17;9(46):eadi6488.
doi: 10.1126/sciadv.adi6488. Epub 2023 Nov 15.

Promotion of uterine reconstruction by a tissue-engineered uterus with biomimetic structure and extracellular matrix microenvironment

Affiliations

Promotion of uterine reconstruction by a tissue-engineered uterus with biomimetic structure and extracellular matrix microenvironment

Long-Mei Zhao et al. Sci Adv. .

Abstract

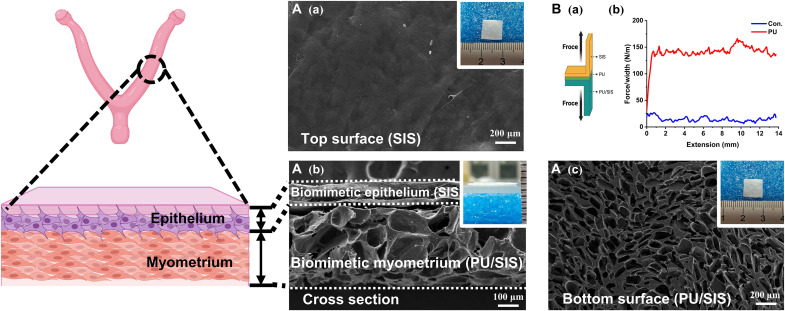
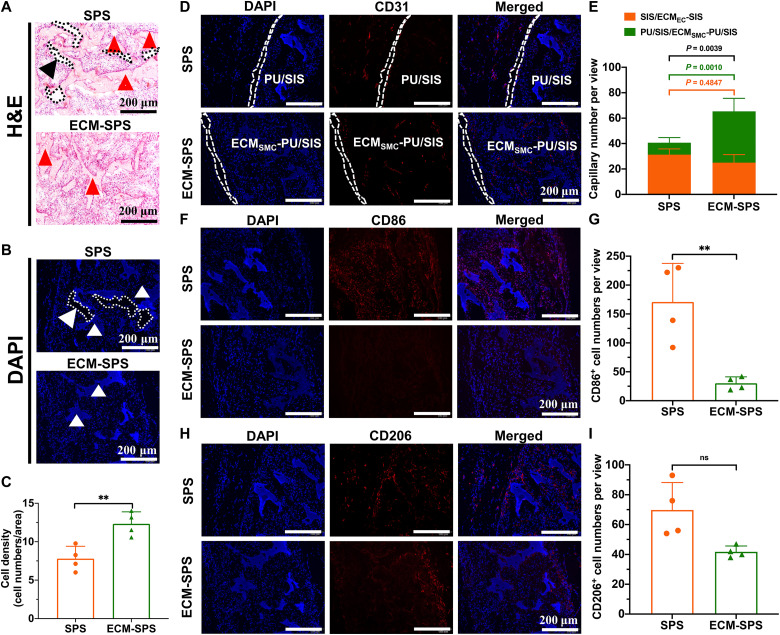
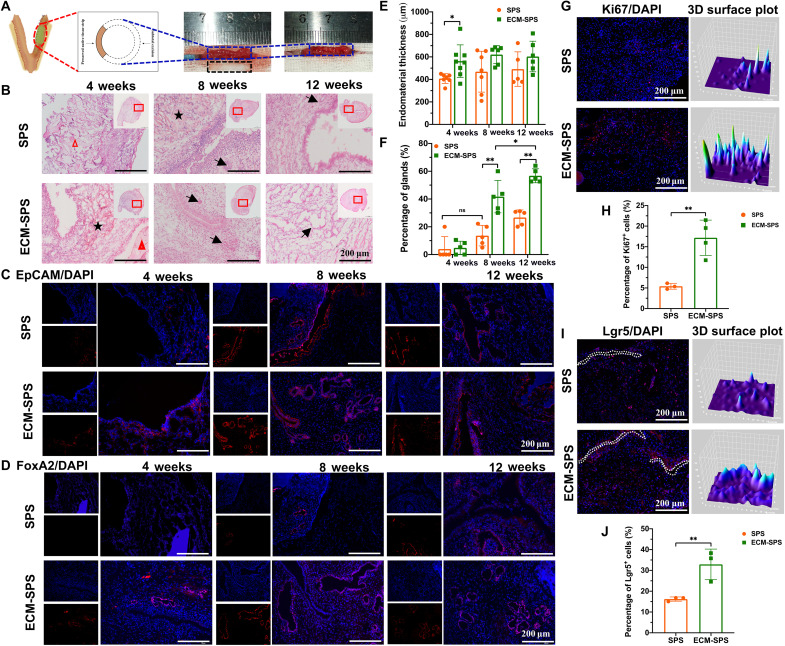
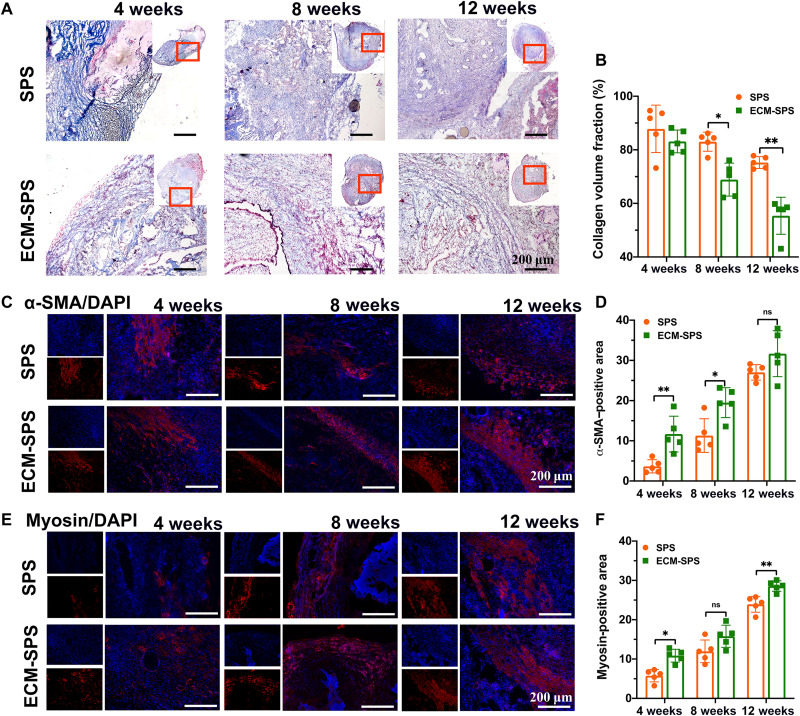
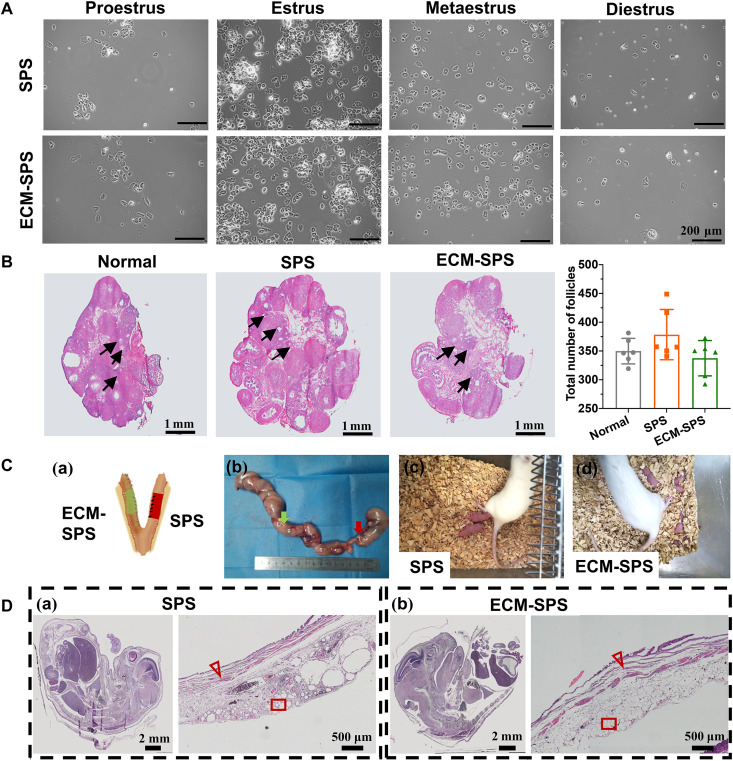
The recurrence rate for severe intrauterine adhesions is as high as 60%, and there is still lack of effective prevention and treatment. Inspired by the nature of uterus, we have developed a bilayer scaffold (ECM-SPS) with biomimetic heterogeneous features and extracellular matrix (ECM) microenvironment of the uterus. As proved by subtotal uterine reconstruction experiments, the mechanical and antiadhesion properties of the bilayer scaffold could meet the requirement for uterine repair. With the modification with tissue-specific cell-derived ECM, the ECM-SPS had the ECM microenvironment signatures of both the endometrium and myometrium and exhibited the property of inducing stem cell-directed differentiation. Furthermore, the ECM-SPS has recruited more endogenous stem cells to promote endometrial regeneration at the initial stage of repair, which was accompanied by more smooth muscle regeneration and a higher pregnancy rate. The reconstructed uterus could also sustain normal pregnancy and live birth. The ECM-SPS may thereby provide a potential treatment for women with severe intrauterine adhesions.


Figures

Fig. 1.
Fig. 1.. Preparation of the bilayered SPS composites biomimicking the uterine structure.
(A) Scanning electron microscope (SEM) images of the top [(Aa) scale bar, 200 μm)] cross-sectional [(Ab) scale bar, 100 μm], and bottom [(Ac) scale bar, 200 μm] micromorphology of the SPS composites. Inside the white frame is the macroscopic morphology of the SPS. (B) Schematic of the 180° peel test (Ba). The force-extension curves of the bilayered SPS composites (Bb).
Fig. 2.
Fig. 2.. Preparation and evaluation of the ECM-modified scaffold.
(A) The procedures for the preparation of the ECMEC-SIS and ECMSMC-PU/SIS scaffolds. (B) The morphology and microstructure of the scaffold before and after the decellularization by SEM. Scale bars, 40 μm. Inside the white frame is the water contact angle. (C) 4′,6-diamidino-2-phenylindole (DAPI) staining of the scaffold before and after the decellularization. Scale bar, 50 μm. The circles marked the nucleus. (D) The residual DNA content of the ECMEC-SIS before and after the decellularization (n = 4 independent samples, **P < 0.01). (E) The residual DNA content of the ECMSMC-PU/SIS before and after the decellularization (n = 4 independent samples, **P < 0.01). (F) The water contact angle of the ECMEC-SIS and ECMSMC-PU/SIS scaffolds (n = 3, **P < 0.01). ns, not significant. (G) The elastic modulus of the ECMEC-SIS and ECMSMC-PU/SIS scaffolds as detected by an atomic force microscope. (H) Quantification of total proteins (n = 5 independent samples, **P < 0.01), collagen (n = 6 independent samples, *P < 0.05 and **P < 0.01), and GAGs (n = 6 independent samples, ns) in the ECMEC-SIS and ECMSMC-PU/SIS scaffolds. (I) The content of EGF (n = 4 independent samples, **P < 0.01), HGF (n = 3 independent samples, **P < 0.01 and *P < 0.05), TGF-β (n = 3 independent samples, *P < 0.05 and ns), and PDGF-BB (n = 4 independent samples, **P < 0.01 and ns) in the ECMEC-SIS and ECMSMC-PU/SIS scaffolds as determined by enzyme-linked immunosorbent assay (ELISA) analysis.
Fig. 3.
Fig. 3.. Quantitative proteomic analysis of the ECMEC-SIS and ECMSMC-PU/SIS.
(A) Scheme of dECM protein digestion of the ECMEC-SIS and ECMSMC-PU/SIS and subsequent mass spectrometry characterization. LC-MS, liquid chromatography–mass spectrometry. (B) Venn diagram of the protein numbers for the ECMEC-SIS and ECMSMC-PU/SIS. (C and D) Matrisome signatures of the ECMEC-SIS (C) and ECMSMC-PU/SIS (D). Pie chart represents the distribution of proteins by percentage of total number for each matrisome protein subcategory. (E) The label free quantified (LFQ) expression of partial ECM proteins in ECMEC-SIS and ECMSMC-PU/SIS (n = 3 independent samples, *P < 0.05 and **P < 0.01). (F) Gene ontology term enrichment analysis of the biological processes. (G) Gene set enrichment analysis of ECMEC-SIS and ECMSMC-PU/SIS [|normalized enrichment score| (|NES|) > 1, nominal (NOM) P < 0.05, and false discovery rate (FDR) q < 0.25 were set as the significant thresholds].
Fig. 4.
Fig. 4.. Behaviors of the MSCs as regulated by the ECMEC-SIS and ECMSMC-PU/SIS in vitro.
(A) The numbers of cells attached to the ECMEC-SIS (scale bar, 100 μm) and ECMSMC-PU/SIS were determined by DAPI staining (scale bar, 50 μm). The circles have marked the nuclei. (B) Quantification of cell number attached to the scaffold (n = 6 independent samples, *P < 0.05 and **P < 0.01). (C) The proliferation curve of the MSCs cultured with extracts of the ECMEC-SIS and ECMSMC-PU/SIS as evaluated by the CCK-8 assay (n = 5 independent samples, **P < 0.01). (D) Relative mRNA expression of CK18 and E-Cadherin in the MSCs cultured with the SIS or ECMEC-SIS (n = 3 independent samples, **P < 0.01). (E) Immunofluorescence staining of CK18 (Ea) and E-Cadherin (Eb) in the MSCs cultured with the SIS or ECMEC-SIS. Scale bars, 50 μm. (F) Relative mRNA expression of α-SMA and myosin in the MSCs with the PU/SIS or ECMSMC-PU/SIS (n = 3 independent samples, **P < 0.01 and ns). (G) Immunofluorescence staining of α-SMA (Ga) and myosin (Gb) in the MSCs with the PU/SIS or ECMSMC-PU/SIS. Scale bars, 50 μm.
Fig. 5.
Fig. 5.. In vivo cellularization, vascularization and immunogenic properties of the SPS and ECM-SPS 4 weeks after the surgery.
(A) H&E and (B) DAPI staining of the cross sections showing cell infiltration within the SPS and ECM-SPS. The arrowheads indicated the scaffolds, and the dotted lines marked the blank area between the SPS and surrounding tissue. Scale bars, 200 μm. (C) Quantification of cell numbers within the SPS and ECM-SPS (n = 4 independent samples, **P < 0.01 and ns). (D) CD31 immunofluorescent staining showing vascularization within the scaffolds. The SIS layer and ECMEC-SIS layer were marked with the dashed lines. Scale bars, 200 μm. (E) Quantification of capillaries number within the SPS and ECM-SPS (n = 4 independent samples, *P < 0.05, **P < 0.01, and ns; orange represents SIS group or ECMEC-SIS group, and green represents PU/SIS group or ECMSMC-PU/SIS group). (F) M1 macrophages as detected by CD86 immunofluorescence staining. Scale bars, 200 μm. (G) Quantification of CD86 positive cell numbers within the SPS and ECM-SPS (n = 4 independent samples, **P < 0.01). (H) M2 macrophages as detected by CD206 immunofluorescence staining. Scale bars, 200 μm. (I) Quantification of CD206-positive cell numbers within the SPS and ECM-SPS (n = 4 independent samples, ns).
Fig. 6.
Fig. 6.. The endometrial effects of various interventions on the epithelium and gland regeneration.
(A) Schematic drawing of the subtotal uterine excision (blue dashed box) and scaffold (black dashed box) implantation procedures. (B) H&E staining of reconstructed uterine segments. Inserts are the corresponding gross views, and the magnified regions are marked with red squares. The black arrows indicated the glands. The pentagram indicated the SIS or ECMEC-SIS. The triangle represented the PU/SIS or ECMSMC-PU/SIS. Scale bars, 200 μm. (C) Immunostaining of EpCAM for endometrium regeneration in the reconstructed uterine segments. Scale bars, 200 μm. (D) Immunostaining of FoxA2 for endometrium glands in the reconstructed uterine segments. Scale bars, 200 μm. (E) Statistical analysis of average endometrial thickness (n = 5 independent samples, *P < 0.05). (F) Statistical analysis of the percentage of glands (n = 5 independent samples, *P < 0.05, **P < 0.01, and ns). (G) Immunostaining of Ki67 for cell proliferation 7 days after the implantation. Scale bars, 200 μm. The 3D surface plot has represented the distribution and fluorescence intensity of the Ki67-positive cells. (H) Statistical analysis of the percentages of Ki67-positive cells (n = 3 independent samples, **P < 0.01). (I) Immunostaining of Lgr5 for endogenous MSCs distribution 7 day after the implantation. Scale bars, 200 μm. The dotted white lines indicate the top layer of SPS or ECM-SPS. The 3D surface plot represents the distribution and fluorescence intensity of Lgr5-positive cells. (J) Statistical analysis of the percentages of Lgr5-positive cells (n = 3 independent samples, **P < 0.01).
Fig. 7.
Fig. 7.. The collagen remodeling and smooth muscle regeneration by various interventions.
(A) Masson’s trichrome staining of the reconstructed uterine segments. Scale bars, 200 μm. (B) Statistical analysis of collagen volume fraction on the Masson’s trichrome–stained slides (n = 5 independent samples, *P < 0.05 and **P < 0.01). (C) Immunostaining of α-SMA for myometrium regeneration in the reconstructed uterine segments. Scale bars, 200 μm. (D) Statistical analysis of α-SMA–positive area (n = 5 independent samples, *P < 0.05, **P < 0.01, and ns). (E) Immunostaining of myosin for myometrium regeneration in the reconstructed uterine segments. Scale bars, 200 μm. (F) Statistical analysis of myosin positive area (n = 5 independent samples, *P < 0.05, **P < 0.01, and ns).
Fig. 8.
Fig. 8.. Fertility restoration of the reconstructed uterine.
(A) Vaginal smears which may reflect the changes in postoperative estrous cycles. Scale bars, 200 μm. (B) Histological analysis of the ovarian morphology and statistical analysis of the follicle numbers (n = 6 independent samples). Scale bars, 1 mm. (C) General view of the rat uterus containing embryos from the SPS (right, red arrow) and ECM-SPS (left, green arrow) groups (Ca). The arrows indicated scaffold (Cb). Images of the mother and newborn rats [(Cc) and (Cd)]. (D) H&E staining of the cross sections of the embryos (left; scale bars, 2 mm) and pregnant bioengineered uterus (right; scale bars, 500μm). The triangles represent myometrium, and rectangles represent decidualized endometrium.

References

    1. AAGL Elevating Gynecologic Surgery , AAGL practice report: Practice guidelines on intrauterine adhesions developed in collaboration with the European Society of Gynaecological Endoscopy (ESGE). Gynecol. Surg. 14, 6 (2017). - PMC - PubMed
    1. Salazar C. A., Isaacson K., Morris S., A comprehensive review of Asherman’s syndrome: Causes, symptoms and treatment options. Curr. Opin. Obstet. Gynecol. 29, 249–256 (2017). - PubMed
    1. Zhang X., Liu W., Zhou Y., Qiu J., Sun Y., Li M., Ding Y., Xi Q., Comparison of therapeutic efficacy of three methods to prevent re-adhesion after hysteroscopic intrauterine adhesion separation: A parallel, randomized and single-center trial. Ann. Palliat. Med. 10, 6804–6823 (2021). - PubMed
    1. Wang L., Yu C., Chang T., Zhang M., Song S., Xiong C., Su P., Xiang W., In situ repair abilities of human umbilical cord-derived mesenchymal stem cells and autocrosslinked hyaluronic acid gel complex in rhesus monkeys with intrauterine adhesion. Sci. Adv. 6, eaba6357 (2020). - PMC - PubMed
    1. Yin Z., Wang J., Cui W., Tong C., Advanced biomaterials for promoting endometrial regeneration. Adv. Healthc. Mater. 12, e2202490 (2023). - PubMed