. 2023 Nov 15;15(722):eadf6732.
doi: 10.1126/scitranslmed.adf6732. Epub 2023 Nov 15.

Targeting DNA methylation and B7-H3 in RB1-deficient and neuroendocrine prostate cancer

Affiliations

Targeting DNA methylation and B7-H3 in RB1-deficient and neuroendocrine prostate cancer

Yasutaka Yamada et al. Sci Transl Med. .

Abstract

Aberrant DNA methylation has been implicated as a key driver of prostate cancer lineage plasticity and histologic transformation to neuroendocrine prostate cancer (NEPC). DNA methyltransferases (DNMTs) are highly expressed, and global DNA methylation is dysregulated in NEPC. We identified that deletion of DNMT genes decreases expression of neuroendocrine lineage markers and substantially reduced NEPC tumor development and metastasis in vivo. Decitabine, a pan-DNMT inhibitor, attenuated tumor growth in NEPC patient-derived xenograft models, as well as retinoblastoma gene (RB1)-deficient castration-resistant prostate adenocarcinoma (CRPC) models compared with RB1-proficient CRPC. We further found that DNMT inhibition increased expression of B7 homolog 3 (B7-H3), an emerging druggable target, via demethylation of B7-H3. We tested DS-7300a (i-DXd), an antibody-drug conjugate targeting B7-H3, alone and in combination with decitabine in models of advanced prostate cancer. There was potent single-agent antitumor activity of DS-7300a in both CRPC and NEPC bearing high expression of B7-H3. In B7-H3-low models, combination therapy of decitabine plus DS-7300a resulted in enhanced response. DNMT inhibition may therefore be a promising therapeutic target for NEPC and RB1-deficient CRPC and may sensitize B7-H3-low prostate cancer to DS-7300a through increasing target expression. NEPC and RB1-deficient CRPC represent prostate cancer subgroups with poor prognosis, and the development of biomarker-driven therapeutic strategies for these populations may ultimately help improve patient outcomes.


Conflict of interest statement

Competing interests: Daiichi Sankyo provided drug and grant funding for part of this study and had no role in study design, data collection and analysis, decision to publish, or preparation of the manuscript. H.B. has served as consultant/advisory board member for Janssen, Astellas, Merck, Pfizer, Foundation Medicine, Blue Earth Diagnostics, Amgen, Bayer, Oncorus, LOXO, Daiichi Sankyo, Sanofi, Curie Therapeutics, Novartis, and Astra Zeneca and has received research funding from Janssen, AbbVie/Stemcentrx, Eli Lilly, Astellas, Millennium, Bristol Myers Squibb, Circle Pharma, and Daiichi Sankyo. The other authors declare that they have no competing interests.

Figures

Fig. 1.
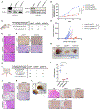
Fig. 1.. DNA methyltransferase expression in prostate cancer.
(A) DNMT1, DNMT3A, and DNMT3B mRNA expression in benign prostate (n = 29), PCA (n = 75), CRPC-Adeno (n = 73), and NEPC (n = 36). Two-tailed t test was used. FPKM, fragments per kilobase of exon per million mapped reads. (B) DNMT1, DNMT3A, and DNMT3B mRNA expression in NEPC. Two-tailed t test was used. (C) A survey of DNMT mRNA expression across six prostate cell lines, organoids, and PDX models. (D) Correlation of DNMT expression and NEPC score in the International SU2C/PCF Dream Team dataset (11). (E) Representative IHC images of PCA, CRPC-Adeno, and NEPC stained by hematoxylin and eosin (H&E) and with CHGA, AR, DNMT1, DNMT3A, and DNMT3B antibodies. Scale bars, 100 μm. *P < 0.05, **P < 0.01, ****P < 0.0001. TPM, transcripts per million.
Fig. 2.
Fig. 2.. DNMT knockout in vitro and in vivo.
(A) DNMT1/DNMT3A protein expression after DNMT1/3A knockout in WCM154 (NEPC) cells. GAPDH, glyceraldehyde phosphate dehydrogenase. (B) Cell viability analyses in WCM154 sgGFP, sgDNMT1, and sgDNMT3A cells. A two-way ANOVA test was used. (C) Subcutaneous injection of mice with 1 × 10⁷ cells and tumor appearance ratio in WCM154 sgGFP, sgDNMT1, and sgDNMT3A. (D) Postinjection time and tumor volumes in WCM154 sgGFP, sgDNMT1, and sgDNMT3A. A two-way ANOVA test was used. (E) Representative IHC images of WCM154 sgGFP, sgDNMT1, and sgDNMT3A tumors stained by H&E. Scale bars, 100 μm. (F) Representative IHC images of WCM154 sgGFP, sgDNMT1, and sgDNMT3A tumors stained by DNMT1 and DNMT3A. Scale bars, 100 μm. (G) Orthotopic injection in murine prostate with 2 × 10⁵ cells and tumor appearance and liver metastasis ratio in WCM154 sgGFP, sgDNMT1, and sgDNMT3A. (H) Representative images of murine prostate injected with WCM154 sgGFP, sgDNMT1, and sgDNMT3A cells. (I) Weights of gGU system injected with WCM154 sgGFP, sgDNMT1, and sgDNMT3A cells. A two-tailed t test was used. (J) Representative IHC images of murine prostate injected with WCM154 sgGFP, sgDNMT1, and sgDNMT3A cells stained by H&E. Scale bars, 100 μm. (K) Representative IHC images of murine prostate injected with WCM154 sgGFP and sgDNMT3A cells stained by DNMT3A. Scale bars, 100 μm. (L) Multiple liver metastatic lesions generated from murine prostate injected with WCM154 sgGFP cells (left). Representative IHC images of liver metastatic tumors stained by H&E, DNMT1, DNMT3A, CHGA, and SYP. Scale bars, 100 μm. **P < 0.01, ****P < 0.0001.
Fig. 3.
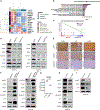
Fig. 3.. DNA methylation and NE lineage progression.
(A) Heatmap of DNMT mRNA gene expression, NEPC markers, apoptosis marker, and cell proliferation markers in WCM154 sgGFP, sgDNMT1, and sgDNMT3A cells. (B) GO enrichment analysis in down-regulated genes after DNMT1 knockout. WT, wild type; MAPK, mitogen-activated protein kinase. (C) Gene set enrichment analysis in down-regulated genes after DNMT3A knockout. NES, normalized enrichment score. (D) WB analyses of NE markers in WCM154 sgGFP, sgDNMT1, and sgDNMT3A cells. (E) Representative IHC images of subcutaneous tumors injected with WCM154 sgGFP, sgDNMT1, and sgDNMT3A stained by H&E, CHGA, SYP, and INSM1. Scale bars, 200 μm. (F) WB analyses of NE markers after overexpression of DNMT1/3A in DNMT1/3A knockout cells. (G) Cell viability analyses in WCM154 si_Control and si_DNMT1. A two-tailed t test was used. (H and I) WB analyses of NE markers after DNMT1 silencing in WCM154 and WCM155 cells. ****P < 0.0001.
Fig. 4.
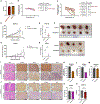
Fig. 4.. Antitumor effects of DNMT inhibition.
(A) DNA methylation β-values in CRPC-Adeno (22Rv1) and NEPC (WCM154 and WCM12) tumors. A two-tailed t test was used. (B and C) Cell viability assay and IC50 values using vehicle and multiple doses of decitabine in PCA, CRPC-Adeno, and NEPC models. A two-way ANOVA test was used. (D) WCM154 (NEPC) tumor volume after vehicle (n = 9) or decitabine (0.3 mg/kg) (n = 9) treatment. A two-way ANOVA test was used. (E) Tumor weights of control or decitabine-treated WCM154 tumors. A two-tailed t test was used. (F) Images of control and decitabine-treated WCM154 tumors. (G) WCM12 (NEPC) tumor volume after vehicle (n = 3) or decitabine (0.2 mg/kg; n = 5) treatment. A two-way ANOVA test was used. (H) Tumor weights of control or decitabine-treated WCM12 tumors. A two-tailed t test was used. (I and J) Representative IHC images of WCM154 and WCM12 tumors after vehicle or decitabine treatment stained by H&E, CHGA, SYP, INSM1, and Ki67. Scale bars, 200 μm. (K and L) Percentage of Ki67-positive cells in WCM154 and WCM12 tumors after vehicle or decitabine treatment. A two-tailed t test was used. (M and N) Body weights of mice at the end of the study in control and decitabine groups. A two-tailed t test was used. (O) The β values in control and decitabine-treated WCM154 tumors. A two-tailed t test was used. *P < 0.05, **P < 0.01, ****P < 0.0001. n.s., not significant.
Fig. 5.
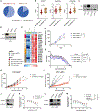
Fig. 5.. Biological characteristics of RB1-deficient CRPC and sensitivity to DNMT inhibition.
(A) Frequency of RB1 loss in patients with CRPC-Adeno (n = 70) and NEPC (n = 29) (15). (B) DNMT gene mRNA expression with or without RB1 alteration in patients with prostate cancer (15). A two-tailed t test was used. (C) RB protein expression in PCA and CRPC-Adeno cell lines (LNCaP and 22Rv1) and NEPC (WCM154 and WCM12) models. (D) RB protein expression after RB1 knockout in 22Rv1 cells. (E) Heatmap of mRNA expression of epigenetic regulators, cell proliferation markers, cell cycle progression, and DNA replication genes in 22Rv1 sgGFP and -sgRB1 cells. (F) Cell viability analyses in 22Rv1 sgGFP and -sgRB1 cells. A two-tailed t test was used. (G) Cell viability assay and IC50 values using vehicle and multiple doses of decitabine in 22Rv1 sgGFP and -sgRB1 cells. A two-way ANOVA test was used. (H and I) 22Rv1 sgGFP and -sgRB1 tumor volumes after vehicle (n = 6) or decitabine (0.2 mg/kg) (n = 5 or 6) treatment. A two-way ANOVA test was used. (J) DNMT1 protein expression after silencing of DNMT1 in 22Rv1 sgRB1 cells. (K) Cell viability assay using vehicle and multiple doses of decitabine after silencing of DNMT1 in 22Rv1 sgRB1 cells. A two-way ANOVA test was used. (L and M) DNMT1 protein expression and cell viability in decitabine after infection of shControl, shDNMT1, and DNMT1 overexpression. A two-way ANOVA test was used. *P < 0.05, **P < 0.01, ***P < 0.001, ****P < 0.0001.
Fig. 6.
Fig. 6.. DNMT inhibition up-regulates the cell surface target B7-H3 via hypomethylation.
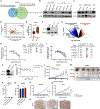
(A) Venn diagram indicating the overlap of differentially expressed genes (up-regulated) and differentially methylated genes (hypomethylated) after decitabine treatment. (B and C) B7-H3 protein expression in PCA, CRPC-Adeno, and NEPC patient–derived models/cell lines. (D) Spearman’s correlation analysis between the β values in promoter region and mRNA expression of B7-H3 (27). (E) The β values in promoter region of B7-H3 gene in patients with CRPC (n = 95) and NEPC [also referred to as treatment-emergent small-cell neuroendocrine cancer (tSCNC)] (n = 5) (27). A two-tailed t test was used. (F) B7-H3 protein expression after B7-H3 knockout in 22Rv1 cells. (G) Volcano plot of differentially expressed genes in 22Rv1 sgGFP versus 22Rv1 sgB7-H3. (H and I) Cell viability assay and IC50 values using vehicle and multiple doses of DS-7300a and Dxd in PCA, CRPC-Adeno, and NEPC models. A two-way ANOVA test was used. (J) B7-H3 protein expression after silencing of B7-H3 in 22Rv1. (K) Cell viability assay using vehicle and multiple doses of DS-7300a in 22Rv1 si_Control and si_B7-H3. DS-7300a treatment was initiated 3 days after siRNA induction, and cell viability was measured on day 6. A two-tailed t test was used. (L) Growth of subcutaneous WCM12 (NEPC) tumors in mice treated with vehicle (n = 5), DS-7300a (3 mg/kg; n = 5), or DS-7300a (10 mg/kg; n = 5). A two-way ANOVA test was used. (M) Tumor images at the end of the study. (N) Tumor weights of vehicle-, DS-7300a– (3 mg/kg), or DS-7300a (10 mg/kg)–treated WCM12 tumors. A two-tailed t test was used. (O) Body weights of mice at the end of the study in vehicle and DS-7300a groups. A two-tailed t test was used. (P and Q) Growth of subcutaneous WCM1262 (NEPC) and 22Rv1 (CRPC) tumors in mice treated with vehicle (n = 4 or 5), DS-7300a (3 mg/kg; n = 5), or DS-7300a (10 mg/kg; n = 5). A two-way ANOVA test was used. (R) Representative IHC images and H-scores of WCM12, WCM1262, and 22Rv1 tumors in vehicle group stained by B7-H3. Scale bars, 200 μm. *P < 0.05 and **P < 0.01.
Fig. 7.
Fig. 7.. Combination therapy with DNMT inhibitor and ADC targeting B7-H3.
(A) Bar graph of B7-H3 TPM data in WCM154 sgGFP, -sgDNMT1, and -gDNMT3A cells. A two-tailed t test was used. (B) B7-H3 protein expression in WCM154 sgGFP, -sgDNMT1, and -sgDNMT3A cells. (C) Flow cytometry was used to measure the B7-H3 expression in WCM154 sgGFP, -sgDNMT1, and -sgDNMT3A cells. (D) Percentage of methylation in B7-H3 promoter region using methyl-PCR. (E) Cell viability assay using vehicle, DS-7300a (100 μg/ml), decitabine (1 μM), and combination in WCM154 cells. A two-tailed t test was used. (F) Apoptosis marker (cleaved PARP) expression induced by decitabine (1 μM), DS-7300a (100 μg/ml), and combination. (G) Protein cleaved PARP signal intensity (normalized to untreated cells). (H) Combination index values determined using ΔBliss scores between decitabine and DS-7300a (=0 additive, <0 synergistic, or >0 antagonistic). (I and N) Growth of subcutaneous WCM154 (NEPC) and WCM1078 (NEPC) tumors in mice treated with vehicle (n = 5), DS-7300a (3 mg/kg) (n = 5), decitabine (0.2 mg/kg) (n = 5), or combination (n = 5). A two-way ANOVA test was used. (J) Tumor images at the end of the study. (K) Tumor weights of vehicle-, DS-7300a–, decitabine-, or combination-treated WCM154 tumors. A two-tailed t test was used. (L and O) The percentage of change in tumor volumes for each tumor from baseline shown as a waterfall plot (y axis) in WCM154 (L) and WCM1078 (O) tumors. (M) Body weights of mice at sacrifice in vehicle, DS-7300a, decitabine, and combination groups. A two-tailed t test was used. (P) Representative IHC images of WCM154 and WCM1078 tumors after vehicle and decitabine treatment stained by B7-H3. Scale bars, 200 μm. *P < 0.05, **P < 0.01, ****P < 0.0001.

References

    1. Siegel RL, Miller KD, Fuchs HE, Jemal A, Cancer statistics, 2022. CA Cancer J. Clin. 72, 7–33 (2022). - PubMed
    1. Yamada Y, Beltran H, The treatment landscape of metastatic prostate cancer. Cancer Lett. 519, 20–29 (2021). - PMC - PubMed
    1. Swami U, Aggarwal H, Zhou M, Jiang S, Kim J, Li W, Laliberté F, Emond B, Agarwal N, Treatment patterns, clinical outcomes, health care resource utilization and costs in older patients with metastatic castration-resistant prostate cancer in the United States: An analysis of SEER-Medicare data. Clin. Genitourin. Cancer 21, 517–529 (2023). - PubMed
    1. Beer TM, Armstrong AJ, Rathkopf DE, Loriot Y, Sternberg CN, Higano CS, Iversen P, Bhattacharya S, Carles J, Chowdhury S, Davis ID, de Bono JS, Evans CP, Fizazi K, Joshua AM, Kim C-S, Kimura G, Mainwaring P, Mansbach H, Miller K, Noonberg SB, Perabo F, Phung D, Saad F, Scher HI, Taplin M-E, Venner PM, Tombal B; PREVAIL Investigators, Enzalutamide in metastatic prostate cancer before chemotherapy. N. Engl. J. Med. 371, 424–433 (2014). - PMC - PubMed
    1. de Bono JS, Logothetis CJ, Molina A, Fizazi K, North S, Chu L, Chi KN, Jones RJ, Goodman OB Jr., Saad F, Staffurth JN, Mainwaring P, Harland S, Flaig TW, Hutson TE, Cheng T, Patterson H, Hainsworth JD, Ryan CJ, Sternberg CN, Ellard SL, Fléchon A, Saleh M, Scholz M, Efstathiou E, Zivi A, Bianchini D, Loriot Y, Chieffo N, Kheoh T, Haqq CM, Scher HI; COU-AA-301 Investigators, Abiraterone and increased survival in metastatic prostate cancer. N. Engl. J. Med. 364, 1995–2005 (2011). - PMC - PubMed

Publication types

MeSH terms