. 2023 Nov 21;120(47):e2302126120.
doi: 10.1073/pnas.2302126120. Epub 2023 Nov 15.

NMDAR antagonists suppress tumor progression by regulating tumor-associated macrophages

Affiliations

NMDAR antagonists suppress tumor progression by regulating tumor-associated macrophages

Dongchen Yuan et al. Proc Natl Acad Sci U S A. .

Abstract

Neurotransmitter receptors are increasingly recognized to play important roles in anti-tumor immunity. The expression of the ion channel N-methyl-D-aspartate receptor (NMDAR) on macrophages was reported, but the role of NMDAR on macrophages in the tumor microenvironment (TME) remains unknown. Here, we show that the activation of NMDAR triggered calcium influx and reactive oxygen species production, which fueled immunosuppressive activities in tumor-associated macrophages (TAMs) in the hepatocellular sarcoma and fibrosarcoma tumor settings. NMDAR antagonists, MK-801, memantine, and magnesium, effectively suppressed these processes in TAMs. Single-cell RNA sequencing analysis revealed that blocking NMDAR functionally and metabolically altered TAM phenotypes, such that they could better promote T cell- and Natural killer (NK) cell-mediated anti-tumor immunity. Treatment with NMDAR antagonists in combination with anti-PD-1 antibody led to the elimination of the majority of established preclinical liver tumors. Thus, our study uncovered an unknown role for NMDAR in regulating macrophages in the TME of hepatocellular sarcoma and provided a rationale for targeting NMDAR for tumor immunotherapy.

Keywords: NMDA receptor; ROS; macrophages; tumor; tumor microenvironment.


Conflict of interest statement

X.L. is an employee of OriCell Therapeutics. W.C.D. is a member of the EpimAb Biotherapeutics scientific advisory board and holds patents related to the Receptor Activator of Nuclear Factor-κ B Ligand (RANKL) pathway. No potential conflicts of interest were disclosed by the other authors.

Figures

Fig. 1.
Fig. 1.
MK-801 treatment alters the phenotype and function of macrophages. (A–C) NMDAR subunit NR1 expression in BMDMs cultured with (A) Hepa1-6BL cells at the indicated ratio, (B) fresh culture media (FM), or Hepa1-6BL tumor cell conditioned media (TCM) for 24 h determined by flow cytometry and (C) western blot. (D–G) DEGs and signaling pathway analyses of BMDMs treated with 300 μM MK-801. (D) MA plot and (E) heatmap showing fold-change of DEGs of control versus MK-801 treatment. (F) Verification of the DEGs by qPCR in (E). (G) The bubble chart shows the signaling pathways. (H and I) Expression of CD80 and CD86 in BMDMs cocultured with Hepa1-6BL cells at the ratio of 1: 1 in the presence or absence of 300 μM MK-801 for 24 h. (J) The proliferation of OT1 CD8+ T cells after coculture with SIINFEKL-pulsed BMDMs. BMDM cells cocultured with Hepa1-6BL cells at the ratio of 1: 1 in the presence or absence of 300 μM MK-801 for 24 h. The percentage of T cells dividing more than twice was plotted. (K) The level of IFNγ in the cell culture supernatant from (J). (L) The phagocytic capacity of BMDMs against tumor cells. The data show the mean value ± SEM. Experiments were performed twice, except for mRNA sequencing. Each dot represents a sample in the dot plots. Significant differences between groups as indicated by crossbars were determined using a Mann–Whitney test (F and H–L). **P < 0.01, ***P < 0.001; ****P < 0.0001.
Fig. 2.
Fig. 2.
MK-801 treatment suppressed tumor progression and prolonged mouse survival. (A–D) The effect of MK-801 treatment on the growth of Hepa1-6BL and MCA205 in C57BL/6 WT mice (6 to 7 mice/group) and representative tumor pictures. (E) The quantification of Hepa1-6BL liver tumors (Left) and representative images (Right) and (F) survival of C57BL/6 WT mice (10 to 15 mice/group) bearing Hepa1-6BL liver tumors. (G–I) Cell viability of (G) Hepa1-6BL cells, (H) MCA205 cells treated with MK-801 as indicated, and (I) cell apoptosis of Hepa1-6BL cells treated with 300 μM MK-801 for 48 h. (J–M) the effect of MK-801 treatment on Hepa1-6BL tumor growth in WT mice (9 to 12 mice/group) depleted of (J) CD8+ T cells, (K) NK cells, (L and M) macrophages. The details of mouse treatments were described in the methods of SI Appendix. The data show the mean value ± SEM. Experiments were performed twice independently with (A) three times, whereas (E and F) were pooled from two independent experiments. Each dot represents a mouse sample in the dot plots. Significant differences between groups were determined using a Mann–Whitney test (A, C, E, and J–M), or a log-rank Mantel-Cox test for F. *P < 0.05; **P < 0.01.
Fig. 3.
Fig. 3.
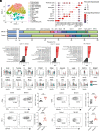
MK-801 treatment increased the function of tumor-infiltrating cytotoxic lymphocytes. (A) tSNE analysis of CD45.2+ cells from Hepa1-6BL tumors. (B) Expression of the marker genes for each cluster for cell type identification. (C) The proportion of different cell subpopulations among tumor-infiltrating CD45.2+ cells. (D) Enriched KEGG pathways of tumor-infiltrating CD8+ T, CD4+ T, and NK cells after MK-801 treatment. (E) Violin diagrams show DEGs in specific cell clusters shown in (A) on TILs of control and MK-801-treated Hepa1-6BL-bearing WT mice. (F) Representative plots and the quantification of IFNγ and CD107a expression in tumor-infiltrating CD8+ T, NK, and CD4+ T cells and from Hepa1-6BL tumors. Each dot represents a mouse sample in the dot plots. Representative dot plot and data presented as mean ± SEM. Experiments were performed twice. Significant differences between groups as indicated by crossbars were determined by a Mann-Whitney test. **P < 0.01; ***P < 0.001; ****P < 0.0001.
Fig. 4.
Fig. 4.
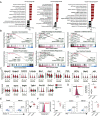
MK-801 treatment altered the gene expression profile and function of TAMs. (A) GSEA-KEGG and Gene Ontology (GO) analysis of all macrophage clusters and cluster 4 macrophages from control tumors and MK-801-treated tumors. Potential functions and pathways are listed on the y axis. Pathway enrichment is shown as the normalized enrichment scores (NES) adjusted for multiple comparisons. (B) GSEA analysis of core gene variation involved in the function and metabolisms of macrophages. Statistical testing was performed by permutation test. The P-values were corrected with Benjamini-Hochberg adjustment. (C) Violin plots indicating the expression of selected genes in each macrophage cluster present in control and MK-801-treated tumors. The statistical difference was calculated by Student’s t test. (D–F) The effects of MK-801 on the immunosuppressive function of TAMs against CD8+ T cells as described in the method. (D) CD8+ T cell proliferation, (E) the apoptosis of Hepa1-6BL to reflect the killing ability of CD8+ T cells, (F) Granzyme B and IFNγ expression in CD8+ T cells. Each dot represents a sample in the dot plots. Representative dot plot and data presented as mean ± SEM. Experiments were performed twice. Significant differences between groups as indicated by crossbars were determined by a Mann-Whitney test. *P < 0.05; **P < 0.01, ***P < 0.001; ****P < 0.0001.
Fig. 5.
Fig. 5.
NMDAR regulated Ca2+ influx, ROS production, and the function of mitochondria in macrophages. (A) Ca2+ influx in BMDMs. Average fluorescence ratio over time of BMDMs exposed sequentially to FM, Hepa1-6BL TCM, glutamate (1 mM), NMDA (300 μM), MEM (300 μM), MK-801 (300 μM), 2-APB (10 μM) as indicated, by detecting the Fluo-4 fluorescence intensity using flow cytometry. The Fluo-4 fluorescence intensity over time was analyzed using FlowJo software kinetic module to reflect the level of calcium in the cell cytosol. (B and C) The level of total protein and phosphorylation of CaMKII, ERK1/2, and CREB in BMDMs after the indicated treatment by western blot. (D) Glutamate levels in supernatants of fresh cell culture media (FM), or BCM, and Hepa1-6BL tumor cell conditioned media (TCM). (E–G) Quantization of ROS levels (E), relative mRNA level of genes involved in ROS production (F), and quantization of lipid peroxidation (G) in BMDMs after the indicated treatments by flow cytometry. (H) Representative electron microscope images of mitochondrial morphology of BMDMs. (I) The ratio of ADP to ATP in BMDMs after the indicated treatment. (J) The enrichment plot of genes involved in OXPHOS in BMDMs after MK-801 treatment. (K) The effect of NMDAR antagonists on BMDM OXPHOS as described in the SI Appendix, Methods. The data is presented as mean ± SEM. Each dot represents a sample in the dot plots. Experiments were performed twice independently with (A) four times. Significant differences between groups as indicated by crossbars were determined by a Mann-Whitney test. **P < 0.01; ***P < 0.001; ****P < 0.0001.
Fig. 6.
Fig. 6.
Blocking NMDAR and PD-1 resulted in tumor rejection. (A–C) the effect of NMDAR antagonist Hepa1-6BL tumor growth. Tumor-bearing C57BL/6J WT mice (5 to 8 mice per group) were treated from day 5, daily with MEM (25 mg/kg, in drinking water), Ifenprodil tartrate (20 mg/kg, i.p.) and MgCl2 (50 μL of 3 mM intratumorally). The data show the mean tumor size (mm2) ± SEM. (D) Representative plots and the quantification of PD-1 in Hepa1-6BL tumor infiltrating CD8+ T cells by flow cytometry. Each dot represents a mouse sample in the dot plots. (E) The effect of NMDAR antagonist and anti-PD-1 antibody treatment (i.p. 100 μg/mouse on day 11), alone or in combination as indicated on the established Hepa1-6BL tumor growth in C57BL/6J WT (5 to 8 mice per group). Each growth curve represents a mouse tumor. (F) Statistics of tumor rejection rate in the groups as in (E). Data were pooled from two independent experiments. (G) Schematic for the mechanisms by blocked NMDAR in decreased the suppressive function of TAM and improved the function of cytotoxic lymphocytes in TME. Experiments were performed twice. Significant differences between groups as indicated by crossbars were determined using a Mann–Whitney test. *P < 0.05; **P < 0.01.

References

    1. Hanahan D., Weinberg R. A., Hallmarks of cancer: The next generation. Cell 144, 646–674 (2011). - PubMed
    1. Hanahan D., Hallmarks of cancer: New dimensions. Cancer Discov. 12, 31–46 (2022). - PubMed
    1. Johnson D. B., Nebhan C. A., Moslehi J. J., Balko J. M., Immune-checkpoint inhibitors: Long-term implications of toxicity. Nat. Rev. Clin. Oncol. 19, 254–267 (2022). - PMC - PubMed
    1. Mantovani A., Allavena P., Marchesi F., Garlanda C., Macrophages as tools and targets in cancer therapy. Nat. Rev. Drug Discov. 21, 799–820 (2022). - PMC - PubMed
    1. Ruffell B., Coussens L. M., Macrophages and therapeutic resistance in cancer. Cancer Cell 27, 462–472 (2015). - PMC - PubMed

Publication types