Review
. 2023 Dec 13;123(23):13374-13418.
doi: 10.1021/acs.chemrev.3c00352. Epub 2023 Nov 15.

Operando Electron Microscopy of Catalysts: The Missing Cornerstone in Heterogeneous Catalysis Research?

Affiliations
Review

Operando Electron Microscopy of Catalysts: The Missing Cornerstone in Heterogeneous Catalysis Research?

See Wee Chee et al. Chem Rev. .

Abstract

Heterogeneous catalysis in thermal gas-phase and electrochemical liquid-phase chemical conversion plays an important role in our modern energy landscape. However, many of the structural features that drive efficient chemical energy conversion are still unknown. These features are, in general, highly distinct on the local scale and lack translational symmetry, and thus, they are difficult to capture without the required spatial and temporal resolution. Correlating these structures to their function will, conversely, allow us to disentangle irrelevant and relevant features, explore the entanglement of different local structures, and provide us with the necessary understanding to tailor novel catalyst systems with improved productivity. This critical review provides a summary of the still immature field of operando electron microscopy for thermal gas-phase and electrochemical liquid-phase reactions. It focuses on the complexity of investigating catalytic reactions and catalysts, progress in the field, and analysis. The forthcoming advances are discussed in view of correlative techniques, artificial intelligence in analysis, and novel reactor designs.


Conflict of interest statement

The authors declare no competing financial interest.

Figures

Figure 1
Figure 1
Extracting local chemical information from nanomaterials by electron microscopy. (a) Scanning (S)TEM allows not only recording the electron diffraction pattern which can be used to establish pair distribution functions (ePDF), bright-field (BF)-TEM, phase contrast (high-resolution (HR)TEM), and annular dark-field (ADF) images that are based on elemental (Z) contrast but also X-rays and inelastically scattered electrons using dedicated hardware for energy-dispersive X-ray spectrometry (EDX) and electron energy loss spectroscopy (EELS). (b) SEM imaging of the surface of a catalyst. Secondary electrons (SEs) and backscattered electrons (BSEs) in combination with EDX analysis are mainly detected.
Figure 2
Figure 2
Schematic showing an operando electron microscopy experiment where the changes in catalyst morphology during a heterogeneous, gas phase, thermal catalysis reaction are probed. Changing the chemical potential by applying different temperatures and partial or total pressures alters the catalyst and its performance, rendering the detection of conversion mandatory.
Figure 3
Figure 3
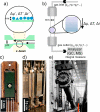
Difference in scale and sampling of a MEMS-based reactor used for in situ TEM studies and an illustrative example of a plug flow reactor. (a) Schematics of MEM-based closed-cell nanoreactor for in situ TEM analysis and (b) typically used plug flow reactor for gas-phase reactions. Δμ, ΔT, and Δr denote the gradients in the chemical potential, temperature, and reactivity along the catalyst bed, respectively, while Δμ́, Δ, and Δŕ are the corresponding local gradients. Reproduced in part with permission from ref (30). Copyright 2021 IOP Publishing. (c) Image of the tip of a gas-phase in situ TEM holder in which a MEMS chip has been positioned. Reproduced in part with permission from ref (23). Copyright 2015 Elsevier. (d) Photograph of a laboratory tubular reactor setup. The white arrow points to a reactor tube that is placed in between the furnace and connected to the gas inlet and outlet. (e) Installation of a high-pressure reactor in an ammonia plant. Copyright BASF. From ref (41). Used under CC BY-NC-ND 2.0. The red bar was added to highlight the height of a human being.
Figure 4
Figure 4
Space–time scale of different dynamic processes occurring in catalysis. Catalytic processes in their specific space and time scale ranges using the applied techniques: conventional TEM (CTEM, red dashed box) and conventional mass spectrometry (CMS, yellow dashed box). Only in the intersection of CTEM and CMS, operando measurements are possible (gray box). Reproduced from ref (46). Copyright 2020 Oxford University Press. CC BY.
Figure 5
Figure 5
In situ ETEM image of a time series of a CeO2-supported Pt NP at 144 °C in 0.57 Torr of CO and O2. (a) Time-averaged image of the catalyst, obtained by summing together the individual 0.5 s exposure frames over the entire 0–2 s acquisition period. (b),(c) Atomic-scale structural dynamics that evolve over 0.5 s intervals from t = 0 s to t = 2.0 s. f1–f4 FT taken at each time interval from the windowed region around the Pt NP, as denoted in (b). The scale bar in (f1) is 5.0 nm–1. Reproduced from ref (47). Copyright 2021 Springer Nature. CC BY.
Figure 6
Figure 6
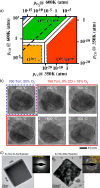
(a) First-principles calculated surface-phase diagram of CO oxidation. Regions of the lowest-energy structures in (μO, μCO) space of RuO2 (110). The labels note whether bridge (br) or undercoordinated sites (cus) are occupied by O or CO or are empty (−). The additional axes give the corresponding pressure scales at T = 300 and 600 K. In the blue-hatched region, gas-phase CO is transformed into graphite. Regions that are particularly strongly affected by kinetics are marked by white hatching. Reproduced with permission from ref (10). Copyright 2003 American Physical Society. (b) Operando TEM investigation showing the morphological changes of Pd NPs in gaseous environments and reversal to a faceted morphology when the reaction temperature is lowered from the higher temperatures where CO oxidation takes place. Reproduced in part from ref (50). Copyright 2020 Springer Nature. CC BY 4.0 (c) TEM images comparing cubic Cu2O electrocatalysts for CO2RR before and after reaction at −1.1 VRHE for 1 h in CO2-saturated 0.1 M KHCO3. The Cu2O cubes are electrodeposited directly on the C-coated working electrode of a liquid cell TEM chip. Selected area electron diffraction pattern (inset) indicates that the as-synthesized cube is single-crystalline and terminated by {100} facets. During reaction, the cube became fragmented, and redeposited particles can be seen in the support background. Selected area electron diffraction pattern (inset) indicates that the cube had transformed into a fragmented structure made of polycrystalline metallic and oxidic domains. Reproduced in part from ref (51). Copyright 2021 Springer Nature. CC BY 4.0.
Figure 7
Figure 7
Schematic illustrating the coupled kinetic processes between the catalyst and the reactant during catalysis and how the two processes are linked via the local chemical potential.
Figure 8
Figure 8
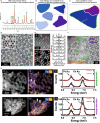
Uniqueness of a heterogeneous catalyst. (a–c) Schematic describing how integral characterization techniques average structural information from the entire catalyst ensemble, whereas individual crystallites possess local structural differences. This local information is crucial, as they influence the local chemistry and thus the formation of the active phases. (d)–(g) Examples of local structures. (a) is reproduced from ref (67). Copyright 2017 Wiley. (d) Annular bright-field (ABF) STEM image of orthorhombic (Mo,V)Ox highlighting defects in the bulk (dashed line) and polyhedral distortion (inset). Metal sites with high, intermediate, and no distortions are indicated by blue circles, orange squares, and green triangles, respectively. Mo-,V-dominating metal, channel, and oxygen sites are highlighted in blue, green, yellow, and red, respectively. The arrows in the inset denote the shift of the oxygen positions of the polyhedral. Reproduced with permission from ref (68). Copyright 2015 Wiley. (e) Displacement of the S2 sites in orthorhombic (Mo,V,Te,Nb)Ox at high resolution (i). The line profiles in (ii) correspond to the regions of interests in (i). The dotted line highlights the expected center of the S2 site. (iii) Magnified ADF-STEM image around an S2 metal site. The arrows denote the shift vectors of the Te centers with respect to the center of the hexagonal channels. Reproduced in part from ref (69). Copyright 2020 The Royal Society of Chemistry. CC BY 3.0. (f) Difference of surface versus bulk structure of orthorhombic (Mo,V)Ox. Different structural motifs and orientations of the motifs in surface and bulk regions are observed as highlighted by the various tiles. Reproduced in part from ref (70). Copyright 2017 American Chemical Society. (g) STEM-EDX comparison of differently prepared Co2FeO4 samples showing nanoscale compositional inhomogeneities. (i, ii) STEM dark-field images and (ii, v) EDX maps, comparing the elemental distribution of Fe (blue) and Co (yellow) of the conventionally and microemulsion prepared Co2FeO4. The white dashed rectangles highlight 6 × 6 nm2 areas with increased Fe (1) or slightly increased Co (2) content with respect to the nominal atomic ratio of Co:Fe = 2. (iii, vi) EDX spectra extracted from the two regions 1 and 2 shown. The Co enrichment in the microemulsion sample is much stronger compared to the conventional Co2FeO4 sample. Reproduced in part from ref (65). Copyright 2022 American Chemical Society. For further examples we refer to Section 2.5.
Figure 9
Figure 9
High-resolution TEM images of MgO. The inset in (A) shows a power spectrum, which allows identification of the orientation of the MgO crystal. (B) Higher magnified micrograph of (A) taken at the marked region of interest. The monatomic steps at the surface are clearly visible and marked by arrows. Reproduced with permission from ref (76). Copyright 2015 Elsevier.
Figure 10
Figure 10
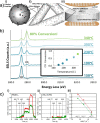
Complementary NAP-XPS and EM analysis of MnWO4. (a) Depth profile of the elemental composition of MnWO4 nanorods in terms of the inelastic mean free path (IMFP) of electrons measured by synchrotron-based NAP-XPS at T = 300 °C applying a total pressure of 0.25 mbar O2 and He at flows of 2 and 2.2 mL min–1, respectively. Reproduced in part with permission from ref (95). Copyright 2016 Wiley. (b) Surface termination of the b plane viewed along the growth direction [001] by FFT-filtered atomic-resolution STEM images. (i) HAADF and (ii) inverted HAADF image. Mn, green; W, violet. Reproduced in part with permission from ref (95). Copyright 2016 Wiley. (c) STEM-EELS measurements of the surface (red) and bulk (blue) of MnWO4 showing (i) the O K- and (ii) the Mn L-edges. The squares in the STEM image of MnWO4 in (iii) indicate the region where EELS measurements were conducted. Red: surface; blue: bulk. The black scale bar in (iii) is 10 nm. Reproduced in part from ref (96). Copyright 2019 Royal Society of Chemistry. CC BY.
Figure 11
Figure 11
EELS and electron diffraction analysis of the BSCF surface revealing differences between the perovskite particle bulk and surface after KOH immersion for 3 h. (a) ADF image close to the BSCF surface and the corresponding MLLS fitting maps of Co2+ and Co3+. (b) EEL spectra of O K, Fe L3,2, Co L3,2, and Ba M5,4 edges with respect to the 4 subregions of interest in (a). CoO (Co2+) and LiCoO2 (Co3+) reference EEL spectra for MLLS fitting are also included. (c) Selected area FFTs with respect to the 4 subregions indicated on the ADF image. The green, yellow, and orange arrows indicate the reflections {113}, {111}, and {400} of the Co/Fe spinel structure, respectively (scale bar is 5 nm–1). Reproduced from ref (105). Copyright 2020 American Chemical Society.
Figure 12
Figure 12
TEM investigation of SMSI states in heterogeneous catalysis. (a) Graphitic ZnO is decorating the surface of a Cu nanoparticle after reductive activation at 250 °C of industrially relevant Cu/ZnO/Al2O3. Reproduced in part with permission from ref (117). Copyright 2015 Wiley. (b) and (c) Representative TEM images after exposing the Cu/ZnO/Al2O3 to reaction conditions (230 °C, 60 bar, CO2/H2 mixture) and after 148 days time on stream (TOS), respectively. Reproduced in part with permission from ref (39). Copyright 2016 Wiley. In (a) to (c), Cu NPs are highlighted in red, and ZnO moieties are colored yellow.
Figure 13
Figure 13
Early attempts at in situ TEM. Images (a) and (b) represent experiments in which Ag particles are exposed to a chlorine environment using the open-cell approach. The formation of AgCl can be observed in (b). Reproduced with permission from ref (126). Copyright 1942 Springer Nature. Experimental observations of the transformation of Ag to Ag2S in the presence of H2S gas are depicted in (c)–(f). (c) and (d) denote a TEM micrograph and SAED pattern of pristine Ag, respectively. (e) and (f) show a TEM image and the corresponding SAED pattern after the transformation to Ag2S, respectively. Reproduced with permission from ref (129). Copyright 1942 Springer Nature.
Figure 14
Figure 14
Historical developments in open- and closed-cell electron microscopy systems and contemporary operando TEM holders. (a) Schematic of a commercial environmental TEM. Reproduced with permission from ref (143). Copyright 2010 Taylor & Francis. (b) Schematic of the MEMS-based liquid electrochemical cell from Williamson et al. Reproduced with permission from ref (131). Copyright 2003 Springer Nature. (c) Schematic of an early MEMS gas holder system. Reproduced with permission from ref (144). Copyright 2008 Elsevier. (d) Images of contemporary in situ holders we have at the Fritz Haber Institute of the Max Planck Society. From left to right: A Protochips Atmosphere holder, a DENSsolutions Climate holder, and a Hummingbird Scientific bulk electrochemistry holder. Images courtesy of the respective holder manufacturers.
Figure 15
Figure 15
Detection of the catalytic function in modern open-cell TEMs. (a) Nonwoven silica fibers act as catalyst support and are sandwiched between two TEM grids. The hole in the center is used for imaging and spectroscopy. Reproduced with permission from ref (156). Copyright 2014 Oxford University Press. (b) Catalytic conversion during the CO oxidation on Ru NPs following the approach described in (a). Reproduced with permission from ref (156). Copyright 2014 Oxford University Press. (c) Catalytic data as obtained during HVTEM open-cell experiments during NO reduction on Rh/ZrO2 (i), reference measurements of the support (ii), and the corresponding Arrhenius plots (iii). Green: N2 production. Red: NO conversion. Reproduced with permission from ref (160). Copyright 2021 Elsevier.
Figure 16
Figure 16
Behavior of Pt during CO oxidation–interplay of morphology and structure. (a) Schematics showing the surface reconstruction that occurred during CO oxidation over Pt single-crystal catalysts and related catalytic measurements in (b). (a) Reproduced with permission from ref (122). Copyright 2008 Wiley. (b) Reproduced with permission from ref (166). Copyright 1989 Wiley. (c) Morphological changes of the Pt NPs with (d) corresponding catalytic traces and (e) bulk structural changes found after the reaction has ignited (see catalytic data in (f)). (c and d) are adapted with permission from ref (120). Copyright 2014 Springer Nature. (e and f) Reproduced from ref (53). Copyright 2020 American Chemical Society.
Figure 17
Figure 17
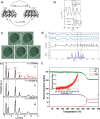
Catalytic reactions observed in an environmental SEM–DRM on Ni foam as a case study. (a)–(c) Reactor setup as incorporated into the chamber of an ESEM. (a) and (b) Photographs of a quartz tube reactor placed on the heating stage. (c) Schematics of the connection of the quartz tube reactor to the gas inlet and outlet, including MS. (d) Correlation of image intensities with catalytic data. (e) Change of the H2:CO ratio with time on stream and (f) Arrhenius plots for CO and H2 formation upon heating and cooling, showing differences in the CO production and implying different reaction mechanisms. Reproduced with permission from ref (54). Copyright 2020 Elsevier.
Figure 18
Figure 18
Examples of commercial electrochemistry chips. Side-view cross-section (a,b) and top-view (c,d) schematics of two electrochemical cell TEM chips with three microfabricated electrodes currently on the market. Reproduced from ref (133). Copyright 2014 American Chemical Society. Reproduced from ref (175). Copyright 2017 IOP Publishing. CC BY.
Figure 19
Figure 19
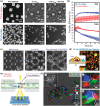
Restructuring of Cu-based electrocatalysts during CO2RR. (a) EC-STEM image sequence showing the evolution of two sets of Cu2O cubes synthesized with different size and loading in CO2-saturated 0.1 M KHCO3. The larger 170 nm cubes exhibit predominantly fragmentation and redeposition under sustained applied potential of −0.9 VRHE, whereas smaller 80 nm cubes undergo severe catalyst detachment in the electrolyte together with catalyst aggregation during reaction. (b) A comparison of the Faradaic efficiency of similarly synthesized sample sets toward CO and C2H4 measured using only gas chromatography at −1.1 VRHE. Adapted in part from ref (51). Copyright 2021 Springer Nature. CC BY 4.0. (c) EC-STEM image sequence showing the evolution of lithographically patterned Cu islands following anodization in 0.01 M KI and then in iodide-free CO2-saturated 0.1 M KHCO3 at −1.0 VRHE. (d) Post-mortem STEM-EDX map taken after reaction, indicating the reprecipitation of Cu2O and CuI after returning to the open-circuit potential. The inset depicts a schematic of the after-reaction morphology. Adapted in part from ref (186). Copyright 2022 Royal Society of Chemistry. CC BY 3.0. (e) Schematic describing the application of 4D-STEM to EC experiments. Adapted from ref (195). Copyright 2022 American Chemical Society. (f) False-colored dark-field 4D STEM maps depicting Cu nanograins with individual diffraction patterns that can be matched to the diffraction spots indicated in inset (i), where 1 (red) corresponds to metallic Cu {200} (with 1.8 Å) and 2 (green) and 3 (blue) correspond to different Cu {111} (2.1 Å) spots that are close to the [110] zone axis. (ii) and (iii) show enlarged images as indicated by the dashed boxes and indicate (ii) loosely connected Cu nanograins and (iii) overlapping nanograin boundaries, respectively. Reproduced in part from ref (194). Copyright 2023 Springer Nature.
Figure 20
Figure 20
Real-time imaging of a BSCF particle and concurrent EELS measurement of oxygen evolution during cyclic voltammetry. (a) Bright-field TEM images at different potential stages for the first, second, and third cycles. Scale bar is 400 nm. (b) Schematic of STEM-EELS probing near BSCF particles in the EC-TEM cell. (c) Oxygen K EEL spectra acquired at 1.0 and 1.9 VRHE. The asterisk at 531 eV indicates the peak feature from molecular oxygen at higher potential. (d) Plot of O2 peak intensity ratio (green) and relative thickness (orange curve) as a function of elapsed time (bottom axis) and applied potential (top axis) corresponding to CV measurements. Adapted in part from ref (200). Copyright 2021 Springer Nature. CC BY.
Figure 21
Figure 21
Manifestations of beam damage during in situ TEM experiments in the gas phase. (a) The image shows soot particles. The empty spot in the center (diameter: approximately 5 μm) was exposed to 0.2 A cm–2 for 1 min at 800 mbar Ar. Image scale 2600:1. Reproduced with permission from ref (161). Copyright 1969 Springer Nature. (b) Schematic for thinking about the impact of the electron beam. The regions are grouped as suggested by the review published by Rivzi et al. Green regions denote when the electron impact is insignificant on the observation, and the obtained results can be considered useful. Yellow describes conditions where there is already noticeable beam-induced artifacts but where the thermal or chemical stimuli still have a stronger effect on the catalyst behavior. Under such conditions, the results can be useful only under conditions where the beam effect is quantifiable. Red areas indicate significant electron beam interaction which are harmful to the catalysts. The presented charts show experimental observables, such as morphological (perimeter effects, particle shape, dynamic behavior, etc.) and structural changes (uncovered by electron diffraction, left, y-axis), that can be influenced significantly if the electron beam is not controlled precisely or over time. Furthermore, the ion currents of the MS, heating power of the MEMS chip, or current changes can be affected by the electron beam and, thus, require thorough inspection before the true operando experiment can be conducted. This is reflected by the right y-axis labeled “observed changes in external read-outs. (c) Variation of the resistance of barium titanate as a function of the electron dose and acceleration voltages (i) implying the formation of oxygen vacancies. (ii) Dose-dependent transition of barium titanate from insulating to semiconducting. Reproduced with permission from ref (214). Copyright 2020 Wiley. (d) Threshold electron doses to damage multiwall carbon nanotubes in vacuum and in gas environments at room temperature showing that gas ionization is more severe then electron beam irradiation. Reproduced from ref (223). Copyright 2016 American Chemical Society. (e) ETEM investigation of Au/MgO cubes exposed to different electron doses and water vapor pressures. Water vapor is a common byproduct in catalytic reactions. The scale bars are 5 nm. Reproduced with permission from ref (154). Copyright 2012 Elsevier. (f) Particle shrinkage rate and coalescence of Pt/Al2O3 catalyst in 10 mbar air at 400 °C as a function of beam current density (i). For comparison, the same parameters are plotted as a function of temperature at constant beam current density (ii). Reproduced from ref (219). Copyright 2016 American Chemical Society.
Figure 22
Figure 22
Surface sensitivity of the ESEM. (a) Observation of graphene growth on Cu and (b) spatiotemporal pattern during NO2 reduction at 13 Pa. (a) Reproduced from ref (232). Copyright 2015 American Chemical Society. (b) Reproduced in part with permission from ref (230). Copyright 2020 Nature Springer.
Figure 23
Figure 23
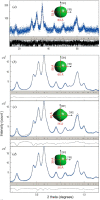
Rietveld refinement of ED data. Results of the combined analysis of Mn3O4 nanopowders for (a) XRD and ED patterns treated (b) using a pattern-matching mode (Le Bail), (c) using kinematical approximation, and (d) using a kinematical approximation with Blackman two-wave dynamic correction. The average size and shape estimated from the refinement of Popa coefficients (up to R3) are given. Reproduced from ref (268) with permission from the International Union of Crystallography.

References

    1. Schmal M.Heterogeneous Catalysis and Its Industrial Applications; Springer, 2016.
    1. Hagen J.Economic Importance of Catalysts. In Industrial Catalysis; Wiley, 2015; pp 459–462.
    1. Chorkendorff I.; Niemantsverdriet J. W.. Concepts of Modern Catalysis and Kinetics, 3rd ed.; Wiley-VCH Verlag, 2003.
    1. Olah G. A.; Goeppert A.; Prakash G. K. S.. Beyond Oil and Gas: The Methanol Economy, 2nd ed.; Wiley, 2009.
    1. Chemical Energy Storage; Schlögl R., Ed.; De Gruyter, 2013.