. 2023 Dec 13;31(12):2007-2022.e12.
doi: 10.1016/j.chom.2023.10.016. Epub 2023 Nov 14.

Fiber-deficient diet inhibits colitis through the regulation of the niche and metabolism of a gut pathobiont

Affiliations

Fiber-deficient diet inhibits colitis through the regulation of the niche and metabolism of a gut pathobiont

Peter Kuffa et al. Cell Host Microbe. .

Abstract

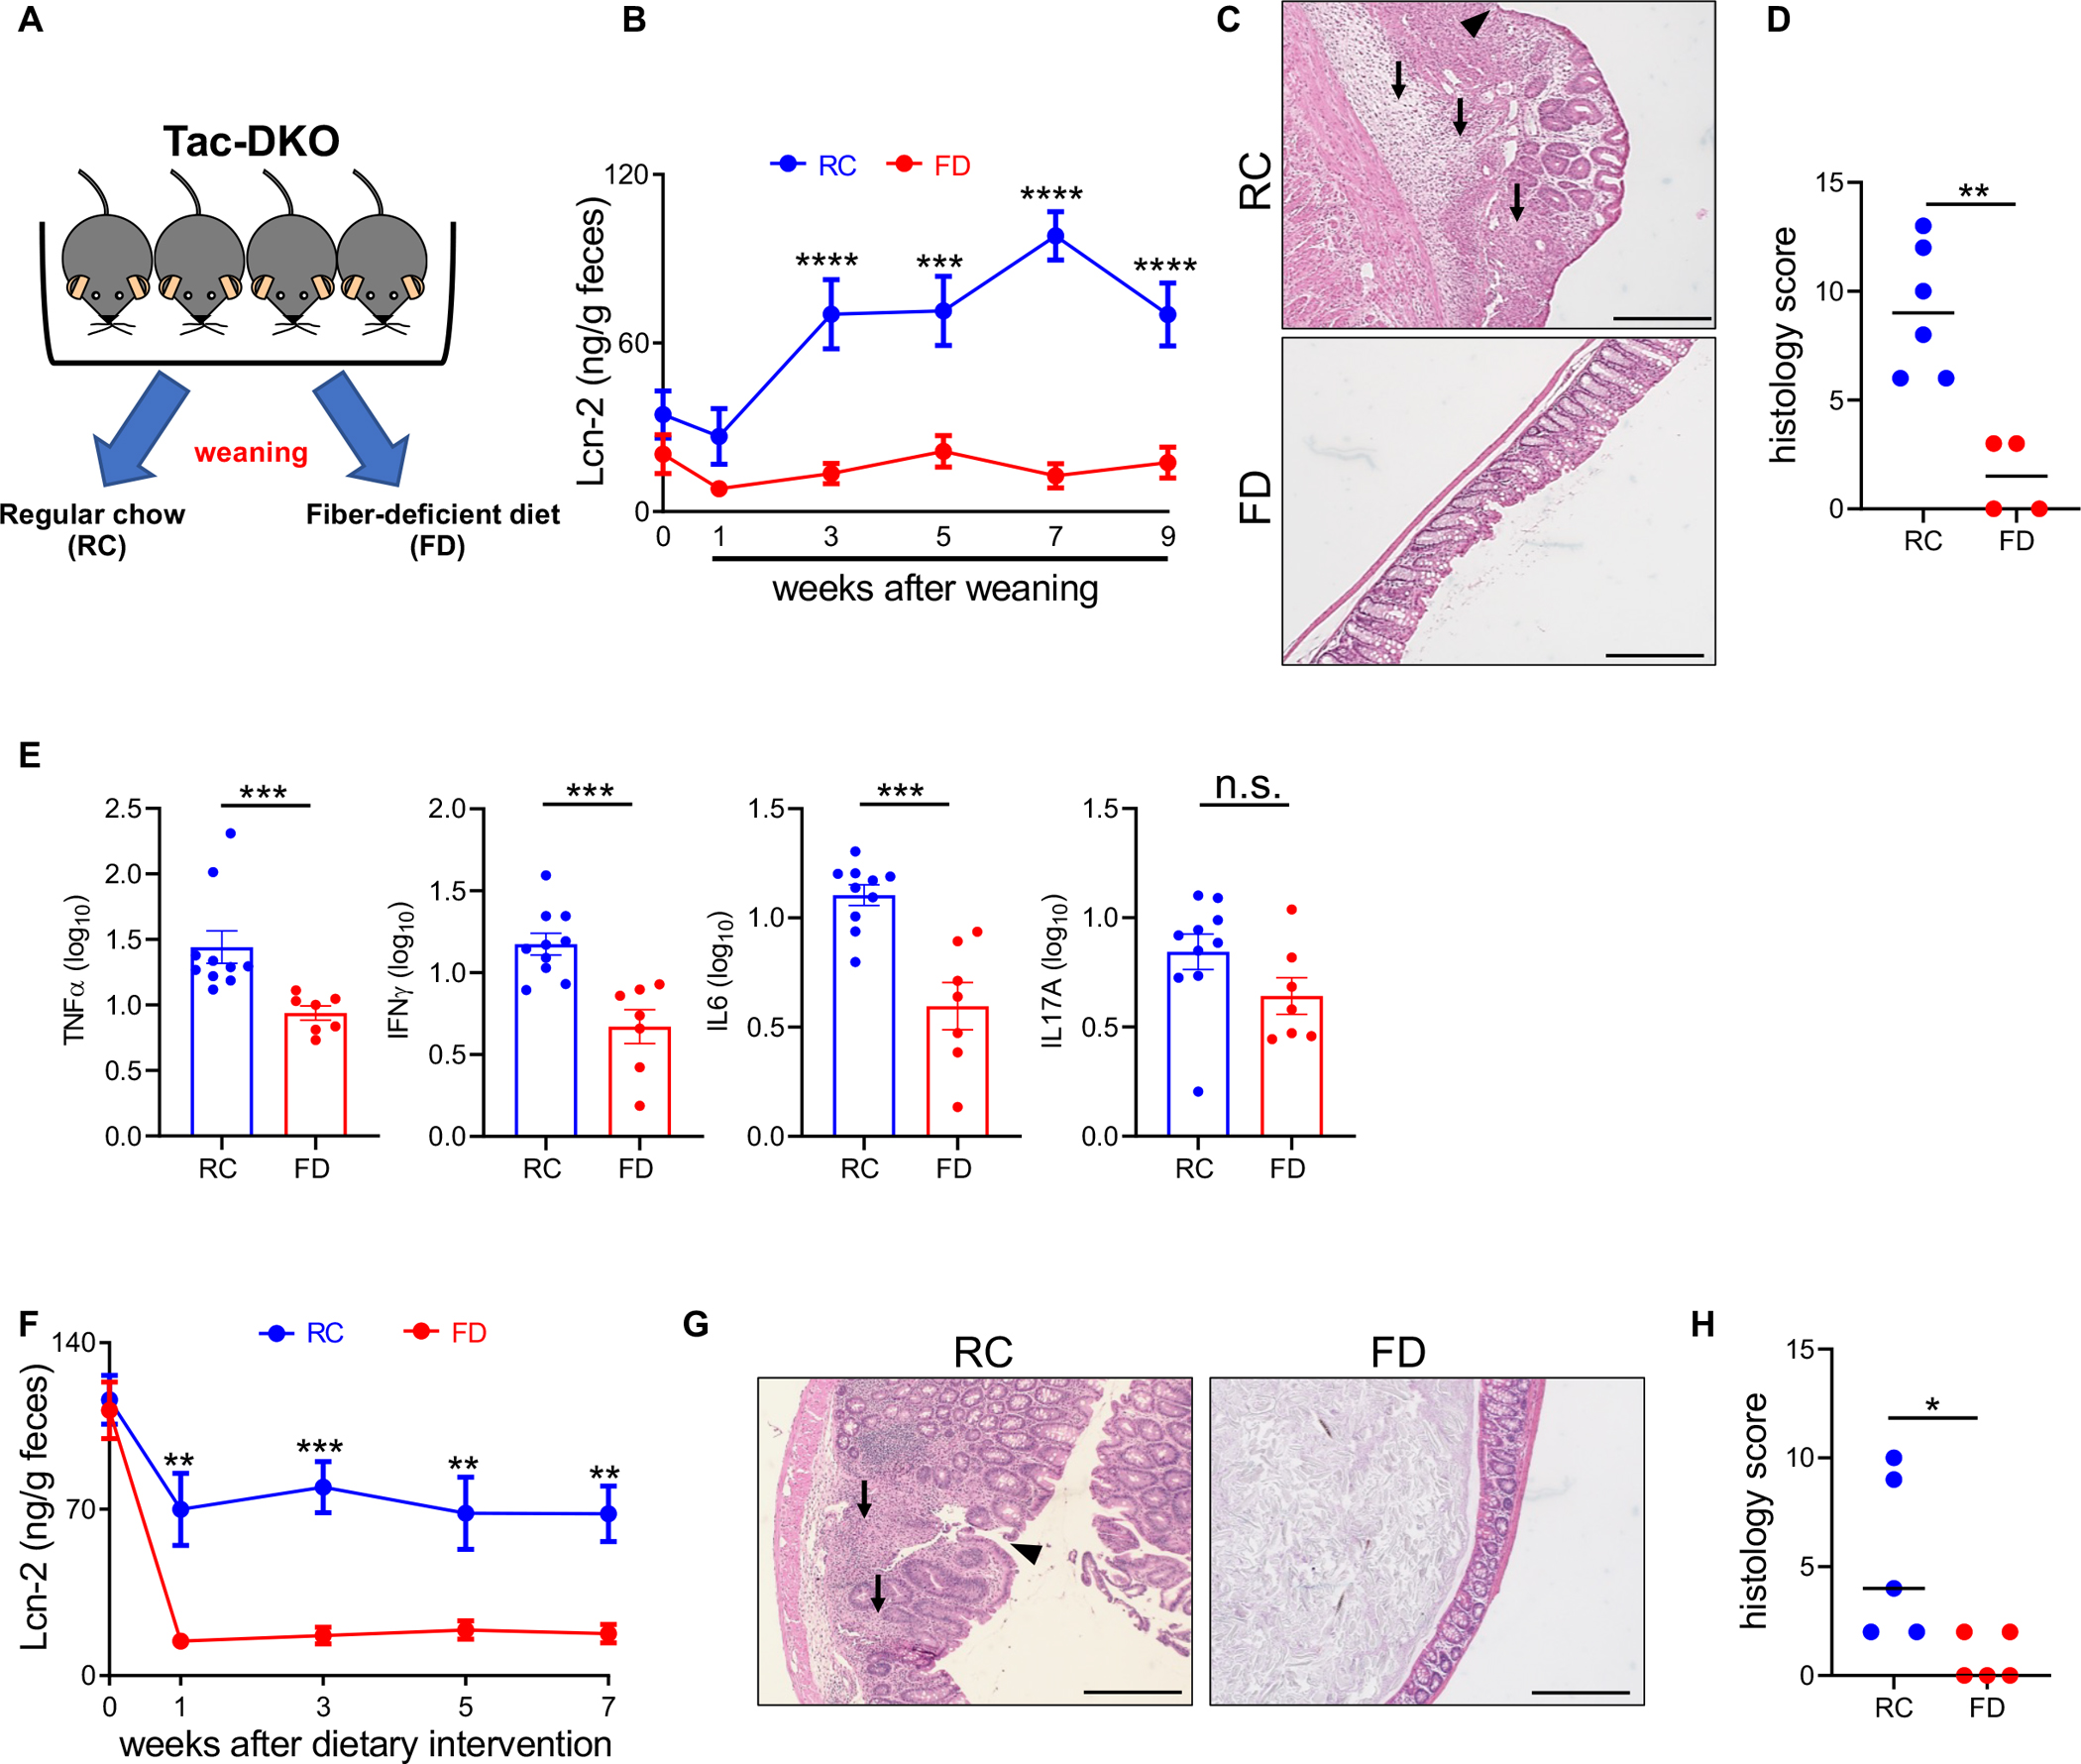
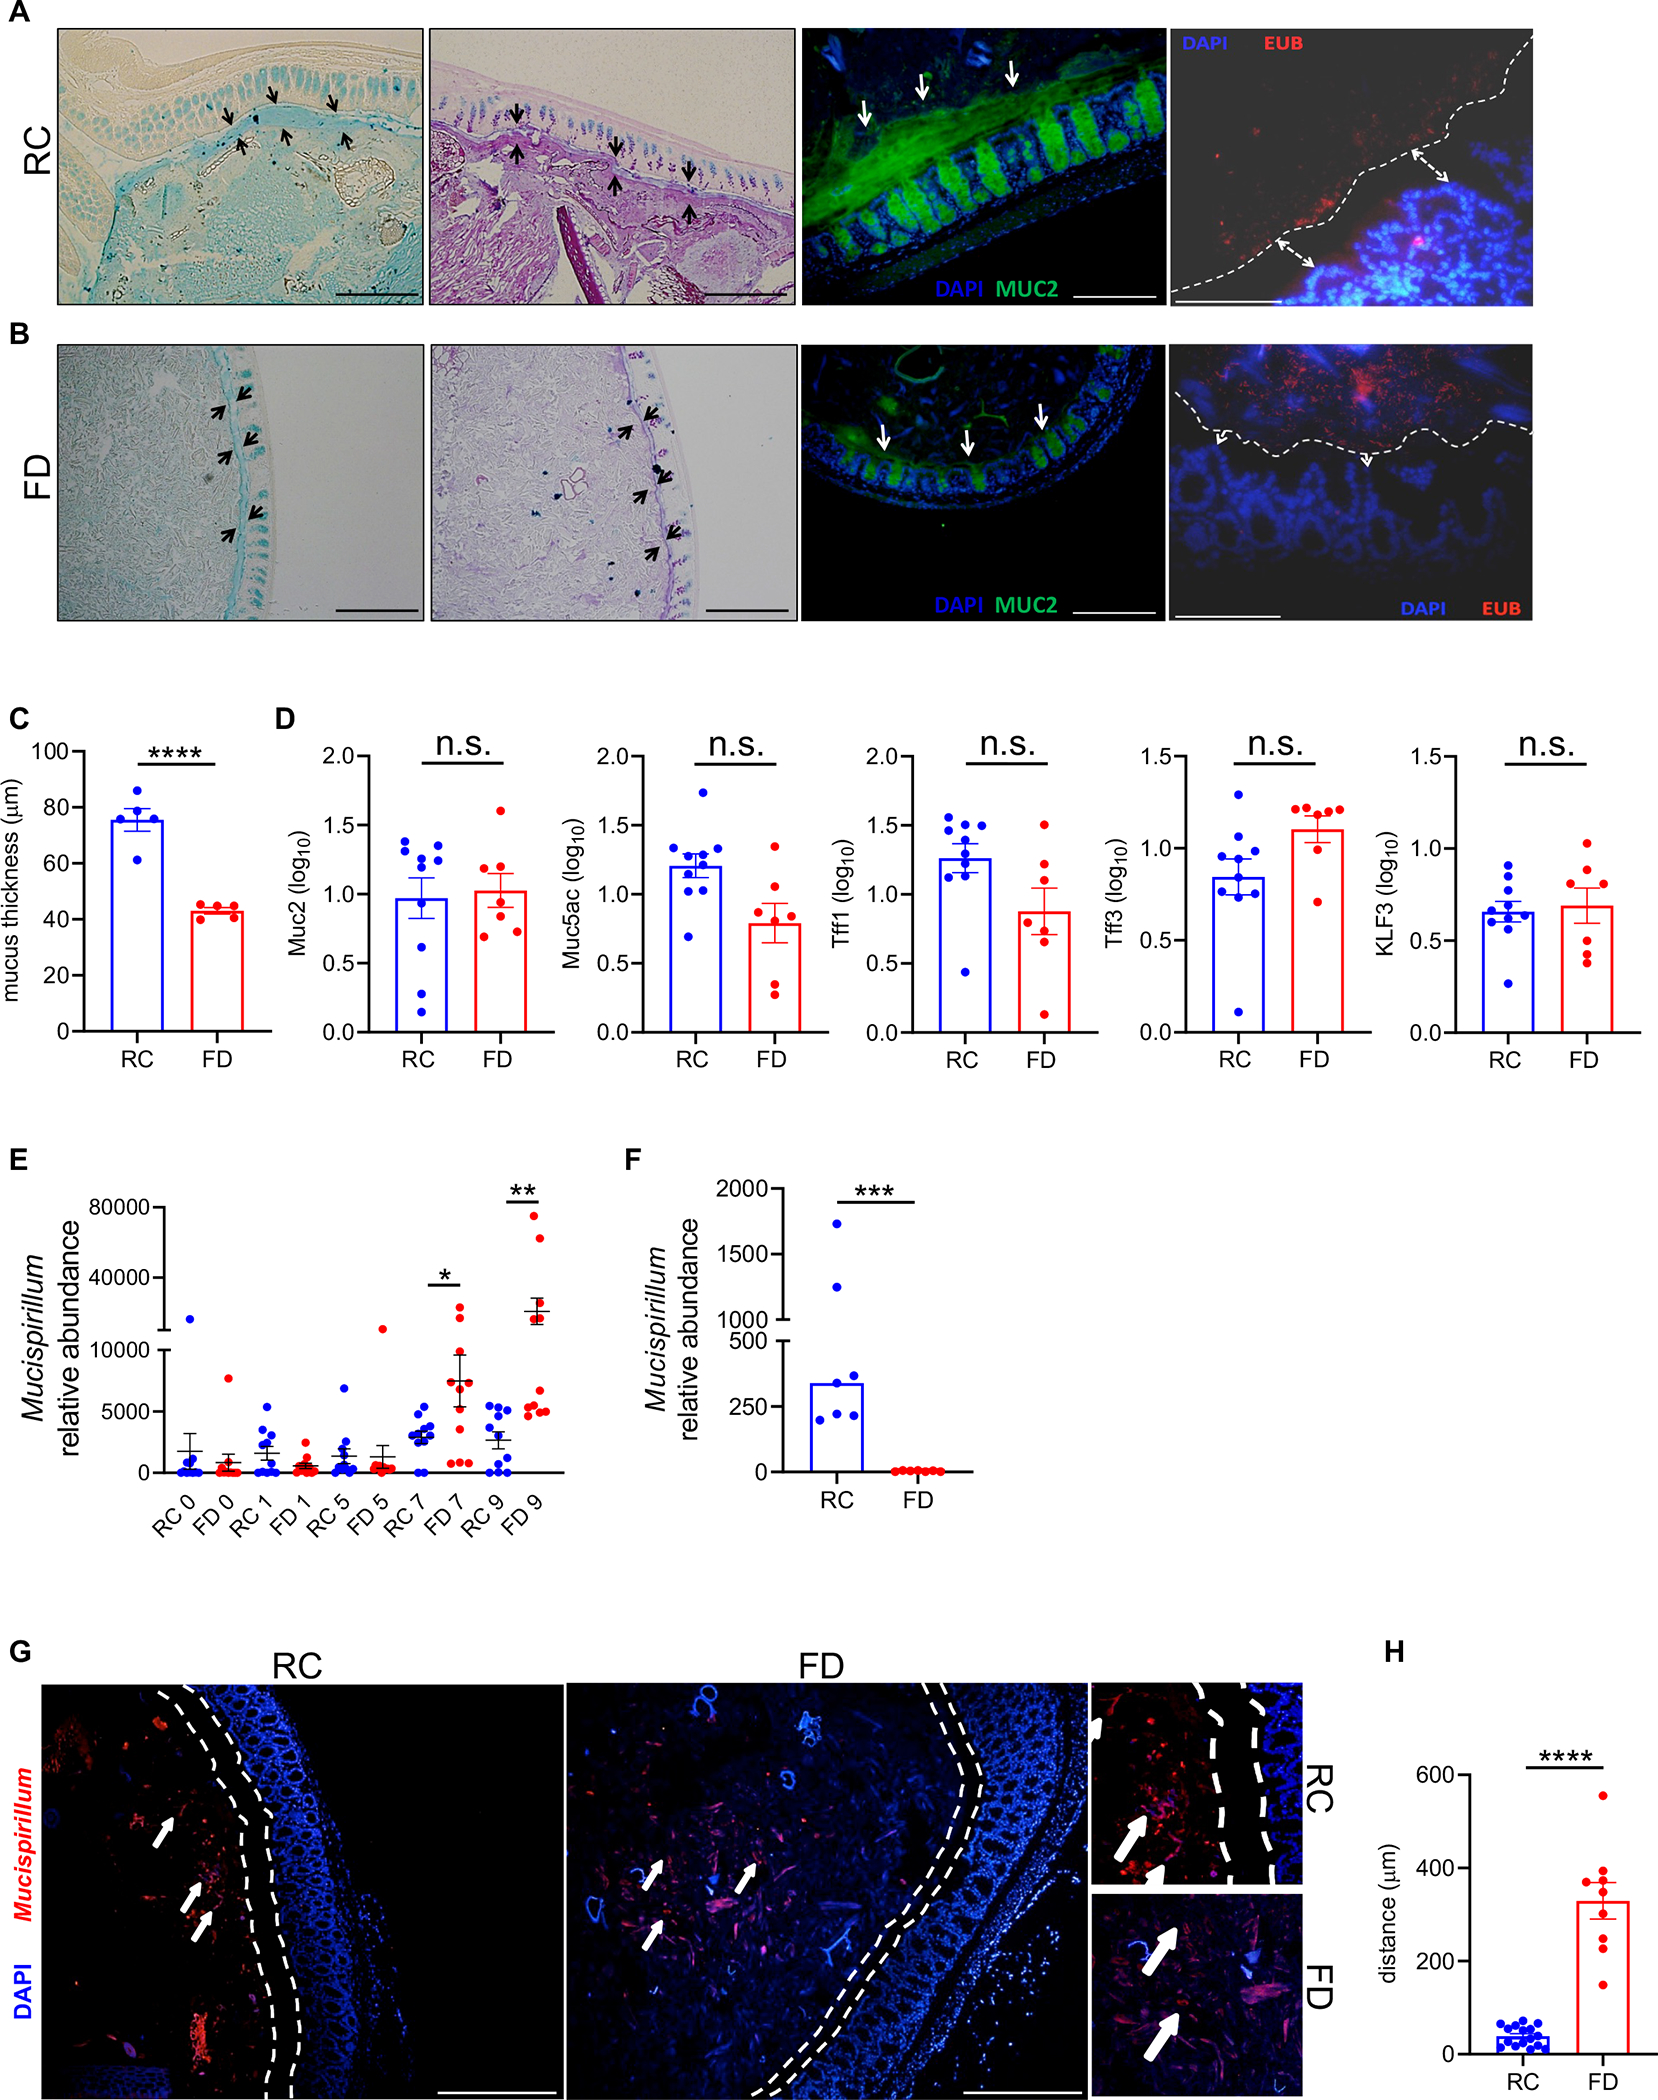
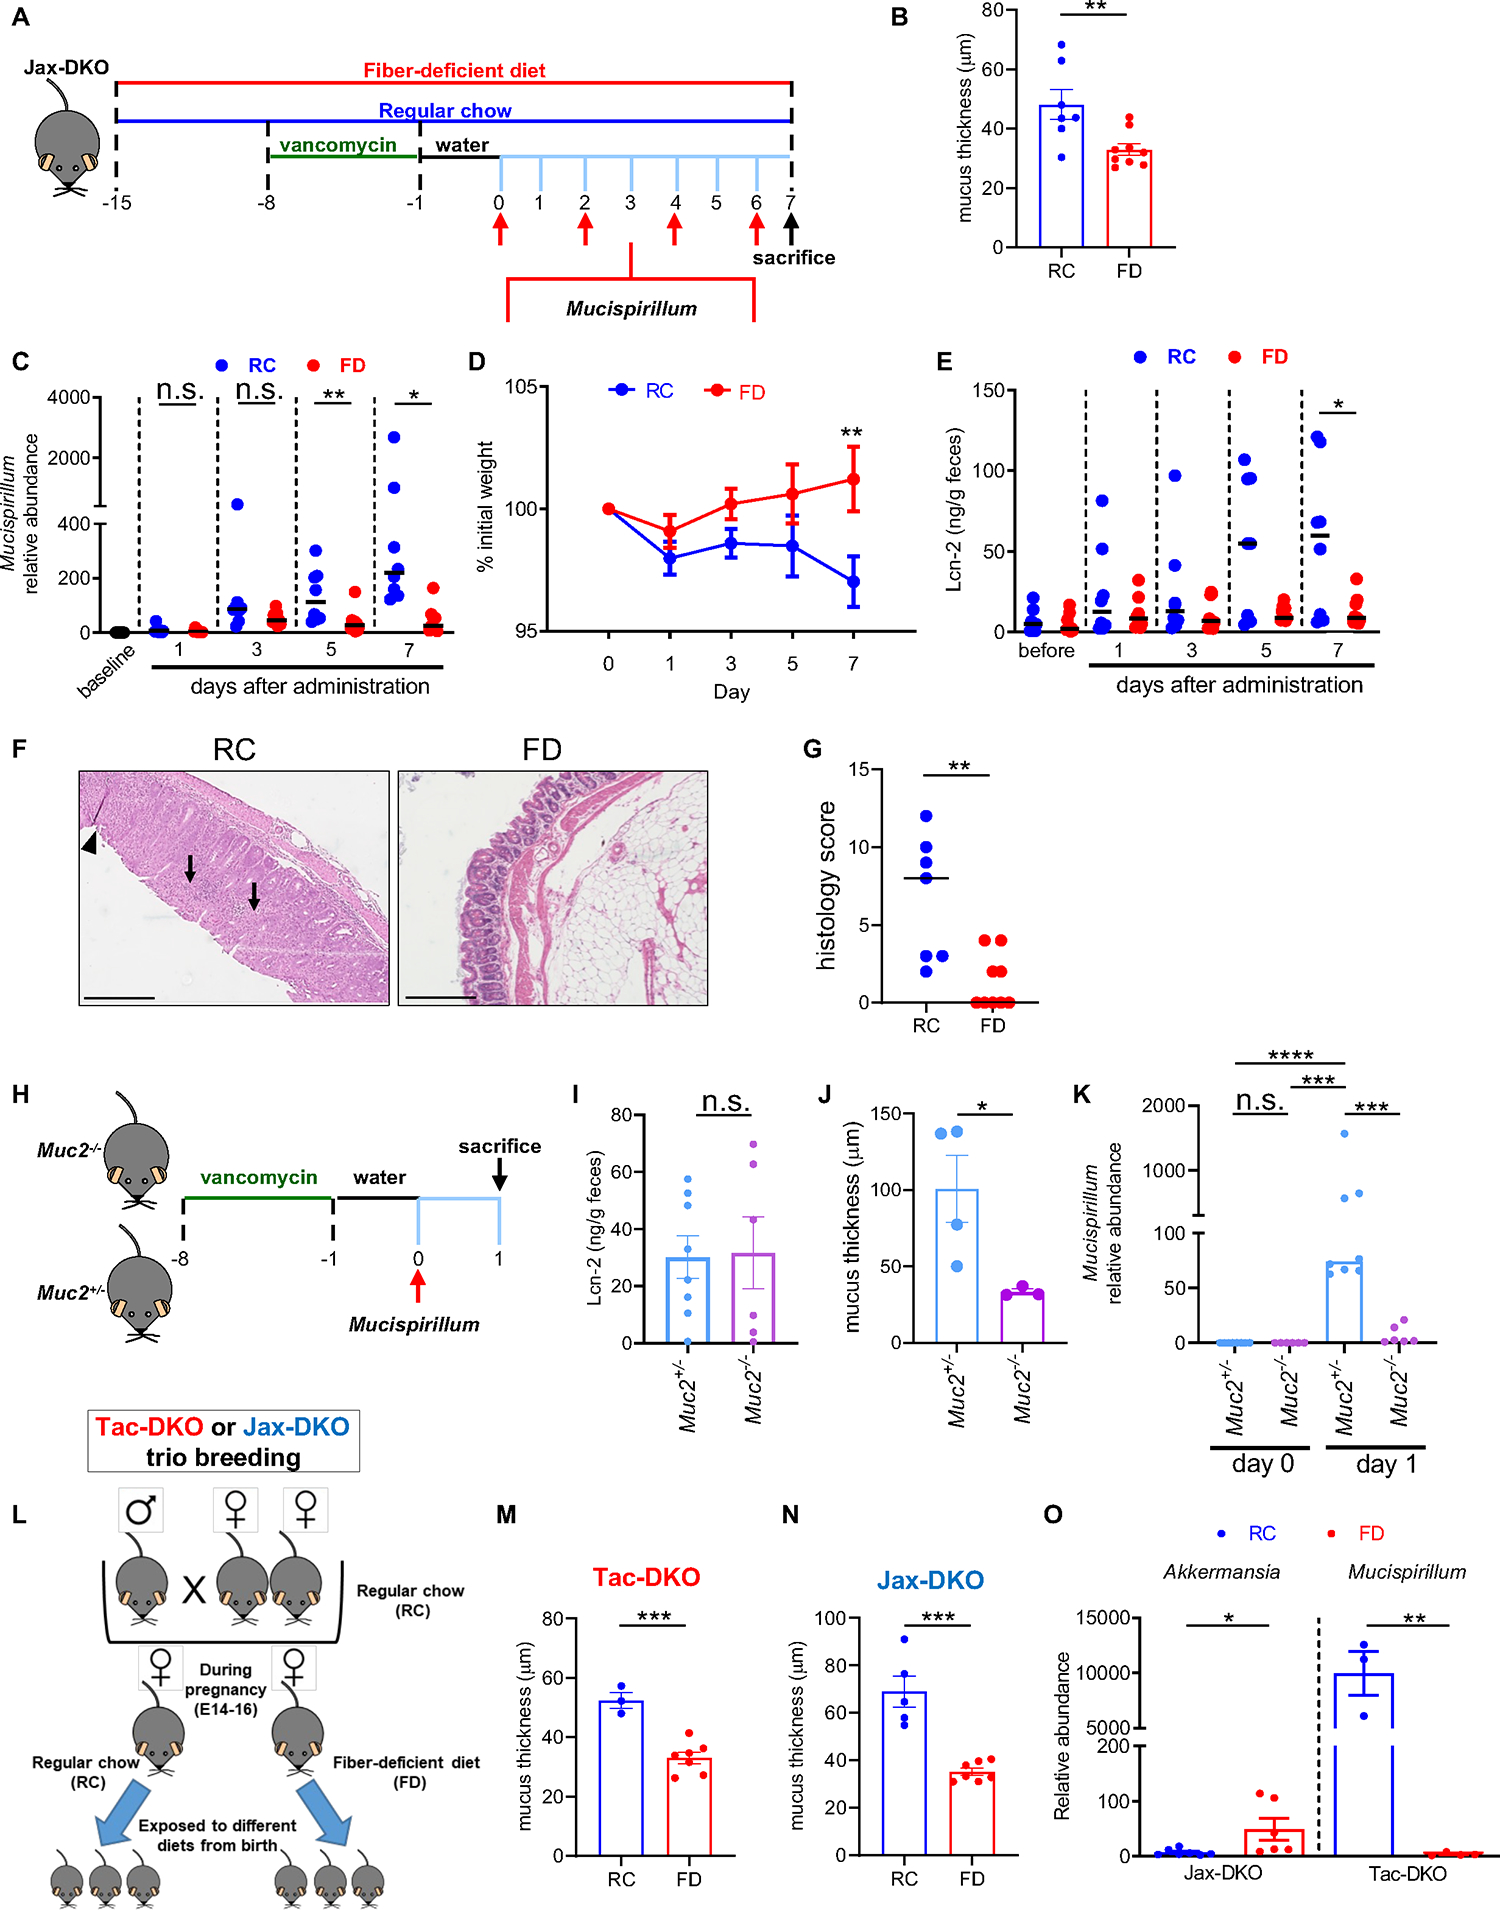
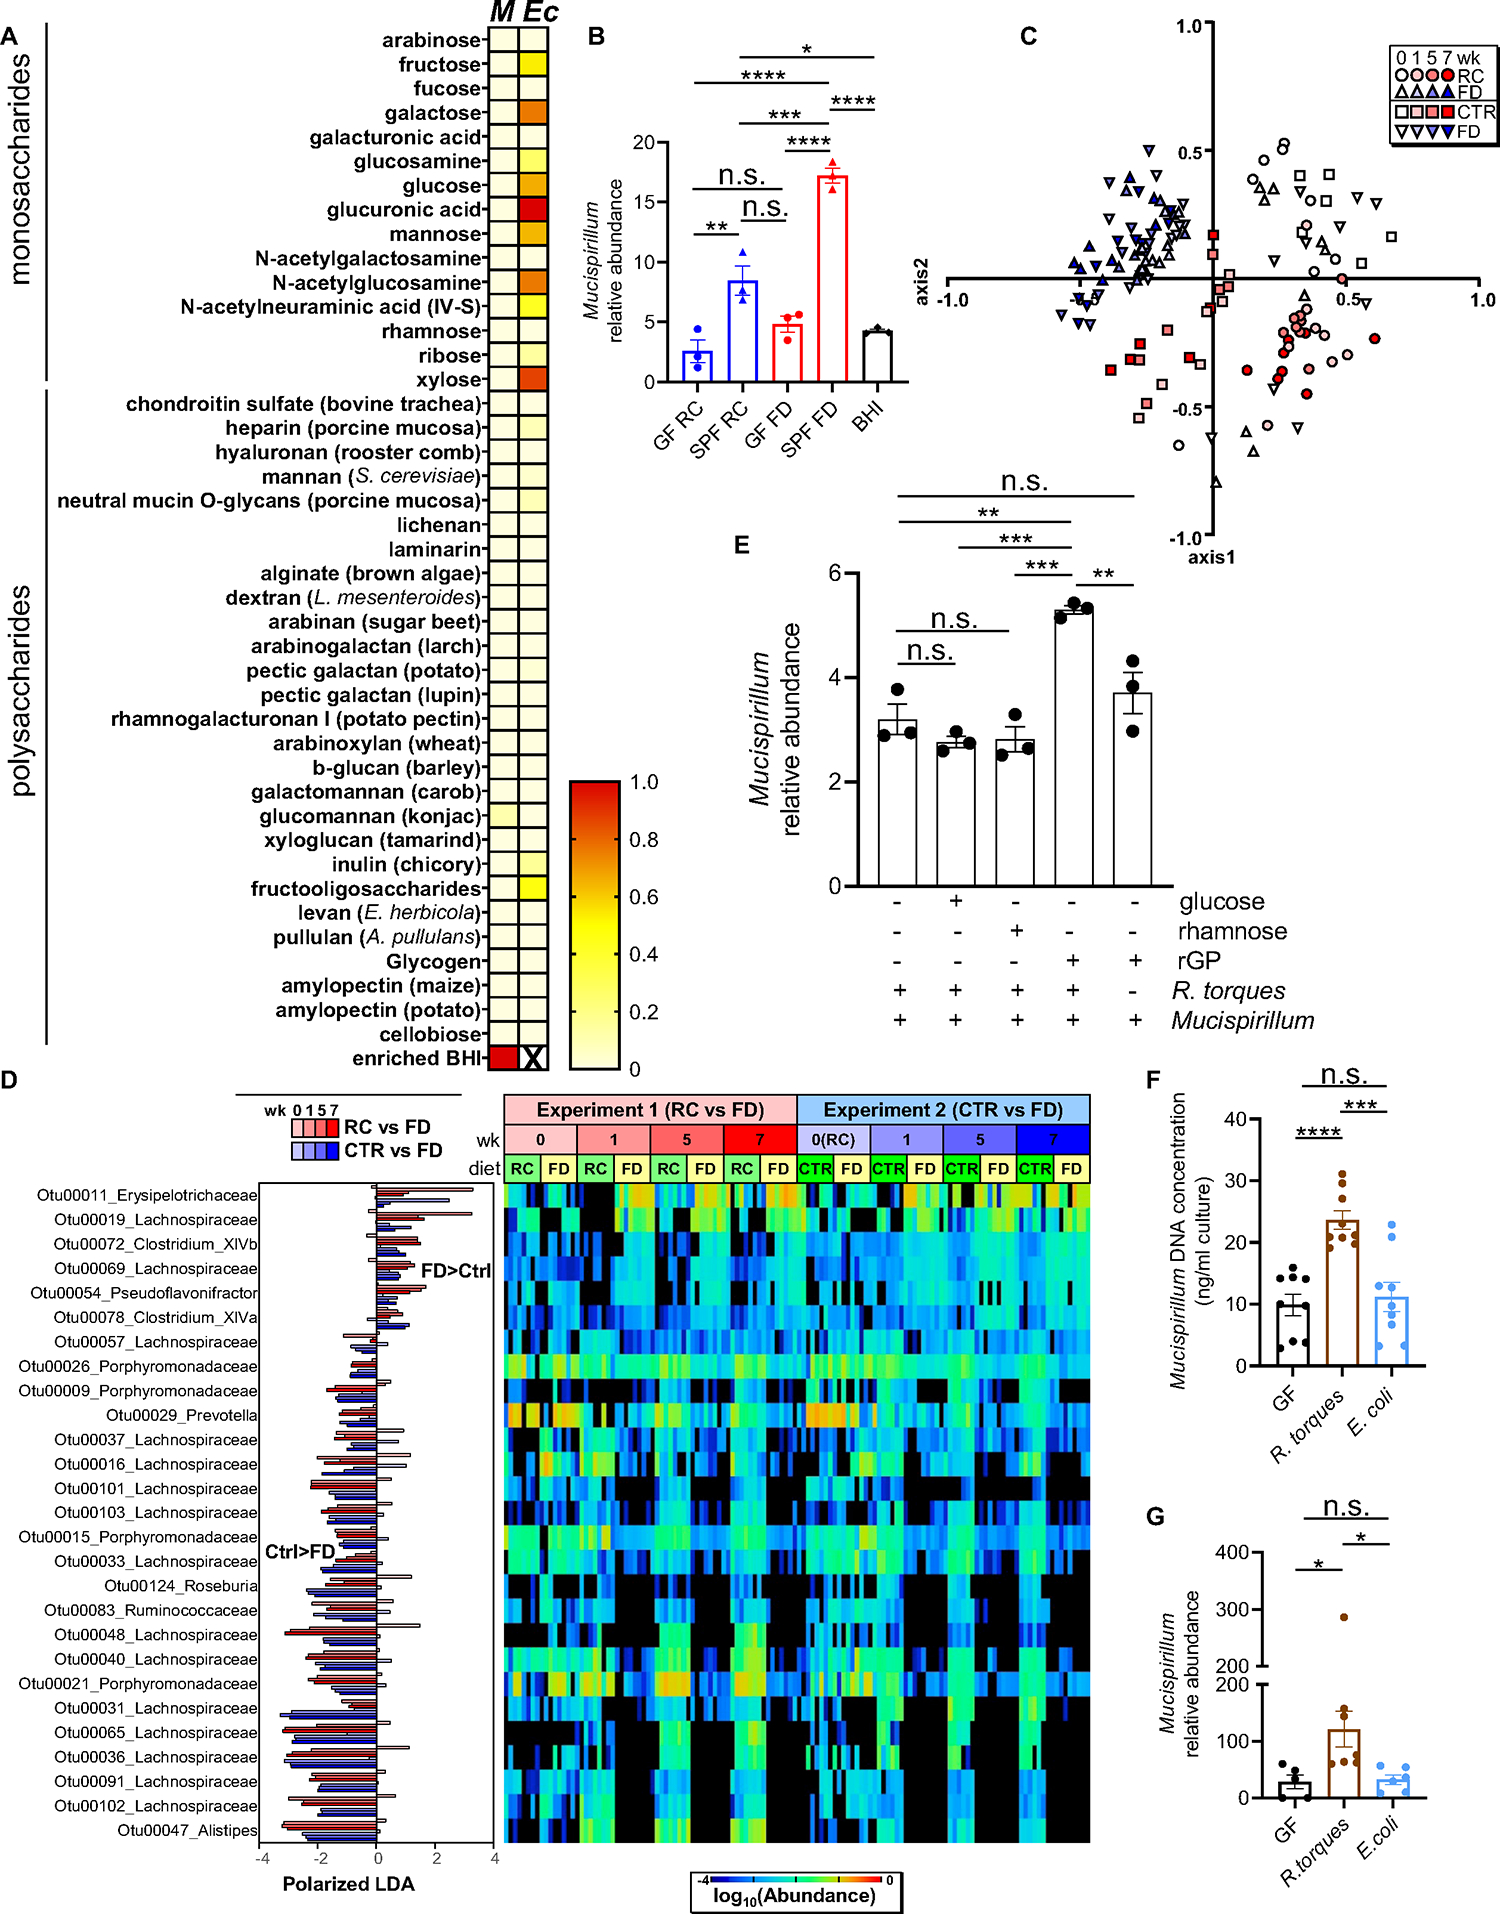
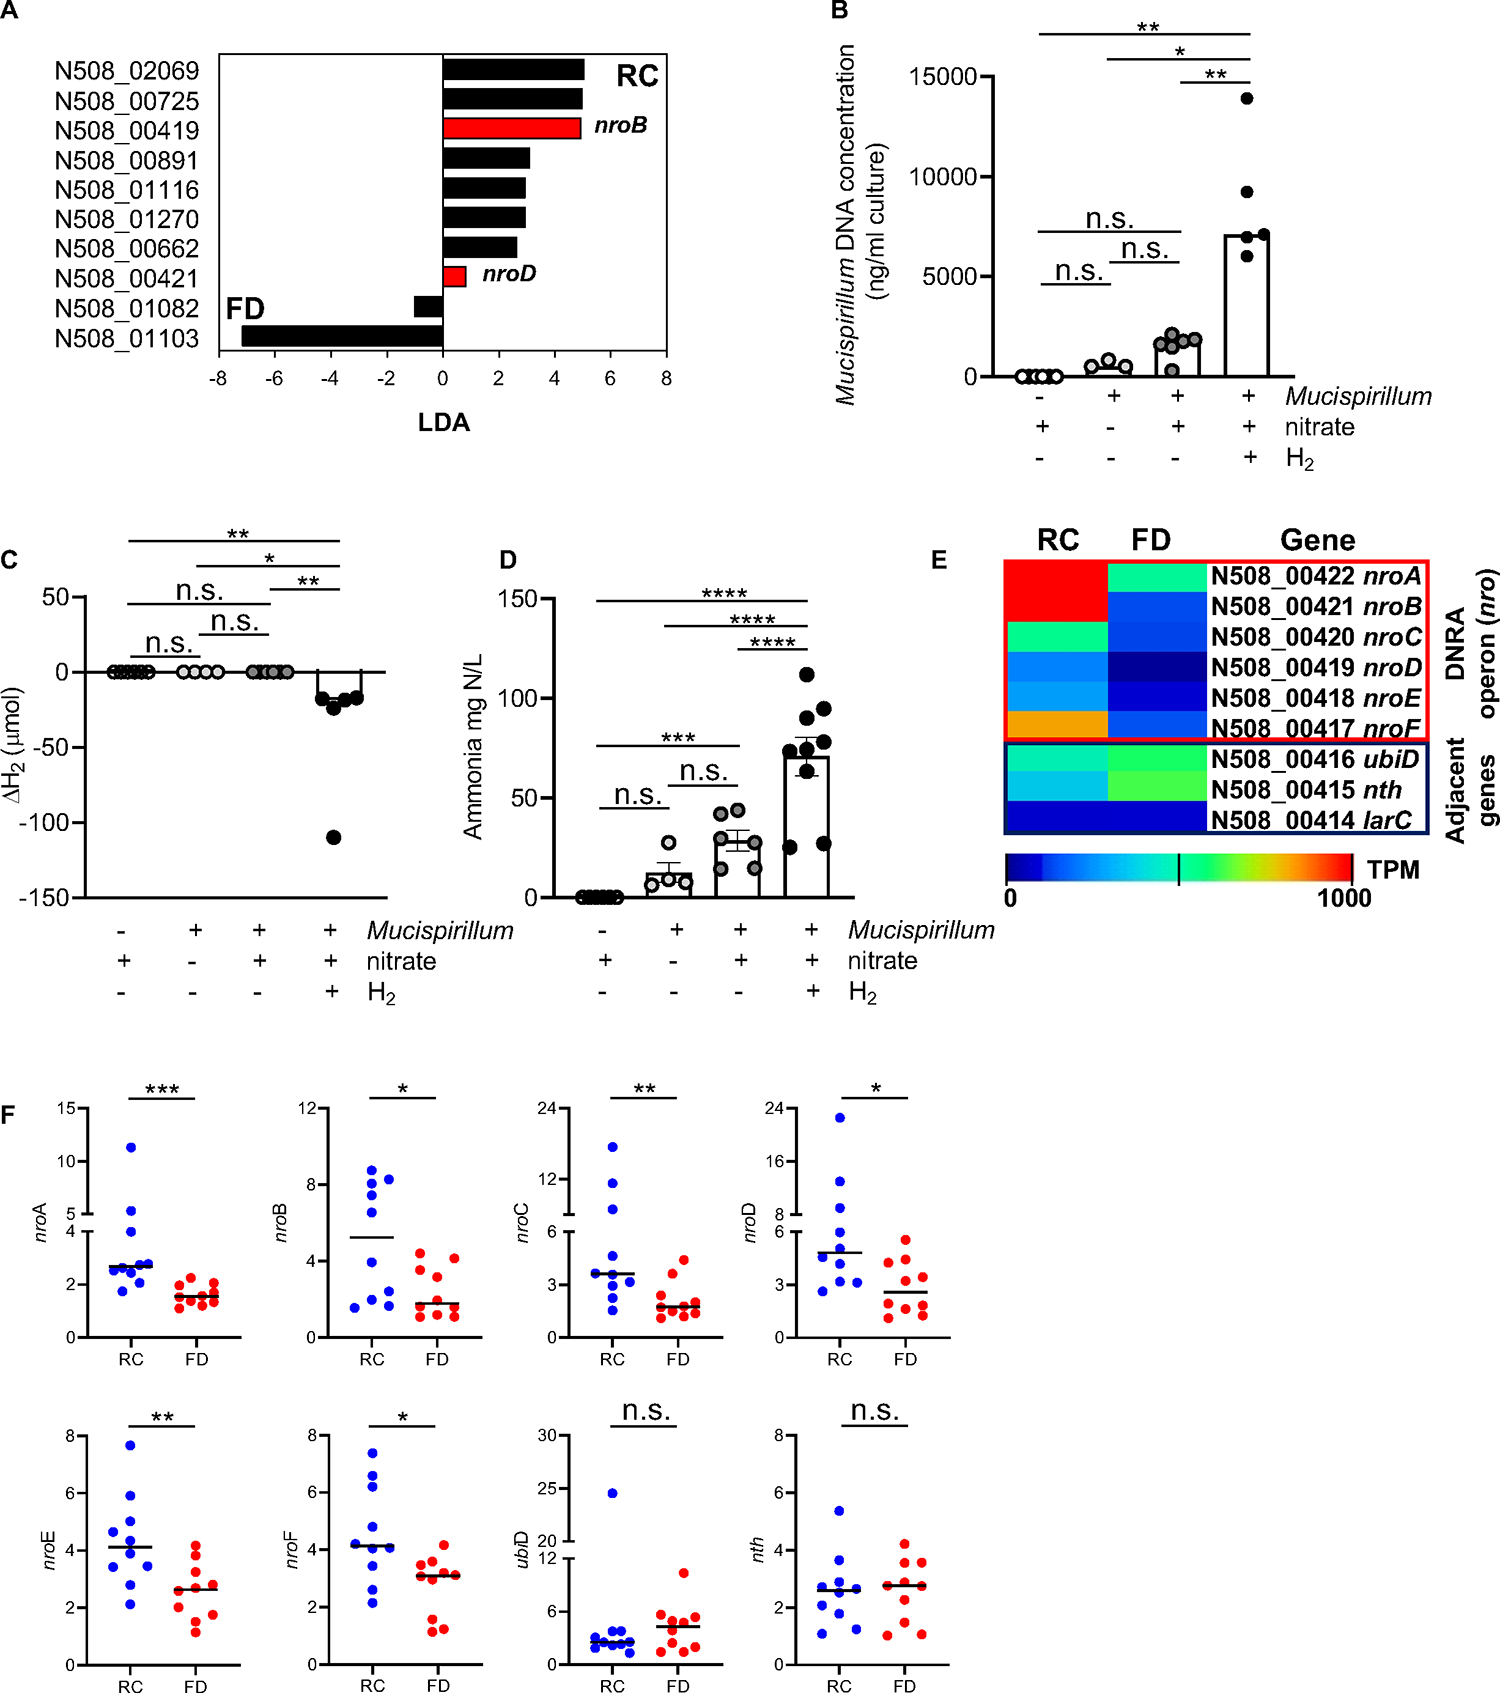
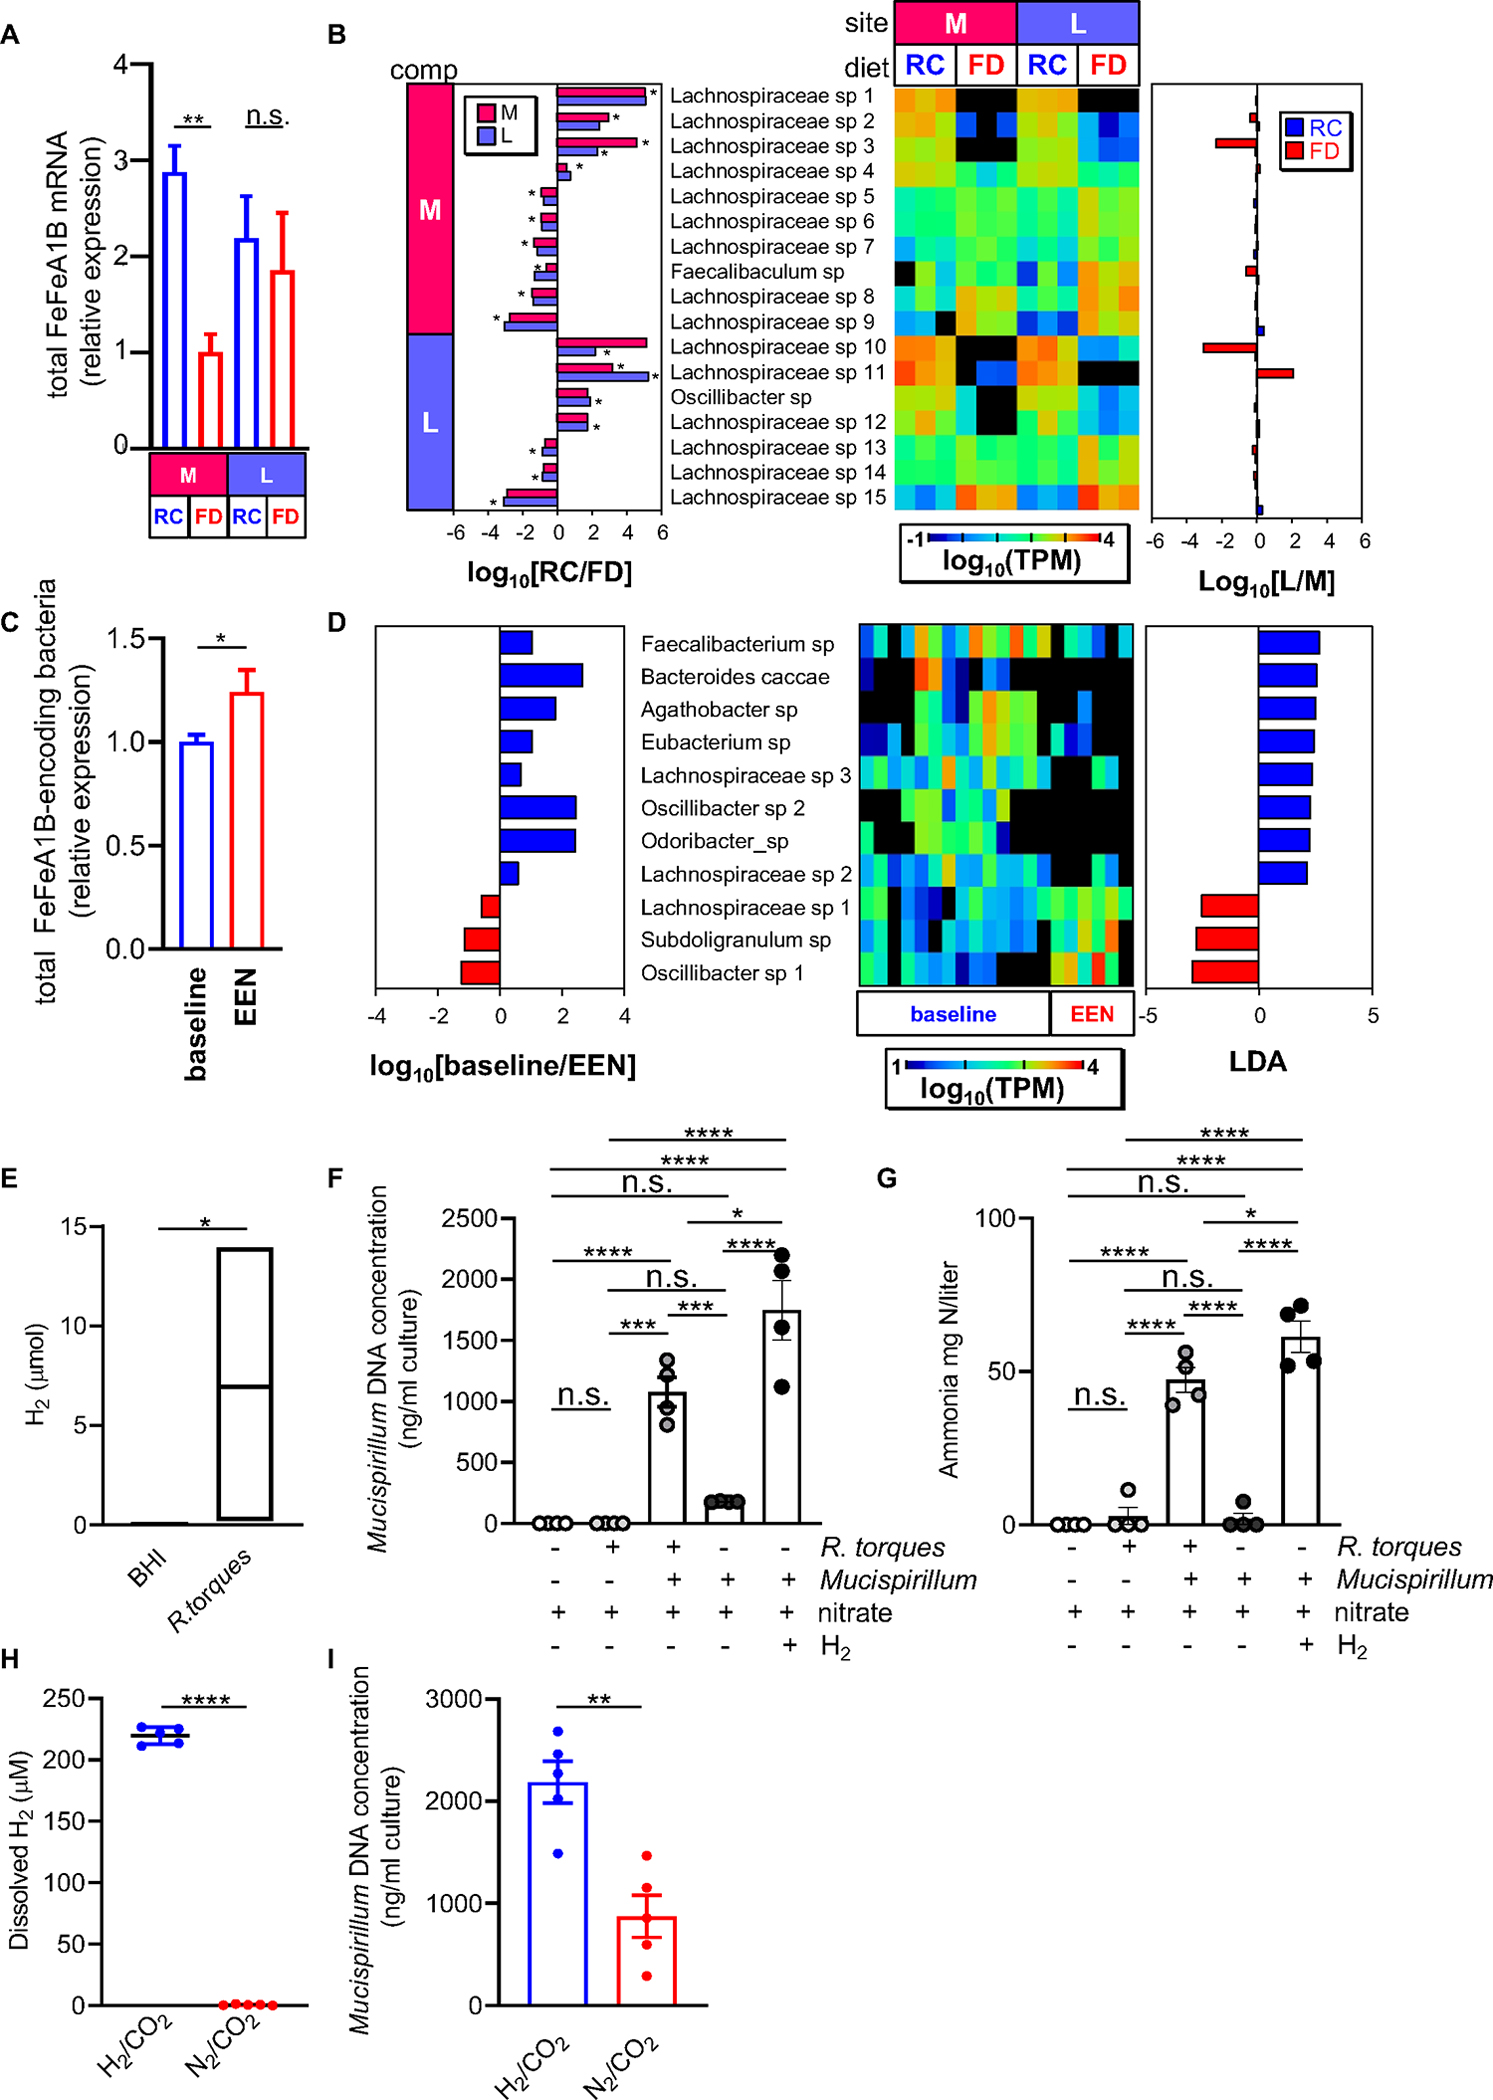
Exclusive enteral nutrition (EEN) with fiber-free diets is an effective steroid-sparing treatment to induce clinical remission in children with Crohn's disease (CD). However, the mechanism underlying the beneficial effects of EEN remains obscure. Using a model of microbiota-dependent colitis with the hallmarks of CD, we find that the administration of a fiber-free diet prevents the development of colitis and inhibits intestinal inflammation in colitic animals. Remarkably, fiber-free diet alters the intestinal localization of Mucispirillum schaedleri, a mucus-dwelling pathobiont, which is required for triggering disease. Mechanistically, the absence of dietary fiber reduces nutrient availability and impairs the dissimilatory nitrate reduction to ammonia (DNRA) metabolic pathway of Mucispirillum, leading to its exclusion from the mucus layer and disease remission. Thus, appropriate localization of the specific pathobiont in the mucus layer is critical for disease development, which is disrupted by fiber exclusion. These results suggest strategies to treat CD by targeting the intestinal niche and metabolism of disease-causing microbes.

Keywords: Crohn’s disease; Mucispirillum schaedleri; Ruminococcus torques; dissimilatory nitrate reduction to ammonia; exclusive enteral nutrition; fiber-free diet; mucus-dwelling pathobiont.


Conflict of interest statement

Declaration of interests The authors declare no competing interests.

Figures

Figure 1.
Figure 1.. Fiber-deficient diet inhibits intestinal inflammation in Tac-DKO mice.
(A) Schematic representation of the experimental design for feeding strategies. Fecal Lcn-2 levels in Tac-DKO mice fed either the RC or the FD during preventive (B), and therapeutic approach (F). Representative hematoxylin and eosin (H&E)-stained colonic sections from RC- and FD-fed Tac-DKO mice during preventive (C) and therapeutic (G) approach. Scale bar, 200 μm. Arrowhead shows ulcer. Black arrows indicate colonic transmural inflammation. Histology scores of colonic tissue from RC-fed Tac-DKO and FD-fed Tac-DKO mice during preventive (D) and therapeutic (H) approach. (E) Gene expression in colonic tissue of RC-fed and FD-fed Tac-DKO mice was normalized to GAPDH expression. Each symbol represents one mouse. Data are mean ± SEM (B, E and F), or median (D and H); and representative of at least two independent experiments, n= 4–12 per group. **p<0.01; ***p<0.001; ****p<0.0001; n.s. not significant by two-way repeated measures ANOVA followed by Sidak’s post-test (B and F), by two-tailed unpaired t-test (E) or by two-tailed Mann-Whitney U test (**p=0.0095, D; **p=0.0476, H). See also Figure S1; Tables S1 and S7.
Figure 2.
Figure 2.. Fiber-deficient diet leads to altered localization of gut pathobiont Mucispirillum in Tac-DKO mice.
Alcian blue-stained (first panel from the left) and Alcian blue/PAS-stained (second panel from the left) colonic sections from RC-fed (A) and FD-fed (B) Tac-DKO mice. Opposing black arrows delineate the mucus layer. Scale bars, 200 μm. Immunofluorescence images of colonic sections (third panel from the left) from RC-fed (A) and FD-fed (B) Tac-DKO mice stained with anti-Muc2 antibody (green) and DAPI (blue). White arrows indicate the mucus layer. Scale bars, 200 μm. Fluorescence in situ hybridization (FISH) (right panel) of colonic sections from RC-fed (A) and FD-fed (B) Tac-DKO mice (red, EUB338 probe; blue, DAPI). Dashed white line and white arrows delineate mucus layer. Scale bars, 100 μm. (C) Colonic mucus layer measurements in RC-fed and FD-fed Tac-DKO mice. (D) Gene expression in colonic tissue of RC-fed and FD-fed Tac-DKO mice was normalized to GAPDH expression. (E) Abundance of Mucispirillum in fecal DNA from RC-fed and FD-fed Tac-DKO mice was normalized to the universal 16S rRNA gene. (F) Abundance of Mucispirillum in colonic mucus scrapings harvested from RC-fed and FD-fed Tac-DKO mice was normalized to the universal 16S rRNA gene. (G) FISH analysis using Mucispirillum-specific probe (red) and DAPI (blue) of colonic sections from RC-fed (left panel) and FD-fed (right panel) Tac-DKO mice. Dashed white lines delineate mucus layer. White arrows indicate Mucispirillum. Scale bars, 200 μm. Insets: shows a higher magnification of Mucispirillum in proximity to host epithelium in RC-fed animals (top inset), and in the lumen in FD-fed mice (lower inset). (H) Distance from bacterium Mucispirillum to the inner mucus layer in RC- or FD-fed Tac-DKO mice. Each symbol represents one mouse. Data are mean ± SEM (C, D, E and H), or median (F), and representative of at least two independent experiments, n= 5–11 per group. *p< 0.05; **p<0.01; ***p<0.001; ****p<0.0001; n.s. not significant by two-tailed unpaired t-test (C, D and H), by one-way ANOVA followed by Tukey’s post-test (E), or by two-tailed Mann-Whitney U test (***p=0.0006, F). See also Figure S2; Table S7.
Figure 3.
Figure 3.. The intestinal mucus layer is critical for Mucispirillum intestinal colonization.
(A) Schematic representation of Mucispirillum challenge in Jax-DKO mice. (B) Colonic mucus layer measurements in RC-fed and FD-fed Jax-DKO mice. (C) Luminal abundance of Mucispirillum prior (baseline) and every other day up to 7 days after bacterial administration in RC-fed and FD-fed Jax-DKO mice was normalized to the universal 16S rRNA gene. (D) Body weight during the 7-day bacterial challenge in RC-fed and FD-fed Jax-DKO mice. (E) Fecal Lcn-2 levels before (day 0) and 7 days after the first Mucispirillum oral gavage. (F) Representative H&E-stained colonic sections from Mucispirillum-infected Jax-DKO mice fed either RC or the FD. Scale bar, 200 μm. Black arrows indicate colonic inflammatory infiltrate and crypt architectural distortion. (G) Histology scores of colonic tissues from Mucispirillum-infected Jax-DKO fed either RC or the FD. (H) Schematic representation of Mucispirillum challenge in Muc2−/− mice. (I) Fecal Lcn-2 levels 1 day after the oral gavage in Muc2+/− and Muc2−/− mice. (J) Colonic mucus thickness measurements in Mucispirillum-infected Muc2+/− and Muc2−/− mice. (K) Luminal Abundance of Mucispirillum in in Muc2+/− and Muc2−/− mice prior (day 0), and 1 day after bacterial administration was normalized to the universal 16S rRNA gene. (L) Schematic representation of the experimental design for trio breeding experiments. Colonic mucus thickness measurements in Tac-DKO (M) and Jax-DKO (N) pups fed either RC or the FD from birth. (O) Abundance of A. muciniphila (Akkermansia) and Mucispirillum in Jax-DKO and Tac-DKO pups, respectively, was normalized to the universal 16S rRNA gene. Each symbol represents one mouse. Data are mean ± SEM (B, D, I-J, M-O), or median (C, E and K), and representative of at least two independent experiments, n= 3–9 per group. *p< 0.05; **p<0.01; ***p<0.001; ****p<0.0001; n.s. not significant by Kruskal-Wallis test followed by Dunn’s post-test (C, E and K), by two-way ANOVA followed by Sidak’s post-test (D), by two-tailed Mann-Whitney U test (**p=0.0053, G), or by two-tailed unpaired t-test (**p=0.0081, B; n.s., I; *p=0.0498, J; ***p=0.0006, M; ***p=0.0002, N; **p=0.0424 Jax-DKO, O; **p=0.0018 Tac-DKO, O). See also Figure S3; Table S7.
Figure 4.
Figure 4.. Mucin-degrading microbes promote Mucispirillum growth.
(A) Heat map showing normalized growth values of Mucispirillum (M) or E. coli (Ec) (enriched BHI, positive control for Mucispirillum). (B) Mucispirillum growth in the presence of either GF- or SPF-derived supernatants (enriched BHI (BHI), positive control). Mucispirillum abundance was normalized to the universal 16S rRNA gene. (C) NMDS plot of θYC β-diversity indexes of fecal microbiota from Tac-DKO mice fed either RC (circles), CTR (squares) or FD (triangles) for up to 7 weeks. (D) OTUs differentially abundant in fecal microbiota of Tac-DKO mice fed the FD or the control diets (RC or CTR) shown with LDA values of LEfSe with p<0.05, false discovery rate <0.05 and maximal abundance cutoff <1%. (E) Mucispirillum and R. torques co-culture in custom chopped meat broth in the presence of rectal glycoproteins (rGP), glucose or rhamnose. Mucispirillum abundance was normalized to the universal 16S rRNA gene. (F) Mucispirillum growth in the presence of supernatants derived from GF, R. torques-monocolonized and E. coli-monocolonized mice. (G) Abundance of Mucispirillum in GF, R. torques-monocolonized and E. coli-monocolonized mice was normalized to the universal 16S rRNA gene. Each symbol represents one mouse, except for panel B, in which each dot represents data pooled from 3 individual mice. Data are mean ± SEM, representative of at least two independent experiments, n= 5–9 per group. *p< 0.05; **p<0.01; ***p<0.001; ****p<0.0001; n.s. not significant by one-way ANOVA followed by Tukey’s post-test. See also Figures S4 and S5; Tables S2, S3 and S7.
Figure 5.
Figure 5.. Dietary fiber affects dissimilatory nitrate reduction to ammonium in Mucispirillum.
(A) Mucispirillum genes differentially expressed in the two groups of diets (RC vs FD) shown with LDA values by LEfSe with p<0.05, maximum transcript per million (TPM)>10, and >5-fold difference. Red bars indicate nroB and nroD genes that encode putative α and δ subunits of the nitrate reductase, respectively. Black bars indicate genes encoding for uncharacterized proteins. Mucispirillum was grown in the presence/absence of nitrate (10mM) and H2 (80%) in enriched BHI and then Mucispirillum growth (B), H2 consumption (C) and ammonium measurements (D) were assessed after three days. (E) Heat map showing the DNRA operon (nro) (loci N508_00422-N508_00417) in mucus isolates from RC- or FD-fed Tac-DKO mice (adjacent genes, control). Average transcript levels (log10 TPM) in RC- and FD-fed mice. p=not significant. (F) Gene expression in mucus isolates from RC-fed or FD-fed Tac-DKO animals normalized to gap expression. Each symbol represents one mouse. Data are mean ± SEM (D), or median (B, C and F), and representative of at least two independent experiments, n= 4–10 per group. *p< 0.05; **p<0.01; ***p<0.001; ****p<0.0001; n.s. not significant by Kruskal-Wallis test followed by Dunn’s post-test (B-C), by one-way ANOVA followed by Tukey’s post-test (D), by two-tailed unpaired t-test (E), or by two-tailed Mann-Whitney U test (***p=0.0002, nroA; *p=0.0355, nroB; **p=0.0089, nroC; *p=0.0232, nroD; **p=0.0068, nroE; *p=0.0185, nroF; n.s. not significant, nth and ubiD, F). See also Figure S6; Tables S4 and S7.
Figure 6.
Figure 6.. Fiber exclusion alters fermentative H2 metabolism and interspecies H2 transfer.
(A) Relative expression level of total FeFe hydrogenase groups A1 and B in mucus (M) and luminal (L) compartments of RC-fed and FD-fed Tac-DKO mice. FeFe Groups A1 and B expression was normalized to 20 housekeeping genes. (B) Genes were selected by comparison between RC and FD at L and M compartments. Microbial species that were differentially abundant in RC vs FD group, and in L vs M are shown as log10 RC/FD (left panel), log10 TPM (central heat map), and log10 L/M (right panel). (C) Abundance of total bacterial FeFe hydrogenase group A1 and B homologues normalized by the abundance of 20 housekeeping genes in the data obtained from CD patients (Original raw data SRP057027 retrieved from ). (D) Specific FeFe A1/B homologues-harboring species with differential abundance between baseline and 1-week EEN treatment (right panel) are shown with heat map (central panel, log10 TPM) and LDA values of LEfSe with p<0.05 (left panel). (E) H2 content in R. torques cultures (enriched BHI medium, control). Mucispirillum was grown in the presence/absence of R. torques, nitrate (10mM) and H2 (80%) in enriched BHI. Mucispirillum growth (F) and ammonium measurements (G) were assessed after three days. Co-cultures of R. torques and Mucispirillum in bioreactor vessels sparged with a mixed gas containing 20% CO2 and either 80% N2 or 80% H2. (H) Dissolved H2 concentration at 26.5 hours post-inoculation. (I) Mucispirillum growth at day 3 post-inoculation. Each symbol represents one mouse. Data are mean ± SEM (A, C, F-I), or floating bars show max and min values and line at median (E), and representative of at least two independent experiments, n= 4–5 per group. **p<0.01; ***p<0.001; ****p<0.0001; n.s. not significant by one-way ANOVA followed by Tukey’s post-test (A, F-G), by two-tailed Mann-Whitney U test (*p=0.02, C; *p=0.0286, E), or by two-tailed unpaired t-test (****p<0.0001, H; **p=0.0020, I). See also Figure S7; Table S5, S6 and S7.

Comment in

References

    1. Xavier RJ, and Podolsky DK (2007). Unravelling the pathogenesis of inflammatory bowel disease. Nature 448, 427–434. 10.1038/nature06005. - DOI - PubMed
    1. Peloquin JM, Goel G, Villablanca EJ, and Xavier RJ (2016). Mechanisms of Pediatric Inflammatory Bowel Disease. Annu Rev Immunol 34, 31–64. 10.1146/annurev-immunol-032414-112151. - DOI - PubMed
    1. Ng SC, Shi HY, Hamidi N, Underwood FE, Tang W, Benchimol EI, Panaccione R, Ghosh S, Wu JCY, Chan FKL, et al. (2017). Worldwide incidence and prevalence of inflammatory bowel disease in the 21st century: a systematic review of population-based studies. Lancet 390, 2769–2778. 10.1016/S0140-6736(17)32448-0. - DOI - PubMed
    1. Windsor JW, and Kaplan GG (2019). Evolving Epidemiology of IBD. Curr Gastroenterol Rep 21, 40. 10.1007/s11894-019-0705-6. - DOI - PubMed
    1. Benchimol EI, Mack DR, Nguyen GC, Snapper SB, Li W, Mojaverian N, Quach P, and Muise AM (2014). Incidence, outcomes, and health services burden of very early onset inflammatory bowel disease. Gastroenterology 147, 803–813 e807; quiz e814–805. 10.1053/j.gastro.2014.06.023. - DOI - PubMed

Publication types

Associated data

LinkOut - more resources