. 2023 Nov 15;14(1):7384.
doi: 10.1038/s41467-023-42390-4.

Nucleolar reorganization after cellular stress is orchestrated by SMN shuttling between nuclear compartments

Affiliations

Nucleolar reorganization after cellular stress is orchestrated by SMN shuttling between nuclear compartments

Shaqraa Musawi et al. Nat Commun. .

Abstract

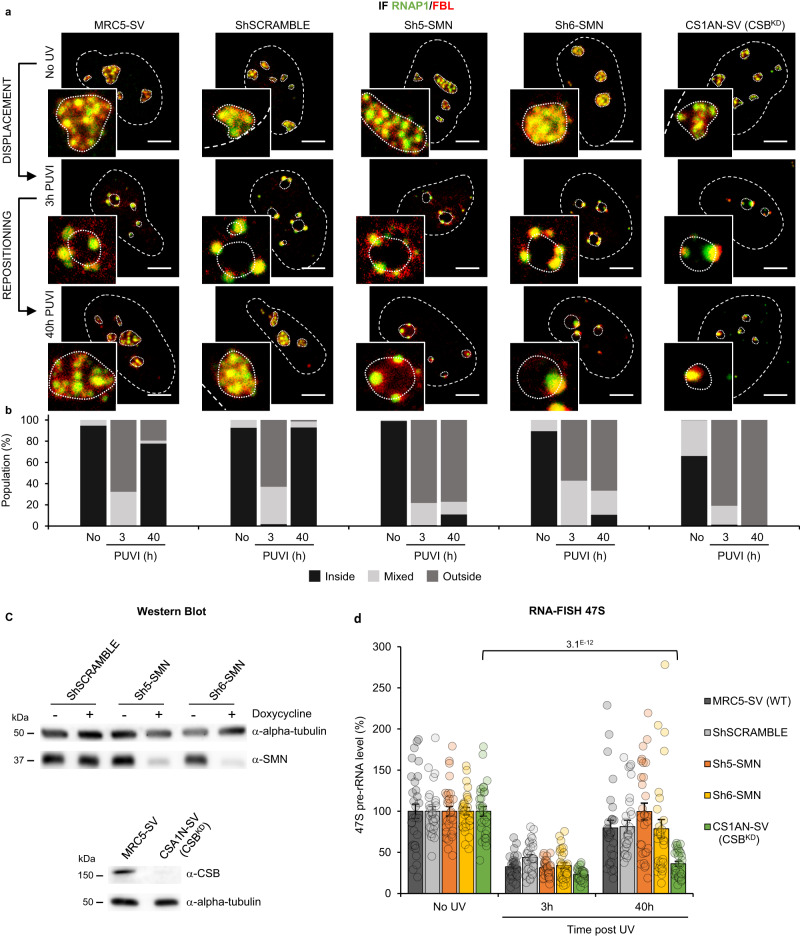
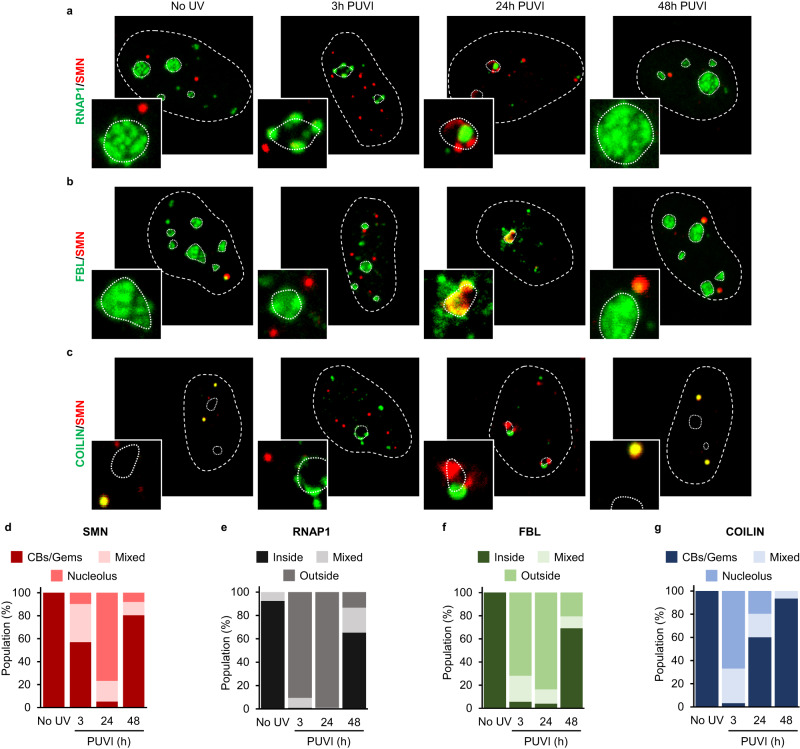
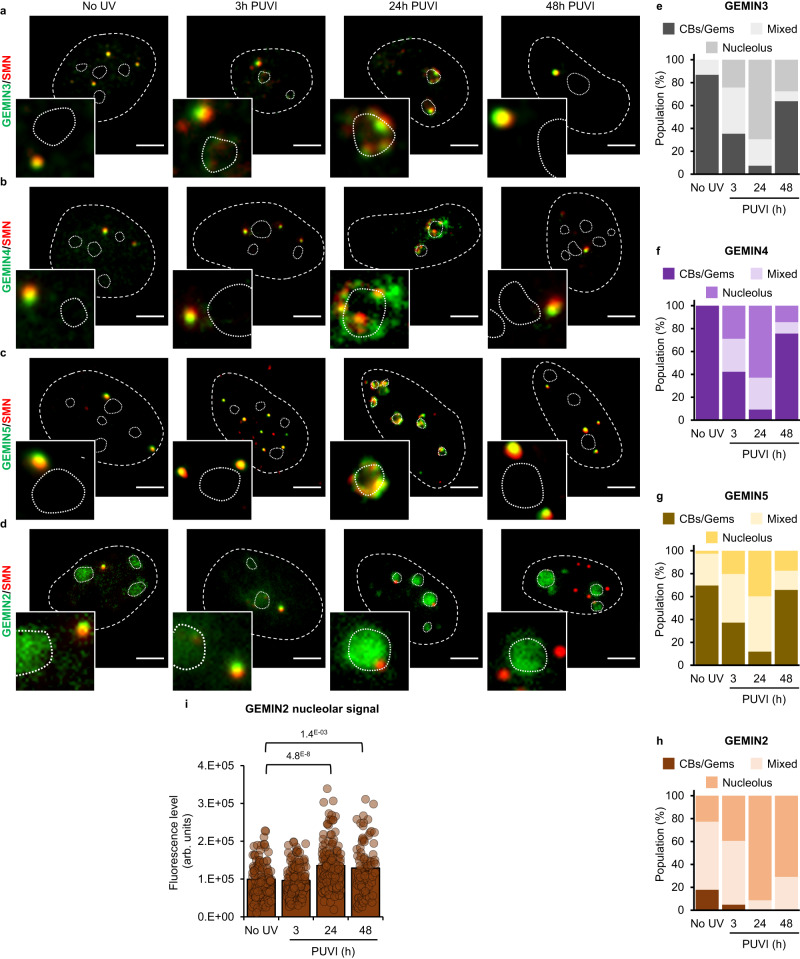
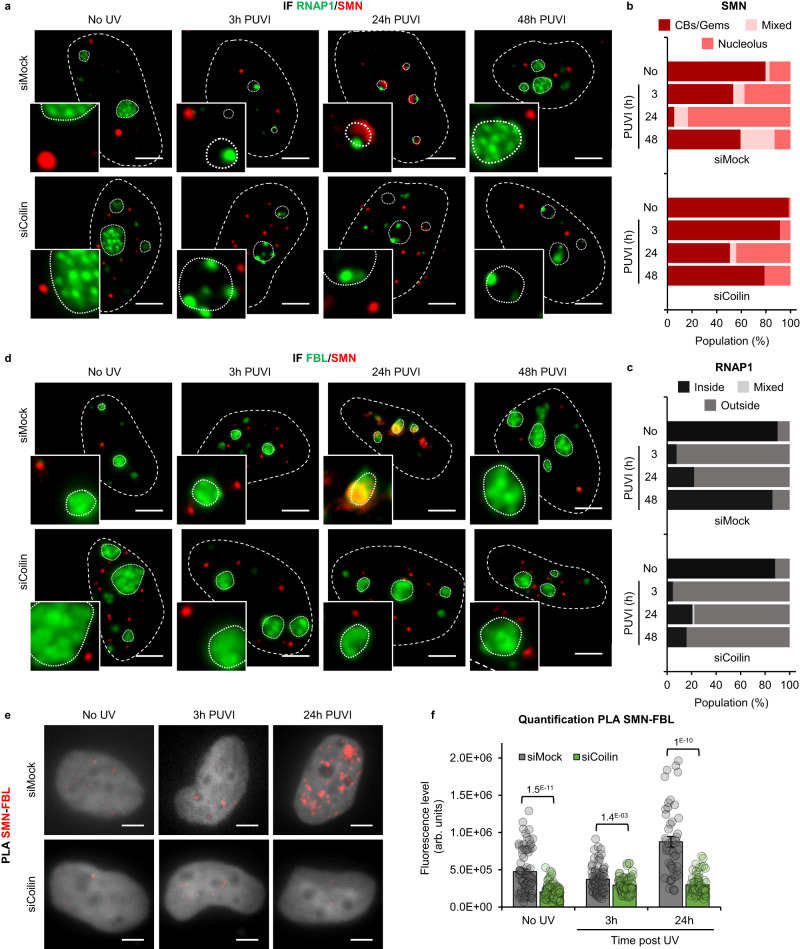
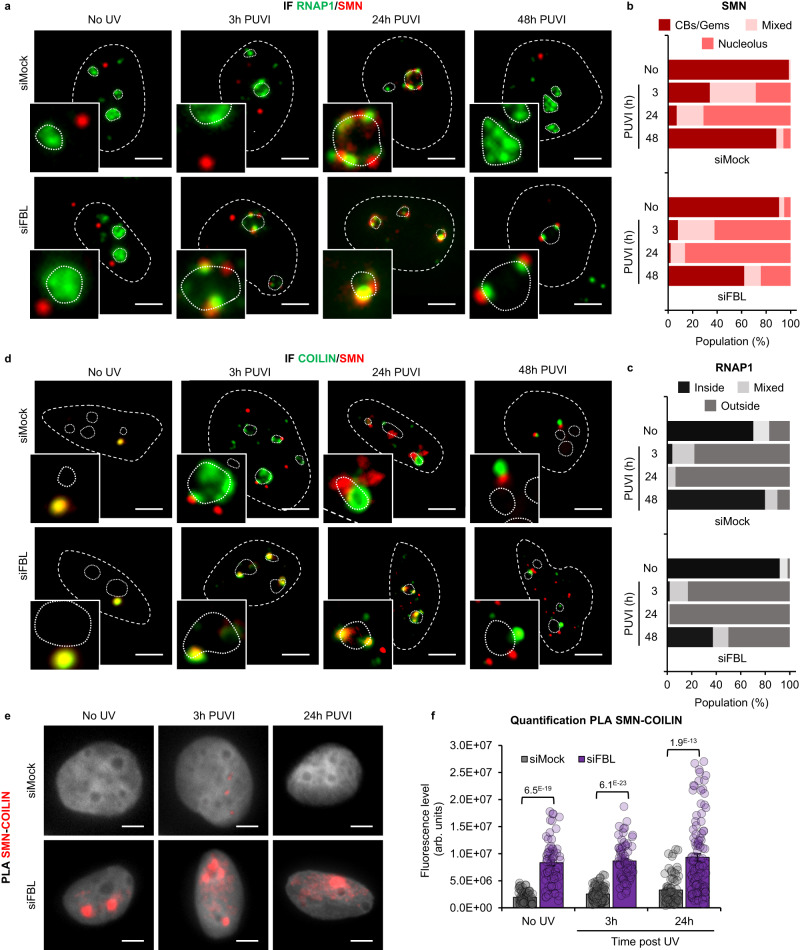
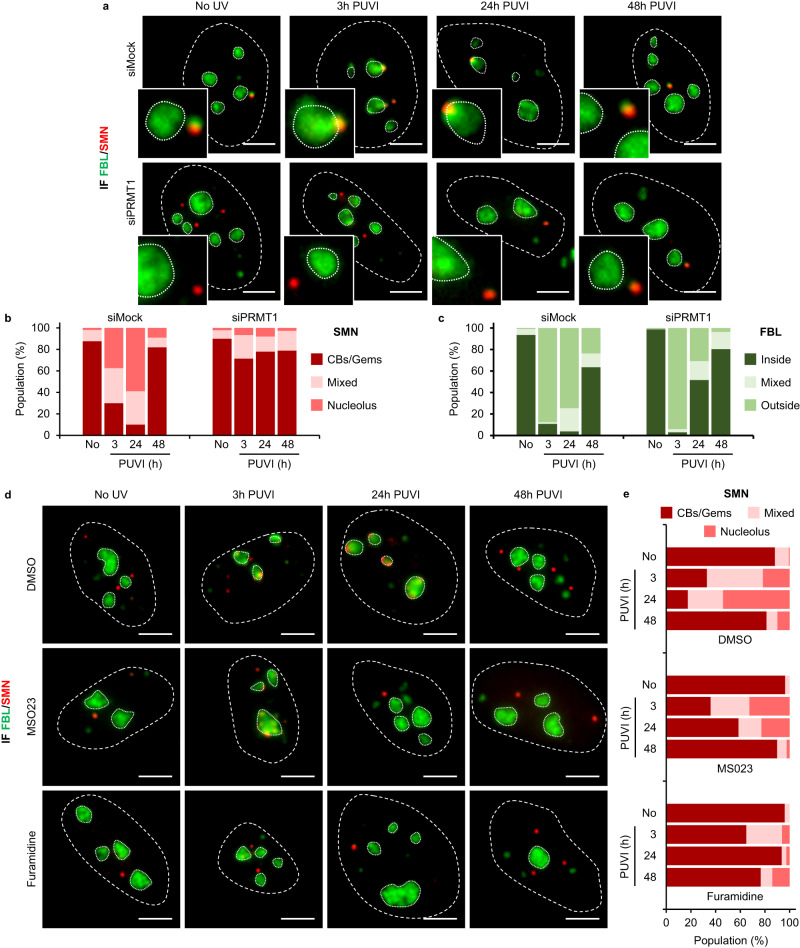
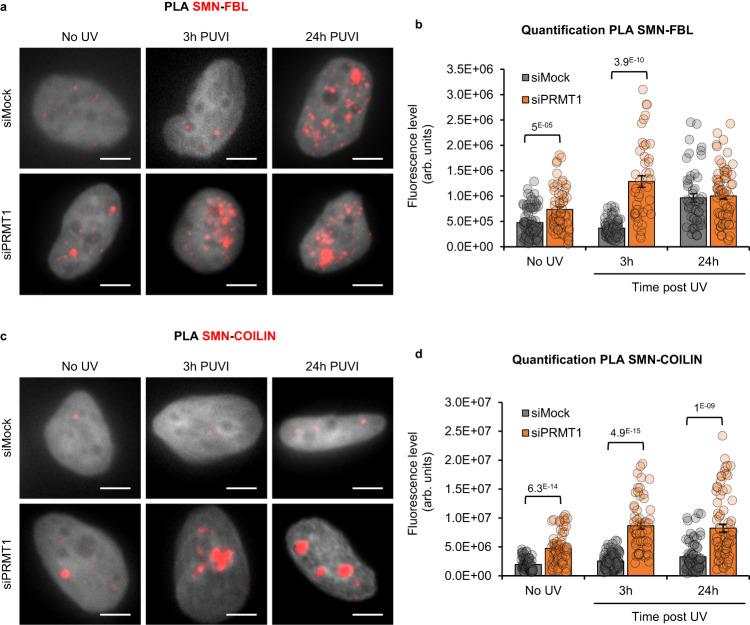
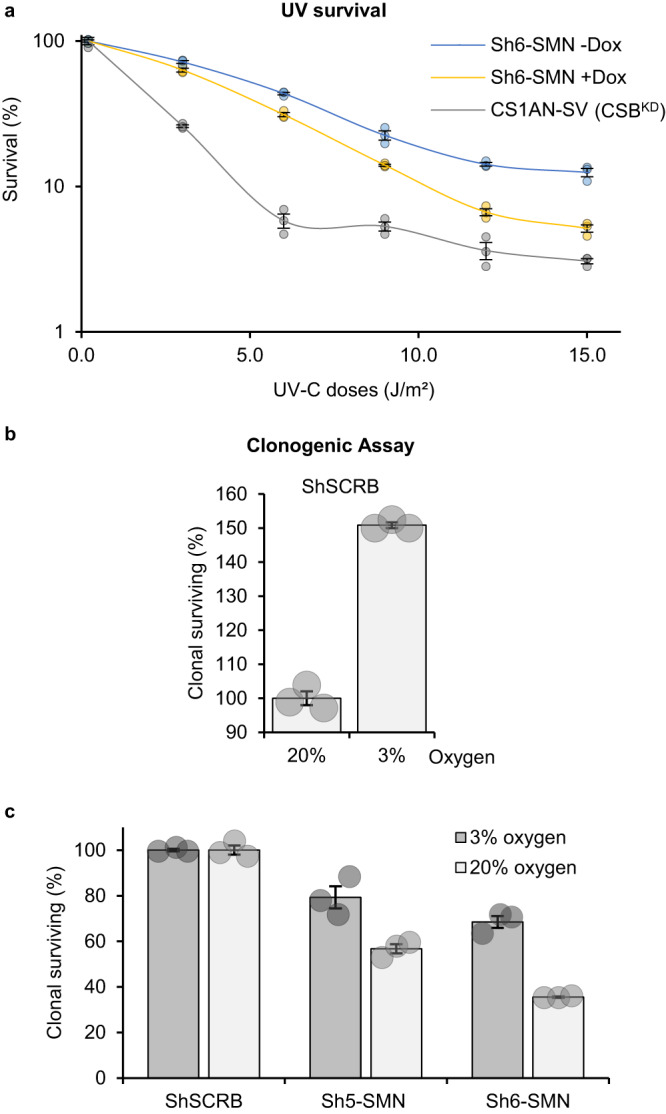
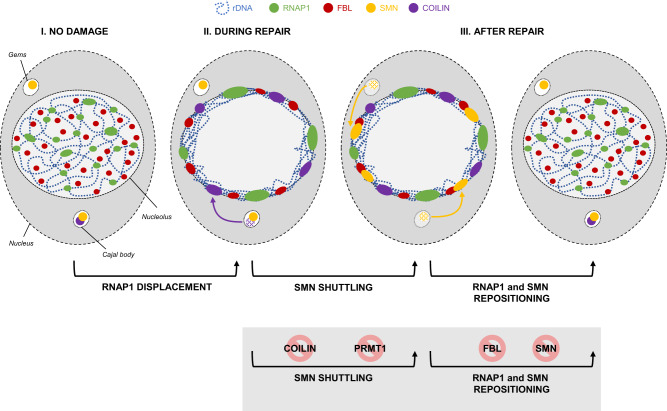
Spinal muscular atrophy is an autosomal recessive neuromuscular disease caused by mutations in the multifunctional protein Survival of Motor Neuron, or SMN. Within the nucleus, SMN localizes to Cajal bodies, which are associated with nucleoli, nuclear organelles dedicated to the first steps of ribosome biogenesis. The highly organized structure of the nucleolus can be dynamically altered by genotoxic agents. RNAP1, Fibrillarin, and nucleolar DNA are exported to the periphery of the nucleolus after genotoxic stress and, once DNA repair is fully completed, the organization of the nucleolus is restored. We find that SMN is required for the restoration of the nucleolar structure after genotoxic stress. During DNA repair, SMN shuttles from the Cajal bodies to the nucleolus. This shuttling is important for nucleolar homeostasis and relies on the presence of Coilin and the activity of PRMT1.


Conflict of interest statement

The authors declare no competing interests.

Figures

Fig. 1
Fig. 1. RNAP1 and FBL localization during DNA repair in SMN deficient transformed fibroblasts.
a Representative confocal microscopy images of immunofluorescence (IF) assay in MRC5 cells showing, after 16 J/m² UV-C irradiation, the localization of RNAP1 (green) and FBL (red) in transformed fibroblasts, at different times Post UV-Irradiation (PUVI). Nuclei and nucleoli are indicated by dashed and dotted lines respectively. Scale bar: 5 µm. b Quantification of cell number for RNAP1 localization (inside the nucleolus, outside the nucleolus or mixed localization) at different times PUVI. At least 50 cells from one representative experiment were analyzed. c Western Blot of SMN and CSB on whole cell extracts of transformed fibroblasts (MRC5-SV cells). Doxycycline treatment induces the expression of the ShRNA against SMN. d Quantification of RNA-FISH assay showing the 47 S pre-rRNA level after UV-C exposure in transformed fibroblasts. Data are represented as mean values +/− SEM. At least 27 cells was quantified from one representative experiment. The p-value correspond to a student’s test with two-tailed distribution and two-sample unequal variance to compare after irradiation with No UV condition. Source data of uncropped gel and graphs are provided as a Source Data file.
Fig. 2
Fig. 2. Localization of SMN and its partners during DNA repair.
a–c Representative microscopy images of immunofluorescence (IF) assay in MRC5 cells showing, after 16 J/m² UV-C irradiation, the localization of SMN (red) and (a) RNAP1, (b) FBL or (c) Coilin (green) at different times Post UV-Irradiation (PUVI). Nuclei and nucleoli are indicated by dashed and dotted lines respectively. Scale bar: 5 µm. d–g Quantification of cells number for localization of (d) SMN, (g) Coilin (in Cajal Bodies [CBs] or Gems, at the periphery of the nucleolus or mixed localization), (e) RNAP1 and (f) FBL (inside the nucleolus, outside the nucleolus or mixed localization) at different times PUVI. For Coilin, RNAP1 and FBL, at least 50 cells from one representative experiment were analyzed. The SMN graph represent the average of three independent experiments, of which at least 50 cells for each were analyzed. Source data of graphs are provided as a Source Data file.
Fig. 3
Fig. 3. Localization of Gemin2, Gemin3, Gemin4 and Gemin5 during DNA repair.
ad Representative microscopy images of immunofluorescence (IF) assay in MRC5 cells showing, after 16 J/m² UV-C irradiation, the localization of SMN (red) and (a) GEMIN3, (b) GEMIN3, (c) GEMIN4 or (d) GEMIN2 (green) at different times Post UV-Irradiation (PUVI). Nuclei and nucleoli are indicated by dashed and dotted lines respectively. Scale bar represents 5 µm. eh Quantification of cells number for localization of (e) GEMIN3, (f) GEMIN4, (g) GEMIN5 or (h) GEMIN2 (in Cajal Bodies [CBs] or Gems, at the periphery of the nucleolus or mixed localization), at different times PUVI. At least 50 cells from one representative experiment were analyzed. i Quantification of fluorescent signal in the nucleolus from the IF against GEMIN2. Data are represented as mean values +/− SEM. At least 90 cells was quantified from one representative experiment. The p-value correspond to a student’s test with two-tailed distribution and two-sample unequal variance to compare after irradiation with No UV condition. Source data of graphs are provided as a Source Data file.
Fig. 4
Fig. 4. SMN shuttling is Coilin-dependent.
a, d Representative microscopy images of immunofluorescence (IF) assay showing the localization of SMN (red) and (a) RNAP1 or (d) FBL (green) at different times Post UV-Irradiation (PUVI) in cells transfected with siMock or siCoilin pool. Nuclei and nucleoli are indicated by dashed and dotted lines respectively. Scale bar: 5 µm. b, c Quantification of cells number for localization of (b) SMN (in Cajal Bodies [CBs] or Gems, at the periphery of the nucleolus or mixed localization) and (c) RNAP1 (inside the nucleolus, outside the nucleolus or mixed localization) at different times PUVI in cells transfected with siMock or siCoilin pool. At least 35 cells from one representative experiment were analyzed. e Representative microscopy images of Proximity Ligation Assay (PLA) in red showing the interaction between SMN and FBL at different times PUVI in cells transfected with siMock or siCoilin pool. Scale bar: 5 µm. DAPI in grey. f Quantification of fluorescent signal in the nucleus against the couple SMN-FBL from PLA experiment in cells transfected with siMock or siCoilin pool after UV-C irradiation. Data are represented as mean values +/− SEM. At least 45 cells was quantified from one representative experiment. The p-value correspond to a student’s test with two-tailed distribution and two-sample unequal variance to compare siCoilin with siMock. Source data of graphs are provided as a Source Data file.
Fig. 5
Fig. 5. The release of SMN from the nucleolus is FBL-dependent.
a, d Representative microscopy images of immunofluorescence (IF) assay showing the localization of SMN (red) and (a) RNAP1 or (d) COILIN (green) at different times Post UV-Irradiation (PUVI) in cells transfected with siMock or siFBL pool. Nuclei and nucleoli are indicated by dashed and dotted lines respectively. Scale bar: 5 µm. b, c Quantification of cells number for localization of (b) SMN (in Cajal Bodies [CBs] or Gems, at the periphery of the nucleolus or mixed localization) and (c) RNAP1 (inside the nucleolus, outside the nucleolus or mixed localization) at different times PUVI in cells transfected with siMock or siFBL pool. At least 80 cells from one representative experiment were analyzed. e Representative microscopy images of Proximity Ligation Assay (PLA) in red showing the interaction between SMN and COILIN at different times PUVI in cells transfected with siMock or siFBL pool. Scale bar: 5 µm. DAPI in grey. f Quantification of fluorescent signal in the nucleus against the couple SMN-COILIN from PLA experiment in cells transfected with siMock or siFBL pool after UV-C irradiation. Data are represented as mean values +/− SEM. At least 65 cells was quantified from one representative experiment. The p-value correspond to a student’s test with two-tailed distribution and two-sample unequal variance to compare siFBL with siMock. Source data of graphs are provided as a Source Data file.
Fig. 6
Fig. 6. PRMT1 activity mediates the nucleolar shuttling of SMN.
a Representative microscopy images of immunofluorescence (IF) assay showing the localization of SMN (red) and FBL (green) at different times Post UV-Irradiation (PUVI) in cells transfected with siMock or siPRMT1 pool. Nuclei and nucleoli are indicated by dashed and dotted lines respectively. Scale bar: 5 µm. b, c Quantification of cells number for localization of (b) SMN (in Cajal Bodies [CBs] or Gems, at the periphery of the nucleolus or mixed localization) and (c) FBL (inside the nucleolus, outside the nucleolus or mixed localization) at different times PUVI in cells transfected with siMock or siPRMT1 pool. At least 145 cells from one representative experiment were analyzed. d Representative microscopy images of IF assay showing the localization of SMN (red) and FBL (green) in MRC5 cells treated with DMSO, MS023 or Furamidine followed by 16 J/m² UV-C irradiation. Nuclei and nucleoli are indicated by dashed and dotted lines respectively. Scale bar: 5 µm. e Quantification of cells number for localization of SMN (in Cajal Bodies [CBs] or Gems, at the periphery of the nucleolus or mixed localization) at different times PUVI in cells treated with DMSO, MS023 or Furamidine. At least 60 cells from one representative experiment were analyzed. Source data of graphs are provided as a Source Data file.
Fig. 7
Fig. 7. PRMT1 remodels the interaction of SMN with FBL and COILIN.
a, c Representative microscopy images of Proximity Ligation Assay (PLA) in red showing the interaction (a) between SMN and FBL or (c) between SMN and COILIN at different times Post UV-Irradiation (PUVI) in cells transfected with siMock or siPRMT1 pool. Scale bar: 5 µm. DAPI in grey. b, d Quantification of fluorescent signal in the nucleus against the couple (b) SMN-FBL or (d) SMN-COILIN from PLA experiment in cells transfected with siMock or siPRMT1 pool after UV-C irradiation. Data are represented as mean values +/− SEM. At least 45 cells was quantified from one representative experiment. The p-value correspond to a student’s test with two-tailed distribution and two-sample unequal variance to compare siFBL with siMock. Source data of graphs are provided as a Source Data file.
Fig. 8
Fig. 8. SMN-deficient cells are sensitive to DNA damage.
a Survival curve was determined by the colony-forming ability to UV-C of cells expressing (+Dox) or not (−Dox) Sh6-SMN. Counting of clones was normalized to non-irradiated condition. b, c Clonogenic assay of cells cultured with different quantities of oxygen (3% or 20%) in the presence (ShSCRB = ShSCRAMBLE) or absence of SMN (Sh5-SMN and Sh6-SMN). Counting of clones was normalized (a) to 20% oxygen or (b) to ShSCRB. Data are represented as mean values of the triplicate +/− SEM. Source data of graphs are provided as a Source Data file.
Fig. 9
Fig. 9. SMN shuttling during DNA damage/repair dependent nucleolar reorganization.
After genotoxic stress, RNA Polymerase 1 (RNAP1 in green), Fibrillarin (FBL in red) and nucleolar DNA (rDNA in blue) are exported to the periphery of the nucleolus. During DNA repair, Coilin (in purple) and subsequently SMN (in yellow) shuttle from Cajal bodies to the nucleolus. Once DNA repair is fully completed, the organization of the nucleolus is restored. The shuttling of SMN relies on the presence of Coilin and the activity of PRMT1. The restoration of the nucleolar structure is dependent on FBL and SMN.

References

    1. Dubois, M.-L. & Boisvert, F.-M. The Nucleolus: Structure and Function. in The Functional Nucleus (eds. Bazett-Jones, D. P. & Dellaire, G.) 29–49 (Springer International Publishing, 2016). 10.1007/978-3-319-38882-3_2.
    1. Hernandez-Verdun D. Assembly and disassembly of the nucleolus during the cell cycle. Nucl Austin Tex. 2011;2:189–194. - PMC - PubMed
    1. Boulon S, Westman BJ, Hutten S, Boisvert F-M, Lamond AI. The nucleolus under stress. Mol. Cell. 2010;40:216–227. doi: 10.1016/j.molcel.2010.09.024. - DOI - PMC - PubMed
    1. Louvet E, Junéra HR, Le Panse S, Hernandez-Verdun D. Dynamics and compartmentation of the nucleolar processing machinery. Exp. Cell Res. 2005;304:457–470. doi: 10.1016/j.yexcr.2004.11.018. - DOI - PubMed
    1. Giglia-Mari G, Zotter A, Vermeulen W. DNA damage response. Cold Spring Harb. Perspect. Biol. 2011;3:a000745. doi: 10.1101/cshperspect.a000745. - DOI - PMC - PubMed

Publication types

MeSH terms