. 2023 Nov 15;14(1):7291.
doi: 10.1038/s41467-023-43044-1.

PAX3-FOXO1 dictates myogenic reprogramming and rhabdomyosarcoma identity in endothelial progenitors

Affiliations

PAX3-FOXO1 dictates myogenic reprogramming and rhabdomyosarcoma identity in endothelial progenitors

Madeline B Searcy et al. Nat Commun. .

Abstract

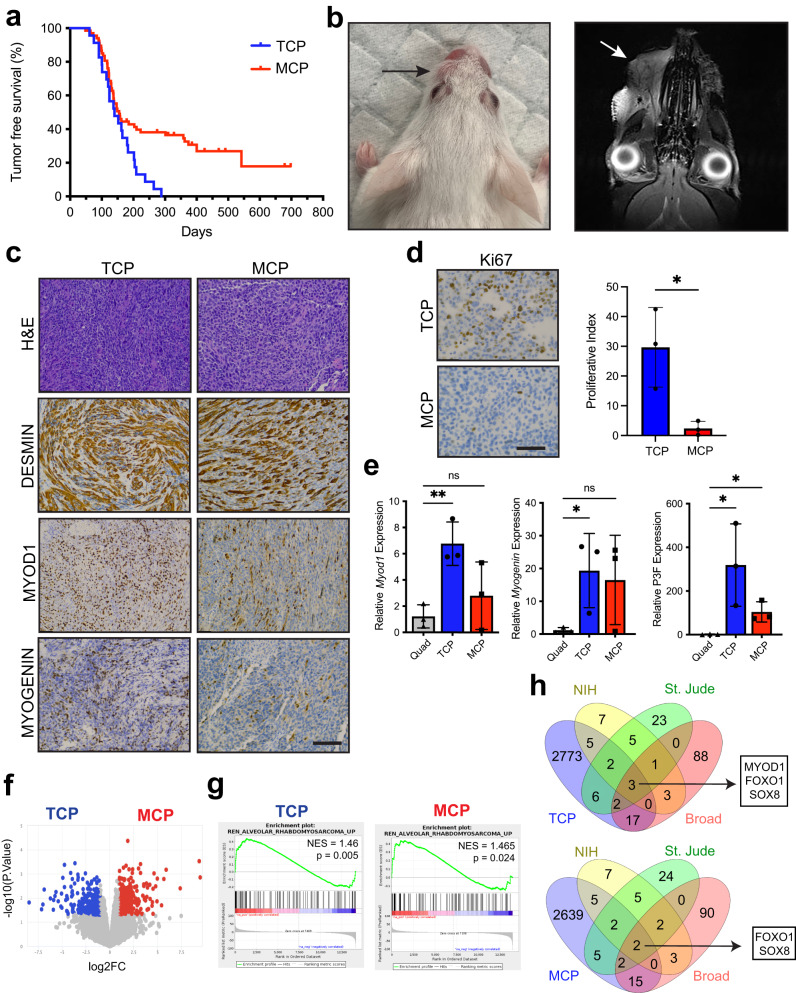
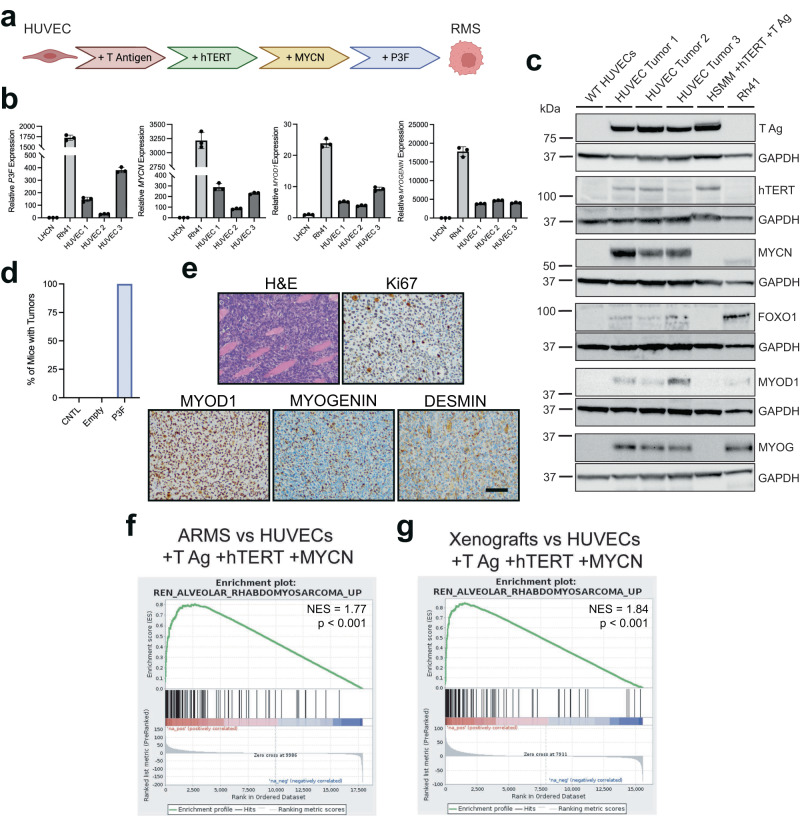
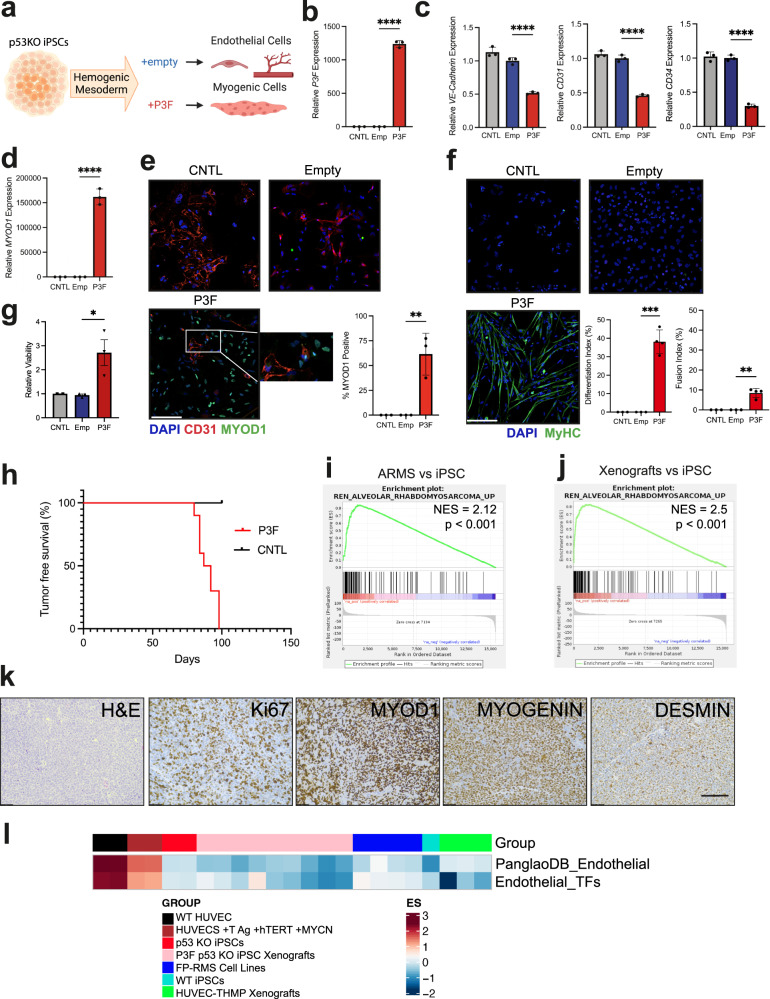
Fusion-positive rhabdomyosarcoma (FP-RMS) driven by the expression of the PAX3-FOXO1 (P3F) fusion oncoprotein is an aggressive subtype of pediatric rhabdomyosarcoma. FP-RMS histologically resembles developing muscle yet occurs throughout the body in areas devoid of skeletal muscle highlighting that FP-RMS is not derived from an exclusively myogenic cell of origin. Here we demonstrate that P3F reprograms mouse and human endothelial progenitors to FP-RMS. We show that P3F expression in aP2-Cre expressing cells reprograms endothelial progenitors to functional myogenic stem cells capable of regenerating injured muscle fibers. Further, we describe a FP-RMS mouse model driven by P3F expression and Cdkn2a loss in endothelial cells. Additionally, we show that P3F expression in TP53-null human iPSCs blocks endothelial-directed differentiation and guides cells to become myogenic cells that form FP-RMS tumors in immunocompromised mice. Together these findings demonstrate that FP-RMS can originate from aberrant development of non-myogenic cells driven by P3F.


Conflict of interest statement

MEH has served on advisory board for Servier. The remaining authors declare no competing interests.

Figures

Fig. 1
Fig. 1. P3F reprograms endothelial cells to functional muscle stem cells.
a Representative immunofluorescence (IF) from aP2-Cre;R26-tdTom sternocleidomastoid (SCM) and gastrocnemius (gastroc) following cardiotoxin (CTX) injury. Laminin (green), tdTomato(red), DAPI nuclear stain (blue) (n = 3). Scale bar = 100 μm. b Representative IF of SCM and quadricep femoralis hindlimb (HL). PAX7 (white), laminin (green), tdTomato (red), DAPI (blue). This experiment was repeated 3 times with similar results. Scale bar = 10 µm. c Representative IF of myogenic differentiation from ACP SCM and HL. Myosin heavy chain (MyHC, green), tdTomato (red), DAPI (blue)(n = 3, 100+ nuclei counted/replicate) Scale bar = 50 μm. Flow cytometry analysis of muscle stem cells by (MAC1/CD45/TER119) and SCA1 negative, β1-Integrin and CXCR4-positive, and Tom+ cells from d Pax7-CreERT2;R26-tdTom muscle - (n = 3 biological replicates) (P = 0.0002) and e Flow cytometry from ACP SCM and HL (n = 3 biological replicates) (P = 0.0314). f Representative IF from CTX injured Pax7-CreERT2;R26-tdTom gastroc (n = 2), and ACP SCM (n = 2) and gastrc (n = 2). Laminin (green), tdTomato (red), DAPI (blue). Scale bar = 100 μm. P values determined by Student’s t-test (unpaired, two-tailed); *P < 0.05 and ***P  <  0.001. Data represented as mean+/- SEM. Source data are provided as a Source Data file.
Fig. 2
Fig. 2. FP-RMS in Tek-Cre;Cdkn2aFlox/Flox;PaxP3Fm/P3Fm mice.
a Kaplan-Meier tumor-free survival. TCP (blue, n = 24) and MCP (red, n = 42). b Gross photo (left) and magnetic resonance imaging (right) of TCP tumor. c Representative histology of TCP (left) and MCP (right) tumors stained for H&E, DESMIN, MYOD1, and MYOGENIN. N = 15 TCP and 29 MCP tumors. Scale bar = 100μm. d Representative Ki67 IHC and quantification in TCP (n = 3) and MCP (n = 3) tumors (three random fields of view per genotype) (P = 0.0256). Scale bar = 50 μm. e Gene expression by real-time PCR of Myod1 (Quad–TCP, P = 0.0068), Myogenin (Quad – TCP, P = 0.0499) and Pax3-Foxo1 (Quad–TCP, P = 0.0433) (Quad–MCP, P = 0.0187) in TCP (n = 3) and MCP (n = 3) tumors and quad skeletal muscle (n = 3). f Volcano plot showing differentially expressed genes with logFC greater than 1 and false discovery rate (FDR) less than 5% in TCP (blue) and MCP (red). g Enrichment plot of FP-RMS gene signatures (REN_ALVEOLAR_RHABDOMYOSARCOMA_UP) for TCP and MCP tumors compared to gastrocnemius. h Tulip plot overlaying genes two-fold increased in TCP and MCP tumors compared to gastrocnemius (P < 0.05), RMS genes identified by the NIH, SJCRH, and the pediatric dependency map (Broad). P values determined by Student’s t-test (unpaired, two-tailed); *P < 0.05 and **P < 0.01. Data represented as mean+/- SEM. Source data are provided as a Source Data file.
Fig. 3
Fig. 3. FP-RMS tumors from TCP and MCP mice are indistinguishable on a single-cell level.
a UMAP and cluster analysis of single-cell transcriptional profiles of TCP (n = 2), MCP (n = 3), Tom+ cells from Tek-Cre;Tomato SCM skeletal muscle (n = 1), and mouse muscle datasets (n = 2 per group). Tumor cells and myogenic cells within dashed line. b UMAP highlighted by sample (MuSCs = tissue-resident skeletal muscle stem cells, Primary MBs = committed primary myoblasts). c scVelo analysis showing RNA velocity dynamical modeling of cellular dynamics. d Top ten terms by CellMarker Augmented 2021 from genes defining cluster 8. e Violin plot of top ten expressed genes in clusters 3, 8, and 0. f UMAP and re-clustered analysis of single-cell transcriptional profiles of tumor and muscle population. g Violin plots showing Pax3, Foxo1, Myod1 and Myogenin expression across clusters from f (n = 32,198). The median is defined as the 50% quantile. The upper whisker represents the largest observation ≤ to the upper hinge (75% quantile) +1.5*IQR, where the IQR is the interquartile range, or the distance between the first and third quartiles. The lower whisker represents the smallest observation ≥ to the lower hinge (25% quantile) −1.5*IQR. h Proportions of clusters present in TCP and MCP samples. P values determined by Student’s t-test (unpaired, two-tailed); *P < 0.05.
Fig. 4
Fig. 4. TCP and MCP mouse FP-RMS tumors are comprised of cell states identified in human FP-RMS tumors.
a scRNAseq gene expression of representative genes from the cell state signature gene modules identified in human RMS PDXs (Proliferation, Muscle, Hypoxia, Mesenchymal-like and Apoptosis) derived from Wei et al. (Fig. 1C) in mouse MCP and TCP tumors, primary myoblasts, muscle stem cells, total muscle, and Tom+ cells from Tek-Cre;R26-tdTomato muscle. Heatmap illustrates single cells from mouse samples (x-axis) and the normalized gene expression in cell state signature gene modules (y-axis). UCell signature score is calculated for every module and visualized in the color bar above the heatmap. b Feature plot UMAPs illustrating expression of conserved cell state gene modules derived from Wei et al. across integrated scRNAseq data from mouse MCP and TCP tumors, primary myoblasts, muscle stem cells, total muscle, and Tom+ cells from Tek-Cre;R26-tdTomato muscle, with cluster locations labeled.
Fig. 5
Fig. 5. FP-RMS tumors from different cells of origin have similar chromatin landscapes.
a Scatterplot of TCP (n = 2) and MCP (n = 2) HiC reads connecting pairs of bins at 1 Mb (top) and 10 kb (bottom) resolution. Representative scatterplot from TCP 79 vs MCP 76 shown. Read counts between bin-pairs where at least one bin overlaps a chromosomal location of a selected gene are highlighted. Bin-pairs within the red dotted line involve bins located on the X chromosome and bin-pairs located within the blue solid line involve bins located on the Y chromosome. b Heatmap of HiC connectivity read counts at the Pecam1 and Myod1 loci in embryonic stem cells (ES cells), TCP, and MCP. Representative data from TCP 79 and MCP 43 shown. c Scatterplot comparison of differences in H3K27ac read coverage at H3K27ac peaks. Collapsed peaks showing biased coverage (TPM absolute linear average fold-change > 2) in TCP (n = 3) in blue and MCP (n = 4) in pink (P = 4.62 × 10⁻¹⁰, two-tailed Pearson’s r correlation). d Volcano plot comparing coverage at collapsed peaks in TCP (blue) and MCP (pink). Points colored blue or pink if statistically significantly differentially covered (DEseq2 P < 0.05 and absolute value log2 fold-change > 1; DEseq2 uses a Wald test and internal multiple testing amelioration). Location of RMS genes in dark pink and purple for TCP and MCP, respectively. e Scatterplot comparison of differences in H3K27ac read coverage at super-enhancers. Collapsed super-enhancers significantly selectively covered (TPM absolute log2 fold-change >2) in TCP in blue and MCP in pink (P = 2.2 × 10⁻¹⁶, two-tailed Pearson’s r correlation). f Volcano plot comparing coverage at collapsed super-enhancers in TCP (blue) and MCP (pink). Points colored blue or pink if statistically significantly differentially covered (DEseq2 P < 0.05 and absolute value log2 fold-change > 1; DEseq2 uses a Wald test and internal multiple testing amelioration). Location of super-enhancers associated with RMS genes in dark pink and purple for TCP and MCP, respectively. g Heatmap displaying statistical enrichment of endothelial TF motif hits in H3K27ac CUT&RUN data. Myod1 (not an endothelial gene) is included as a positive control for H3K27ac enrichment in bold.
Fig. 6
Fig. 6. Transdifferentiation of human umbilical vein cells to FP-RMS.
a Schematic of HUVEC transduction generating HUVEC-THMP cells. Created with BioRender.com. b Gene expression by real-time PCR of PAX3-FOXO1, MYOD1, and MYOGENIN in three HUVEC-THMP tumors, human immortalized myoblasts (LHCNs), and human FP-RMS cell line (Rh41) (n = 3 technical replicates for each sample shown). c Immunoblots of T- Ag, hTERT, MYCN, FOXO1, MYOD1, MYOGENIN, and corresponding GAPDH on WT HUVECs, three HUVEC-THMP tumors, and Rh41 cells. GAPDH loading controls were ran on the same blot as the corresponding antibody above it. Uncropped and unprocessed scans of immunoblots are included in the Source Data file. d Percent of SCID beige mice with tumors after 125 days post injection with four million untransduced HUVEC cells (CNTL), or HUVECs expressing T-Ag, hTERT and MYCN with lenti-Empty or lenti-P3F. e Representative histology of HUVEC-THMP tumors staining for H&E, MYOD1, MYOGENIN, and DESMIN. N = three separate tumors. Scale bar = 100 μm. f Enrichment plot of FP-RMS gene signatures (REN_ALVEOLAR_RHABDOMYOSARCOMA_UP) for PCGP FP-RMS tumors compared to HUVECs expressing T-Ag, hTERT and MYCN. g Enrichment plot of FP-RMS gene signatures (REN_ALVEOLAR_RHABDOMYOSARCOMA_UP) for xenograft HUVEC-THMP tumors expressing T-Ag, hTERT and MYCN with lenti-P3F compared to HUVECs expressing T-Ag, hTERT and MYCN. P values determined by Student’s t-test (unpaired, two-tailed); *P < 0.05. Data represented as mean+/- SEM. Source data are provided as a Source Data file.
Fig. 7
Fig. 7. P3F blocks endothelial differentiation and reprograms human iPSCs into FP-RMS.
a Schematic of iPSC experiment. Created with BioRender.com. (b-d) Representative technical replicates from one of three experimental replicates after 14-day endothelial differentiation protocol. Additional experimental replicate data provided in Source Data file. CNTL cells are untransduced p53KO iPSCs. Gene expression by real-time PCR for (b) PAX3-FOXO1, (n = 3, P < 0.0001) c VE-Cadherin (KDR) (n = 3, P < 0.0001), CD31 (PECAM1) (n = 3, P < 0.0001), CD34 (n = 3, P < 0.0001). d Gene expression by real-time PCR for MYOD1 (n = 3, P < 0.0001). e Representative IF for MYOD1 (green), CD31 (red), DAPI (blue) (n = 3, P = 0.0073). Scale bar = 50 μm. f Representative IF for MyHC (green). Differentiation index = percent of MyHC+/DAPI+ cells (n = 3 for CNTL and Emp, n = 4 for P3F, P = 0.0002), and fusion index = percent of MyHC+/DAPI+ cells with two or more nuclei (P = 0.0016). DAPI (blue). Scale bar = 50 μm. g Cell viability by Cell Titer Glow assay comparing CNTL, empty, and P3F cells after 48 h (CNTL n = 2, Emp and P3F n = 3, P = 0.0315). h Kaplan-Meier tumor free survival curve for SCID beige mice injected with 4 million cells. (CNTL = 3, P3F = 10). Enrichment plot of FP-RMS gene signatures (REN_ALVEOLAR_RHABDOMYOSARCOMA_UP) for (i) PCGP ARMS, and (j) iPSC tumors, compared to BJFF.6 p53KO iPSCs. k Representative histology of iPSC tumors stained with H&E, DESMIN, Ki67, MYOD1 and MYOGENIN. N = 10. Scale bar = 100 μm. P values determined by Student’s t-test (unpaired, two-tailed); **P < 0.01, ***P < 0.001, ****P < 0.0001. Data represented as mean+/- SEM. l heatmap comparing the gene expression of endothelial cells (WT HUVECs and HUVECs expressing T Ag, hTERT and MYCN), p53KO iPSCs, transformed P3F expressing p53KO iPSC derived xenografts (P3F p53 KO iPSC Xenografts), FP-RMS cell lines (RH28, RH18, RH30_1, RH30_2), WT BJFF.6 iPSCs (WT iPSCs), and HUVEC-THMP derived xenograft tumors. Single sample gene set enrichment analysis (ssGSEA) was used to score an endothelial cell transcription factor list generated by comparing the mutually expressed top 50 genes identified by Kalucka et al. 2020 and the PanglaoDB_Endothelial gene list downloaded from PanglaoDB. Source data are provided as a Source Data file.
Fig. 8
Fig. 8. P3F transforms p53KO iPSCs by promoting epigenetic modifications.
Analysis from one experimental replicate after 14-day endothelial differentiation protocol. ac Groupscaled CUT&RUN (C&R) tracks depicting genomic coverage of H3K27ac-marks and FOXO1 reads with matched RNAseq tracks at Day 0 in untransduced p53KO iPSCs (grey), Day 15 in untransduced endothelial differentiated p53KO iPSCs (blue), and Day 15 in transformed P3F expressing p53KO iPSCs (red). Super-enhancers called by ROSE are shown for (a) ERG, (b) MYOD1, (c) MYF5, and MYF6 loci.

References

    1. Skapek SX, et al. Rhabdomyosarcoma. Nat. Rev. Dis. Prim. 2019;5:1. doi: 10.1038/s41572-018-0051-2. - DOI - PMC - PubMed
    1. Kashi VP, Hatley ME, Galindo RL. Probing for a deeper understanding of rhabdomyosarcoma: insights from complementary model systems. Nat. Rev. Cancer. 2015;15:426–439. doi: 10.1038/nrc3961. - DOI - PMC - PubMed
    1. Barr FG, et al. Rearrangement of the PAX3 paired box gene in the paediatric solid tumour alveolar rhabdomyosarcoma. Nat. Genet. 1993;3:113–117. doi: 10.1038/ng0293-113. - DOI - PubMed
    1. Shapiro DN, Sublett JE, Li B, Downing JR, Naeve CW. Fusion of PAX3 to a member of the forkhead family of transcription factors in human alveolar rhabdomyosarcoma. Cancer Res. 1993;53:5108–5112. - PubMed
    1. Galili N, et al. Fusion of a fork head domain gene to PAX3 in the solid tumour alveolar rhabdomyosarcoma. Nat. Genet. 1993;5:230–235. doi: 10.1038/ng1193-230. - DOI - PubMed

Publication types

MeSH terms