. 2023 Nov;623(7988):792-802.
doi: 10.1038/s41586-023-06725-x. Epub 2023 Nov 15.

CD201+ fascia progenitors choreograph injury repair

Affiliations

CD201+ fascia progenitors choreograph injury repair

Donovan Correa-Gallegos et al. Nature. 2023 Nov.

Erratum in

  • Author Correction: CD201+ fascia progenitors choreograph injury repair.
    Correa-Gallegos D, Ye H, Dasgupta B, Sardogan A, Kadri S, Kandi R, Dai R, Lin Y, Kopplin R, Shenai DS, Wannemacher J, Ichijo R, Jiang D, Strunz M, Ansari M, Angelidis I, Schiller HB, Volz T, Machens HG, Rinkevich Y. Correa-Gallegos D, et al. Nature. 2024 Jan;625(7993):E4. doi: 10.1038/s41586-023-06928-2. Nature. 2024. PMID: 38057669 Free PMC article. No abstract available.

Abstract

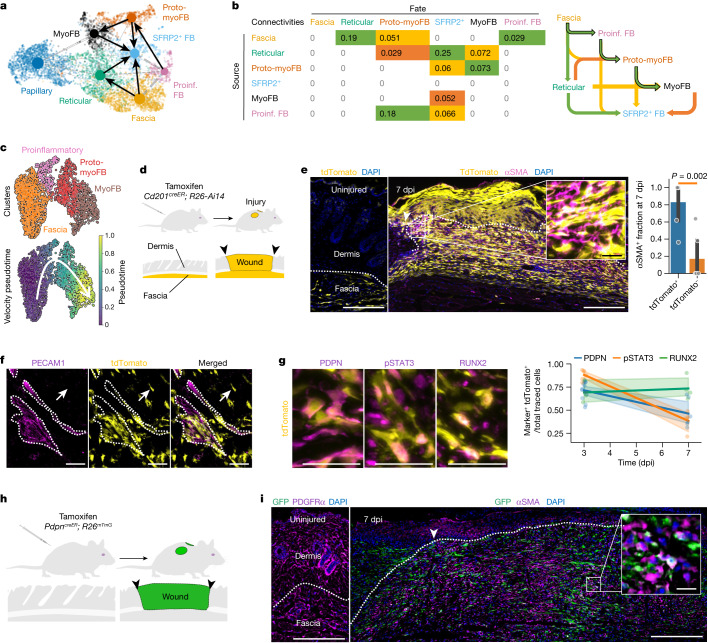
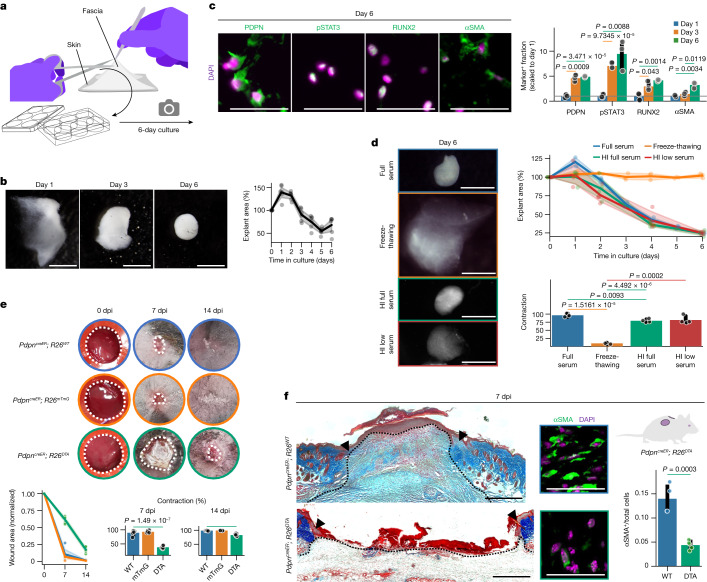
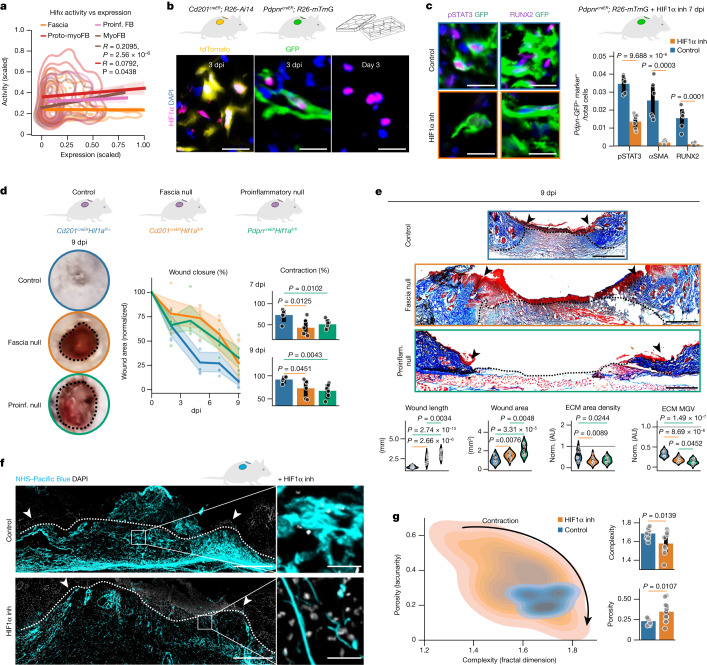
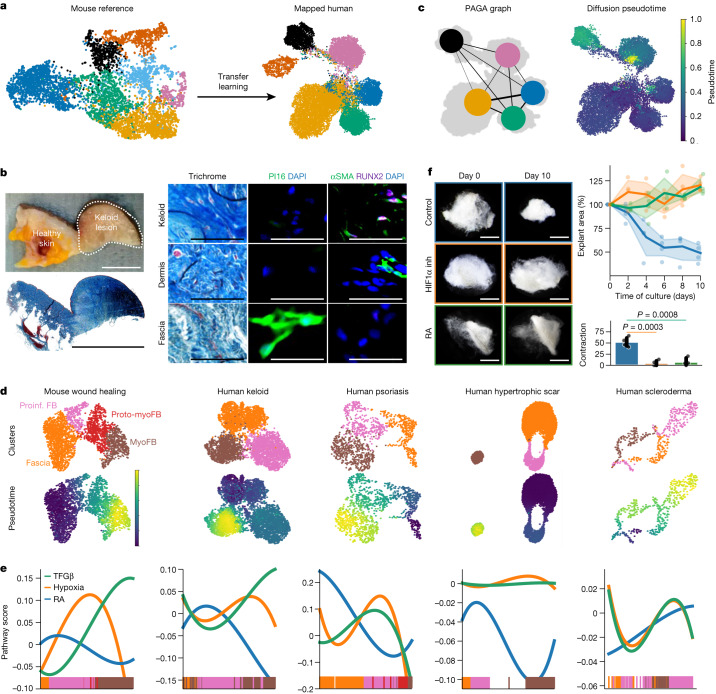
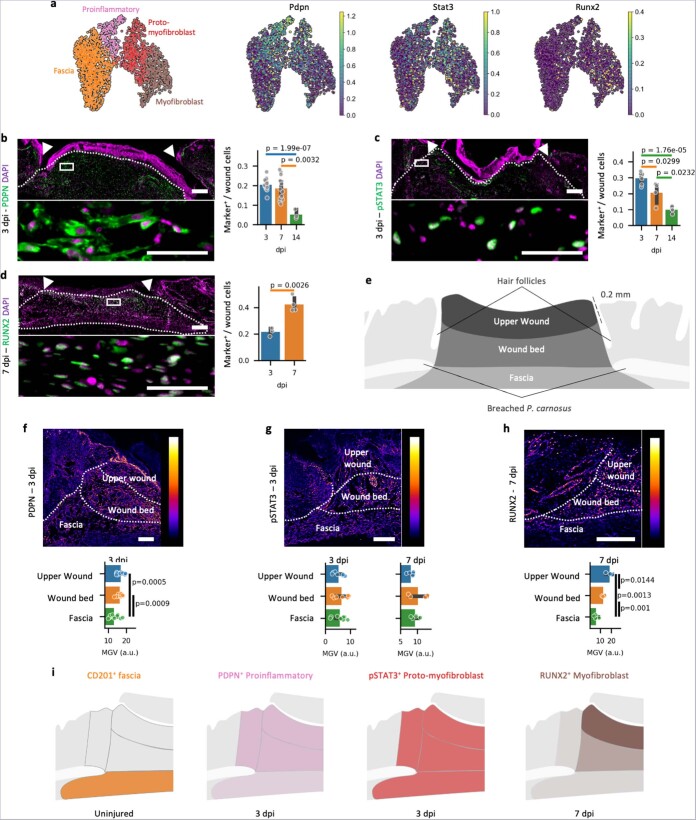
Optimal tissue recovery and organismal survival are achieved by spatiotemporal tuning of tissue inflammation, contraction and scar formation1. Here we identify a multipotent fibroblast progenitor marked by CD201 expression in the fascia, the deepest connective tissue layer of the skin. Using skin injury models in mice, single-cell transcriptomics and genetic lineage tracing, ablation and gene deletion models, we demonstrate that CD201+ progenitors control the pace of wound healing by generating multiple specialized cell types, from proinflammatory fibroblasts to myofibroblasts, in a spatiotemporally tuned sequence. We identified retinoic acid and hypoxia signalling as the entry checkpoints into proinflammatory and myofibroblast states. Modulating CD201+ progenitor differentiation impaired the spatiotemporal appearances of fibroblasts and chronically delayed wound healing. The discovery of proinflammatory and myofibroblast progenitors and their differentiation pathways provide a new roadmap to understand and clinically treat impaired wound healing.


Conflict of interest statement

The authors declare no competing interests.

Figures

Fig. 1
Fig. 1. CD201+ fascia fibroblasts differentiate into specialized states during wound healing.
a, Uniform manifold approximation and projection (UMAP) analysis of all fibroblast clusters embedded with PAGA connectivities for trajectory inference. FB, fibroblast; MyoFB, myofibroblast; proinf., proinflammatory. b, Left, PAGA connectivity values with potential sources (rows) and fates (column) colour-coded as most (green), intermediate (yellow) and least probable (orange). Right, schematic of the potential trajectories highlighting the fascia-to-myofibroblast trajectory. c, UMAP analyses of fibroblasts from the fascia-to-myofibroblast trajectory, colour-coded for individual clusters (top) and velocity pseudotime score (bottom). d, Genetic lineage system to trace the fate of CD201+ fascia fibroblasts during wound healing. e, Representative histology of uninjured (left) Cd201creERR26Ai14 and 7 dpi wound (middle) immunolabelled for αSMA. Right, the contribution of CD201+ fibroblasts to the myofibroblast pool was determined for 6 wounds from 3 mice. Two-tailed Student’s t-tests. The dotted line delimits the fascia or wound region. Arrowheads indicate the original injury site. The inset shows an expanded view of the outlined region. f, Representative whole-mount immunostaining for the endothelial marker PECAM1 in uninjured Cd201creERR26Ai1 fascia. Arrows indicate labelled cells dispersed away from the adventitial space. g, Representative high-magnification images showing the expression of PDPN, pSTAT3 or RUNX2 in traced cells (left) and quantification at 3 and 7 dpi (right). Values obtained from at least three biological replicates. h, Genetic lineage system to trace the fate of proinflammatory fibroblast. i, Representative histology of uninjured skin immunolabelled for PDGFRα (left) and a 7-dpi wound (right) of PdpncreERR26mTmG immunolabeled for αSMA. The dotted line delimits the fascia or wound region. Arrowheads indicate the original injury site. The inset shows an expanded view of the outlined region. Scale bars: 500 μm (f and e,i, main images) and 50 μm (g and e,i, expanded views).
Fig. 2
Fig. 2. Targeting fascia differentiation impairs tissue contraction and wound closure.
a, The fascia explant culture method. b, Representative bright-field images of fascia explants at indicated timepoints of culture (left) and area versus time contraction measurements (right). n = 5 from 3 biological replicates. c, Representative micrographs of fascia explants immunolabelled for PDPN, pSTAT3, RUNX2 or αSMA (left) and quantification of expressing cell fraction at 1, 3 and 6 days of culture normalized to day 1 values (right). n = 3 biological replicates. d, Representative images of fascia explants at 6 days of culture (left), contraction dynamics (top right) and total contraction values (bottom right) showing the effects of cell ablation (freeze–thawing) and different serum conditions. n = 3 (full serum and freeze–thawing) and 4 (heat-inactivated high and low serum) biological replicates. HI, heat-inactivated. Colours of the image outlines indicate treatments in the graphs. e, Representative photographs of splinted wounds on PDPN-related transgenic lines at indicated timepoints after injury (top), wound area quantification (bottom left) and contraction percentage at the indicated dpi (bottom right), showing that ablation of proinflammatory fibroblasts delays wound closure. n = 6 wounds from 3 biological replicates. WT, wild type. f, Masson’s trichrome staining of control (top left) and ablated (bottom left) 7 dpi wounds. The dotted line delimits the wound region. Arrowheads indicate the original injury site. High-magnification images of control (top middle) and ablated (bottom middle) 7 dpi wounds immunolabelled for αSMA. Right, myofibroblast ratio in wounds. n = 4 (control) and 5 wounds from 3 biological replicates. Colours of the image outlines indicate treatments in the graph. Two-tailed t-tests. Scale bars: 2 mm (b,d), 500 μm (f, left) and 50 μm (c and f, middle).
Fig. 3
Fig. 3. A RA gate supports the proinflammatory state and limits myofibroblast differentiation.
a, Expression scores of signalling pathway genes along the fascia-to-myofibroblast trajectory. b, Expression of chemokine- and RA-related genes. c,d, Representative micrographs of fascia-traced fibroblasts using the Cd201creERR26Ai14 system, showing the co-expression with PDPN and CCL2 (c) or CXCL1 (d). e,f, Top, representative immunolabelling for ALDH1A3 (e) and CYP26B1 (f) using ‘16_colours’ pseudo-colouring representing expression intensity. Bottom, magnification of fascia-traced cells showing co-expression with PDPN and ALDH1A3 (e) or CYP26B1 (f). g, Bright-field images of control, RA-treated or CYP26B1 inhibitor (inh)-treated fascia explants (left), explant area over time (top right), and total contraction (bottom right). n = 3 biological replicates. Colours of the image outlines indicate treatments in the graphs. h, Representative micrographs from fascia explants immunolabelled for CCL2, PDPN, RUNX2 or αSMA (left) and the percentage of cells expressing the markers (right) in control, RARγ agonist (ago) or pan-RAR antagonist (antago) treatments. Colours of the image outlines indicate treatments in the graph. n = 3 biological replicates. i, High-magnification images of control (top left) and treated (bottom left) 3 dpi wounds immunolabelled for the immune cell marker CD45, and CD45+ cell ratio (right). n = 6 control and 3 treated wounds from 3 biological replicates. Colours of the image outlines indicate treatments in the graph. j, Low-magnification images of Masson’s trichrome-stained control (top left) or treated (bottom left) 14 dpi wounds, and quantification of scar area (middle). The dotted line delimits the analysed wound area. Arrowheads indicate the original injury borders. n = 6 control and treated wounds from 3 biological replicates. High-magnification images of control (top) and treated (bottom) wounds immunolabelled for αSMA and positive cell ratio in scars (right). N = 5 wounds from 3 biological replicates. Colours of the image outlines indicate treatments in the graph. Two-tailed t-tests. Scale bars: 2 mm (g), 500 μm (e,f, top and j, left) and 50 μm (c,d,h,i, and e,f, bottom and j, right).
Fig. 4
Fig. 4. HIF1α mediates the transition to proto-myofibroblasts and tissue contraction.
a, HIF1α activity versus expression correlations in the different fibroblast clusters from the scRNA-seq data. Pearson’s R coefficient is shown. b, Representative micrographs of wounds in Cd201creERR26Ai14 and PdpncreERR26mTmG mice, and fascia explant at indicated timepoints after injury or culture showing the expression of HIF1α. c, Representative high-magnification images of control and HIF1α inhibitor-treated PdpncreERR26mTmG wounds showing the expression of pSTAT3 or RUNX2 in GFP-traced cells (left) and marker-expressing cell ratios (right). n = 6 wounds from 3 biological replicates. d, Representative photographs of control, fascia or proinflammatory HIF1α null wounds at 9 dpi (left). Wound area quantification over time (middle), and contraction at 7 dpi (top right) and at 9 dpi (bottom right). Colours of the image outlines indicate treatments in the graph. n = 6 wounds from 3 biological replicates for each genotype. e, Masson’s trichrome staining (top) and wound maturation-related measurements (bottom) of 9 dpi wounds from indicated genotypes. n = 12 images from 3 biological replicates per each genotype. f,g, Fascia ECM fate mapping in 3 dpi wounds treated with HIF1α inhibitor. f, Representative low-magnification (left) and high-magnification (right) images of control or HIF1α inhibitor-treated wounds. g, Lacunarity and fractal dimension density plots to assess porosity (lacunarity) and shape complexity (fractal dimension) differences in labelled ECM from control or HIF1α inhibitor-treated wounds (left) and individual comparisons (right). n = 11 images from 3 biological replicates for each condition. The dotted line delimits the wound region. Arrowheads indicate the original injury site. All P values (except in a) were obtained from two-tailed t-tests. Scale bars: 500 μm (e and f, left) and 50 μm (b,c, and f, right).
Fig. 5
Fig. 5. Fascia-to-myofibroblast trajectory in human skin pathologies.
a, ‘Transfer learning’ for the mapping of human fibroblasts using the mouse atlas as a reference. UMAP representation of mouse (left) and human fibroblasts (right). b, Photograph (top left) and low-magnification image of trichrome-stained section (bottom left) of a human keloid lesion. Right, high-magnification micrographs of indicated regions of healthy and keloid tissue that were trichrome-stained or immunolabelled for the fascia marker PI16 or the myofibroblast markers αSMA and RUNX2. c, PAGA connectivities embedded onto the UMAP graph of the human fibroblast supercluster (left) and the diffusion pseudotime arrangement (right). d, UMAP analyses of subclusters involved in the fascia-to-myofibroblast trajectories in mouse wound healing and indicated human skin pathologies (top) and their pseudotime ordering (bottom), showing that fascia fibroblasts must transition to proinflammatory fibroblasts before becoming myofibroblasts. e, RA, hypoxia and TGFβ signalling pathway activities across the inferred trajectories in all datasets, showing the conserved connections of RA to the proinflammatory state and hypoxia to the myofibroblast state. f, HIF1α inhibitor and RA treatments in human fascia explants replicate mouse experiments. Representative bright-field photographs of control, RA-, or HIF1α inhibitor-treated fascia explants at indicated timepoints after culture (left), explant area over time (top right) and total contraction (bottom right). Colours of the image outlines indicate treatments in the graph. n = 4 technical replicates for each condition. The dotted line delimits the keloid lesion. Two-tailed t-tests. Scale bars: 2 mm (e), 500 μm (b, left) and 50 μm (b, right).
Extended Data Fig. 1
Extended Data Fig. 1. Longitudinal single-cell RNA sequencing of stromal cells during murine wound healing.
a. Experimental approach for the Engrailed-1 lineage tracing coupled with stromal cell enrichment and Dropseq method for single-cell sequencing. b. UMAP representations of complete dataset color-coded for samples (time points and cell number, left) and Pdgfra expression (right) to identify fibroblasts. c. UMAP representation of fibroblast clusters (left) and the cluster composition of the different samples (right) revealing homeostatic (always present) and injury-specific populations (absent in uninjured sample). d. Fraction in % of each injury-specific population across samples (time-points). e. Ridge plots depicting profile scores from indicated fibroblast subtypes in each cluster. Gray lines indicate the overall mean for each profile score and the white lines indicate the cluster mean. Colour arrows indicate clusters with the highest profile for each fibroblast subtype. f. Gene expression dot-plots of top markers for homeostatic (left) and injury-related (right) clusters. g. Overrepresented GO terms in indicated injury cluster. Scatter plots show the fold enrichment (x-axis) of the term (y-axis), genes expressed/genes in term coverage in % (dot size), and the false discovery rate value (colour gradient).
Extended Data Fig. 2
Extended Data Fig. 2. Fascia-to-myofibroblast differentiation occurs within the En1-lineage.
a. UMAP representation of fibroblast showing GFP expression (EPFs) that were sorted and subclustered. b. UMAPs showing the skin fibroblast profile scores (top) and their associated EPF subclusters (bottom). c. UMAP of EPFs subclusters. d-e. An intermediate state with both naïve fascia and proinflammatory profiles supports the transition sprouting from fascia fibroblasts. d. Sample composition of EPF subclusters from the fascia-to-myofibroblast trajectory showing that the intermediate state appears in early wounds. e. Expression dot-plot of naïve fascia and proinflammatory markers being present in the intermediate state.
Extended Data Fig. 3
Extended Data Fig. 3. State-specific regulons reveal a stepwise differentiation linked to the wound healing phases.
a. Analysis pipeline to determine the collection of transcription factors (programme) and their associated regulons for each fibroblastic state. b-e. UMAPs of programme (left) and regulon scores (centre), and their overrepresented GO terms (right) for the fascia (b), proinflammatory (c), proto-myofibroblast (d), and myofibroblast states (e). f. Scheme of the fibroblastic states along the trajectory and their phenotype revealed from scRNAseq analysis.
Extended Data Fig. 4
Extended Data Fig. 4. Spatiotemporal patterns during the transition.
a. UMAPs of fibroblast from trajectory, colour-coded for individual clusters (left) and marker genes used in this study (right). b-d. Representative immunostainings (left) for PDPN (a), pSTAT3 (b), or RUNX2 (c) from 3- (a-b) or 7-dpi wounds (c) and marker-expressing cell quantifications at different timepoints after injury (right). N = 16 (3 dpi), 12 (7 dpi), and 3 (14 dpi) images from PDPN-stained (a) sections. 6 (3 dpi) and 4 (7 and 14 dpi) images from pSTAT3-stained (b) sections. 3 (3 dpi) and 4 (7 dpi) images from RUNX2-stained (c) sections. All images were obtained from 3 biological replicates for each timepoint. High magnification images (bottom) from rectangle insert in low-power images (top). Dotted line delimits the wound region. Arrowheads indicate the original injury site. e. Schematics of the wound regions analysed and the spatial cues that defined them. f-h. “Fire” pseudo-colouring representations (top) to depict expression intensity of PDPN (e), pSTAT3 (f), or RUNX2 (g) within the different wound regions at indicated dpi. Mean Gray Value (MGV) expression intensity quantifications (bottom) at indicated dpi in the different wound regions. N = 12 (upper wound and wound core) and 13 (wound fascia) values from PDPN-stained (e) sections. 7 (upper wound and wound core) and 8 (wound fascia) values from pSTAT3-stained (f) sections at 3 dpi. 4 values from pSTAT3-stained (f) sections at 7 dpi. 3 (upper wound) and 4 (wound core and wound fascia) values from RUNX2-stained (g) sections. All images were obtained from 3 biological replicates for each timepoint. Dotted line delimits each wound region. All p-values (p) indicated were obtained from two-tailed T-tests. Scale bars: 500 microns in low magnification (a-c and e-g), and 50 microns in high magnification micrographs (a-c). i. Spatial distribution of the fibroblast states in discrete wound regions.
Extended Data Fig. 5
Extended Data Fig. 5. CD201CreERR26Ai14 genetic lineage tracing system to fate map fascia fibroblasts.
a. Homeostatic fibroblast fractions in fascia marker-expressing cells within the scRNAseq dataset. b. Flow cytometry strategy to identify proportions of different cell types labelled with TdTomato in the uninjured dermis and fascia, as well from wound and bone marrow from 7 dpi CD201CreERR26Ai14 mice. c. TdTomato-labelled fraction (left) from total fibroblasts (PDGFRα+), epithelial (EPCAM+), leukocytes (PTPRC+), and endothelial cells (PECAM1+) present in dermis, fascia, wounds, or bone marrow. Insert: labelled fibroblast fraction in wildtype and CreER positive animals shows minimal leaking of the genetic system. All p-values (p) indicated were obtained from two-tailed T-tests. 2-way ANOVA results from TdTomato-positive fractions comparison (right). N = 5 biological replicates. Representative micrographs immunolabeled for fibroblast (PDGFRα), keratinocytes (KRT14), leukocytes (PTPRC), and endothelial cells (PECAM1) markers on CD201CreERR26Ai14 skin sections validating the flow cytometry observations. Scale bars: 50 microns.
Extended Data Fig. 6
Extended Data Fig. 6. Expression of wound fibroblast markers on the CD201CreERR26Ai14 and PdpnCreERR26mTmG genetic lineage tracing systems.
a. Representative low and high magnification (inserts) images showing the expression of PDPN (top), pSTAT3 (middle), and RUNX2 (bottom) in TdTomato-labelled fascia-derived cells on 3 (left) and 7 dpi (right) wounds. b. Representative low (left) and high magnification (right) images showing the expression of PDPN (top), pSTAT3 (middle), and RUNX2 (bottom) in GFP-labelled proinflammatory-derived cells on wounds at indicated timepoints. c. Representative low (left) and high magnification (middle) images showing the residual labelling with GFP in lymphatic vessels (LYVE1+) in wounds at indicated timepoints. Cell fractions of labelled-lymphatic endothelial cells from total traced and from total lymphatic vessels in wounds at indicated timepoints. N = 3 biological replicates. Dotted line delimits the wound region. Arrowheads indicate the original injury site. Scale bars: 500 microns in low magnification, and 50 microns in high magnification micrographs.
Extended Data Fig. 7
Extended Data Fig. 7. RA supports the proinflammatory state by inducing a monocyte recruitment phenotype.
a. Representative brightfield images at day 6 of culture (left), explant area quantifications over time (middle), and overall contraction quantifications (right) from fascia explants treated with RAR-selective agonists and pan-antagonist. N = 4 (area vs time) and 3 (total contraction) biological replicates. Two-tailed T-tests. Scale bars: 2 mm. b. Representative photos of control or RARγ agonist-treated wounds at 6 dpi (left), wound closure measurements (middle), and total wound contraction by 6 dpi (right). N = 6 wounds from 3 biological replicates. c. Flow cytometry strategy to identify treatment-induced changes in the recruitment of different immune cell types in wounds. d. Total cell type fractions at 3 (top) and 7 dpi (bottom) of general leukocytes (PTPRC+), monocytes/macrophages (ADGRE1+), neutrophiles (LY6G+), T (CD3+), and B lymphocytes (CD19+). N = 3 biological replicates. Two-tailed T-tests. e. Strategy for fascia fibroblast purification and culture (left). Expression changes (right) of proinflammatory (Ccl2 and Cxcl1) and myofibroblast markers (Acta2) in IL1β- (inflammation-inducing) or TGFβ1-containing media (myofibroblast-inducing). N = 3 technical replicates. Expression changes normalized to control medium. p values on bars from two-tailed T-tests (top) and 1-way ANOVA comparisons between treatments (bottom). f-g. Expression changes of indicated markers in inflammation- (f) and myofibroblast-inducing media (g) exposed to exogenous RA at indicated concentrations. N = 3 technical replicates. Expression changes normalized to control IL1β- (f) or TGFβ1-containing medium (g). p values on bars from two-tailed T-tests (top) and 1-way ANOVA comparisons between treatments (bottom).
Extended Data Fig. 8
Extended Data Fig. 8. HIF1α instructs the transition into (proto)myofibroblasts.
a. Control (top) or HIF1α inhibitor-treated (bottom) explants after 6 days of culture (left), area over time (middle), and contraction (right) measurements. N = 6 (control) and 3 (inhibitor) replicates. b. Immunolabeling (left) and marker-positive cell ratios (right) of proinflammatory fibroblast (PDPN+) or myofibroblasts (αSMA+) in control (top) or inhibitor-treated (bottom) explants. N = 3 biological replicates. c. Immunolabeling (top left) and YAP1+ cell ratios (bottom left) upon chemical TAZ agonism. N = 3 (controls) and 4 (agonist) biological replicates. TAZ agonist-treated (centre top) and combined treatments with the inhibitor (centre middle) or RA (centre bottom) explants after 6 days of culture. Area over time (top right), and contraction (bottom right) measurements. N = 3 biological replicates. d. TGFβ1-treated (top left) and combined treatments with the inhibitor (centre left) or RA (bottom left) explants after 6 days of culture. Area over time (top right), and contraction (bottom right) measurements. N = 3 biological replicates. e. Immunolabeling (top) and pSMAD2+ cell ratios (bottom). N = 3 biological replicates. f. Correlation of HIF1α regulon vs hypoxia activity, positively regulated genes involved in TGFβ pathway (bottom). g-h. UMAPs of gene expression and schematic representation of HIF1α-regulated TGFβ modulators. i. Representative photographs (left) of control (top) or inhibitor-treated wounds (bottom) at 7 dpi. Wound area measurements over time (top right) and overall contraction at 7 dpi (bottom right). N = 3 biological replicates. j. Trichrome-stained micrographs of control (top) and treated wounds (bottom) at 7 dpi. k. Micrographs of control (top left) and treated 3 dpi wounds (bottom left) immunolabeled for CD45/PTPRC and positive cell ratios (right). N = 6 (control) and 5 (treated) wounds from 3 biological replicates. All p-values from two-tailed T-tests. Scale bars: 2 mm in explants photographs (a, c-d), 500 microns (g), and 50 microns (b-c, e, and h).
Extended Data Fig. 9
Extended Data Fig. 9. Fate mapping of fascia extracellular matrix.
a. Schematics of fascia-matrix labelling using NHS-Pacific Blue. b. Representative low magnification (top) and high magnification (bottom) images of control wounds immunolabeled for PDPN or pSTAT3, showing association with traced extracellular matrix. Scale bars: 500 microns in low magnification and 50 microns in high magnification micrographs.
Extended Data Fig. 10
Extended Data Fig. 10. Comparative analysis of human and mouse fibroblasts subtypes.
a-b. UMAP representation of scRNA-seq datasets of denoted human skin pathologies color-coded for sample of origin (a) and the pan-fibroblast marker PDGFRA expression levels (b). c. Composition charts depicting the proportion of the different fibroblast subtypes for each dataset. d. Expression comparison between merged human (red) and mouse datasets (blue) of top marker genes for the human fibroblast clusters. Expression of analogous fibroblast clusters is denoted in red rectangles. e. UMAP representations the expression levels of highly conserved markers in the merged human (top) and mouse (bottom) datasets.

References

    1. Eming SA, Martin P, Tomic-Canic M. Wound repair and regeneration: mechanisms, signaling, and translation. Sci. Transl. Med. 2014;6:265sr6. doi: 10.1126/scitranslmed.3009337. - DOI - PMC - PubMed
    1. Correa-Gallegos D, Jiang D, Rinkevich Y. Fibroblasts as confederates of the immune system. Immunol. Rev. 2021;302:147–162. doi: 10.1111/imr.12972. - DOI - PubMed
    1. Raziyeva K, et al. Immunology of acute and chronic wound healing. Biomolecules. 2021;11:700. doi: 10.3390/biom11050700. - DOI - PMC - PubMed
    1. Pakshir P, et al. The myofibroblast at a glance. J. Cell Sci. 2020;133:jcs227900. doi: 10.1242/jcs.227900. - DOI - PubMed
    1. Falanga V, et al. Chronic wounds. Nat. Rev. Dis. Primers. 2022;8:50. doi: 10.1038/s41572-022-00377-3. - DOI - PMC - PubMed

MeSH terms