. 2023 Nov;623(7988):828-835.
doi: 10.1038/s41586-023-06740-y. Epub 2023 Nov 15.

The extracellular matrix dictates regional competence for tumour initiation

Affiliations

The extracellular matrix dictates regional competence for tumour initiation

Nordin Bansaccal et al. Nature. 2023 Nov.

Abstract

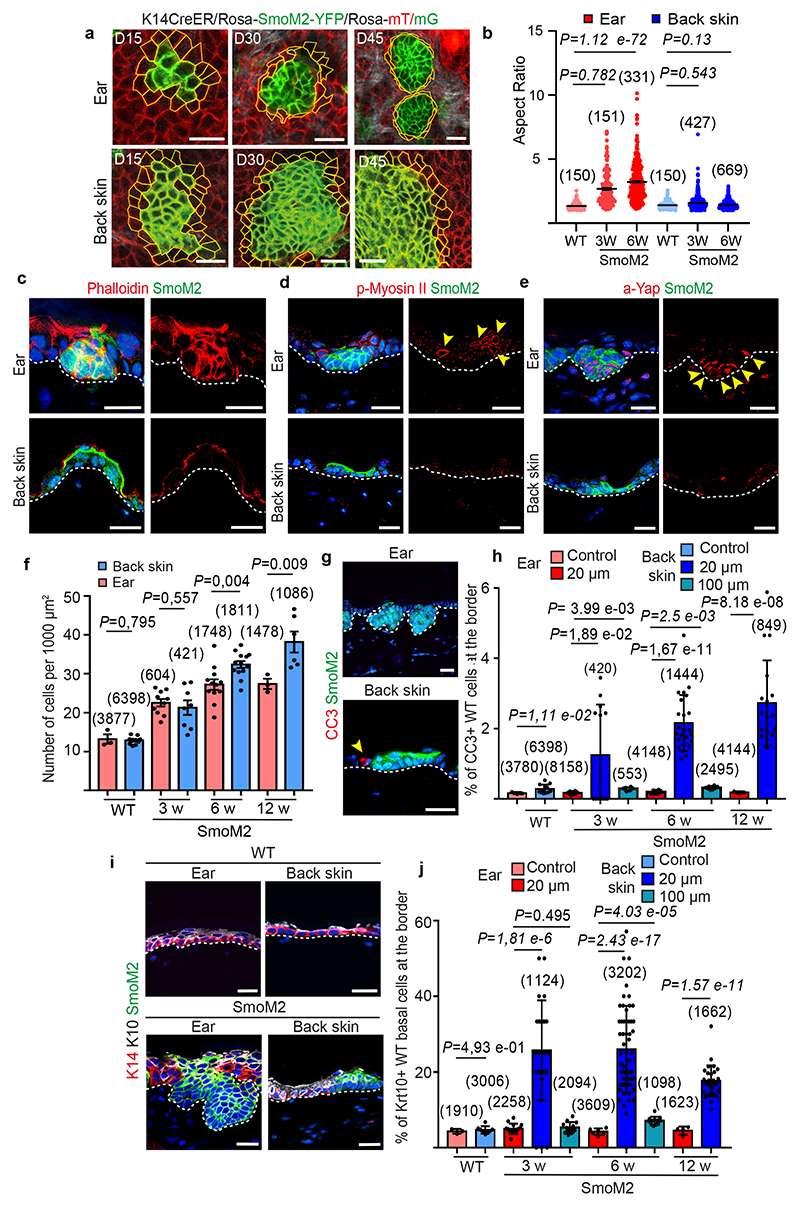
The skin epidermis is constantly renewed throughout life1,2. Disruption of the balance between renewal and differentiation can lead to uncontrolled growth and tumour initiation3. However, the ways in which oncogenic mutations affect the balance between renewal and differentiation and lead to clonal expansion, cell competition, tissue colonization and tumour development are unknown. Here, through multidisciplinary approaches that combine in vivo clonal analysis using intravital microscopy, single-cell analysis and functional analysis, we show how SmoM2-a constitutively active oncogenic mutant version of Smoothened (SMO) that induces the development of basal cell carcinoma-affects clonal competition and tumour initiation in real time. We found that expressing SmoM2 in the ear epidermis of mice induced clonal expansion together with tumour initiation and invasion. By contrast, expressing SmoM2 in the back-skin epidermis led to a clonal expansion that induced lateral cell competition without dermal invasion and tumour formation. Single-cell analysis showed that oncogene expression was associated with a cellular reprogramming of adult interfollicular cells into an embryonic hair follicle progenitor (EHFP) state in the ear but not in the back skin. Comparisons between the ear and the back skin revealed that the dermis has a very different composition in these two skin types, with increased stiffness and a denser collagen I network in the back skin. Decreasing the expression of collagen I in the back skin through treatment with collagenase, chronic UV exposure or natural ageing overcame the natural resistance of back-skin basal cells to undergoing EHFP reprogramming and tumour initiation after SmoM2 expression. Altogether, our study shows that the composition of the extracellular matrix regulates how susceptible different regions of the body are to tumour initiation and invasion.


Conflict of interest statement

Author Information

No competing interests.

Figures

Extended data Fig. 1 |
Extended data Fig. 1 |. Intravital microscopy set up to follow the same clone overtime in living animals
a. Set-up of intravital microscope. b, c. Making tattoos in the mouse ear (b) and back skin (c). d-e. Method combining tattoo and the stable pattern o f hair follicles to establish spatial coordinate to monitor and track the same clones in the skin by intravital microscopy overtime. For the ear (d), we used a 30g needle to make 3 punctiform tattoos. The tattoos are visible at 10x magnification. At 10x magnification, we can select an easily identifiable area using the hair follicles (yellow dashed square). At 40X magnification, we can image an area at the single cell resolution. This area will be revisited overtime to monitor cell dynamics. The same strategy is used to follow the same clones overtime in the back skin, with the difference that tattooing is performed using a tattoo machine. For more details, see Methods. White dashed line: delimitation of the tattoo. Hair follicles are numbered.
Extended data Fig. 2 |
Extended data Fig. 2 |. Clonal dynamics of normal epidermis and mode of cell division of SmoM2-cells in ear and back skin
a, b. Microscopy analysis of β4 integrin (β4) (a) and Laminin-332 (Lam5) (b) in SmoM2 clones in the ear and the back skin 6 weeks following tamoxifen administration. Note the small disruption of the basal lamina (BL) at the leading edge of SmoM2 clones invading the dermis (yellow arrows). c, d. Quantification of the fluorescence intensity of the immunostainings of β4 (left) and Lam5 (right) in control and K14CreER/Rosa-SmoM2-YFP mice 6 weeks after SmoM2 expression. Measurements were performed along the BL in control and at the leading edge of invading BCC using ImageJ. For the control, 21 areas for β4 and 20 areas Lam5 were analysed (n=3). For SmoM2, 41 BCC for β4 and 56 BCC for Lam5 (n=3). Two-tailed z-test. e. Transmission electron microscopical images of ear and back skin ultrathin upon sections from control and K14CreER/Rosa-SmoM2-YFP mice 6 weeks after SmoM2 expression. Representative images show the remodelling of the BL (increased (blue arrow) or reduced (yellow arrow)) observed at the leading edge of BCC in the ear epidermis whereas the BL remains intact in the back skin after SmoM2 expression. EC: epidermal cell. BL: basal lamina. Scale bar: 200 nm. f. Quantification of the total number of cells per clone in WT ear epidermis at 2, 4, and 6 weeks after clonal marking following tamoxifen injection by intravital microscopy (n=4). Kruskal-Wallis test. g. Intravital imaging of the same clones in the outer part of the ear skin at 2, 4, and 6 weeks after tamoxifen administration to K14CreER/Ichr-Ctrl-mosaic mice. h. Whole mount images of epidermis of K14CreER/Ichr-Ctrl-mosaic mice from the inner and outer part of the ear, the back and the tail at 45 days after tamoxifen administration. 40x Magnification. i. Quantification of the number of cells per clones at 6 weeks on whole mount of epidermis of K14CreER/Ichr-Ctrl-mosaic. The number of basal cells found by intravital microscopy was similar to the one found by whole mount immunostaining. (n=4 mice). Kruskal-Wallis test. j, k. BrdU pulse-chase analysis to analyse the fate of two dividing daughter cells (doublets). Whole mount images of SmoM2-clones in the ear (j) and the back skin (k) showing the location of BrdU doublets: two BrdU+ basal cells, one basal and one suprabasal BrdU+ cells or two suprabasal BrdU+ cells. l. Percentage of cell fate outcome in WT and SmoM2 cells in the ear and in the back skin. WT ear cells (61 BrdU+ doublets from 3 mice), ear 6 weeks SmoM2-clones (110 BrdU+ doublets from 4 mice), ear 12 weeks-SmoM2-clones (85 BrdU+ doublets from 3 mice), WT back skin cells (113 BrdU+ doublets from 3 mice), 6 weeks SmoM2-clones (137 BrdU+ doublets from 4 mice) and 12 weeks SmoM2-clones (115 BrdU+ doublets from 3 mice). These data show that in WT ear and back skin, most division present asymmetric cell fate outcome, whereas most SmoM2 cells in WT ear and back skin divide symmetrically. a, b, g, h. Scale bar, 20μm. f, i. In parentheses, the number of clones. c, d, f, i. Mean +- SEM.
Extended Data Fig. 3 |
Extended Data Fig. 3 |. Expression of actin, phospho-myosin and active YAP in SmoM2 clones in the ear and back skin epidermis
a-b. Immunostainings for actin (phalloidin) (a) phospho-myosin II (P-Myosin II) (b) in control and K14CreER/Rosa-SmoM2-YFP mice at 6 weeks after SmoM2 expression, revealing an increase in the level of F-actin (a) and phospho-myosin II (b) in SmoM2-cells in the ear. In addition, some WT cells at the border of the ear clones were also positive for phospho-myosin II. No change of phalloidin or phospho-myosin II was found in the back skin. Red: Phalloidin or phospho-myosin II; Blue: Hoechst. Scale bar= 20 μm. c. Immunostainings for active Yap (aYap) in control and K14CreER/Rosa-SmoM2-YFP mice at 6 weeks after SmoM2 activation, revealing an increase expression of nuclear YAP at the leading edge of SmoM2 expressing clones and in the WT cells at the border of the clone in the ear. Only rare nuclear YAP expressing cells were found in the SmoM2 expressing cells of the back skin. Red: aYAP (d) Green: SmoM2; Blue: Hoechst Scale bar= 20 μm. d, e. Immunostainings on whole mount for actin (phalloidin) (d), and active-Yap (aYap) in K14CreER/Rosa-SmoM2-YFP/Rosa-mT/mG 3 weeks after SmoM2 activation, showing a higher level of actin expression and a-Yap in SmoM2-cells in the ear. No change of actin or aYap was found in the back skin. Blue: Hoechst. Scale bar= 20 μm
Extended Data Fig. 4 |
Extended Data Fig. 4 |. Cell competition, proliferation and apoptosis surrounding SmoM2 clones in the back skin and the ear
a. Immunostainings of EdU in ear and the back skin of K14CreER/Rosa-SmoM2-YFP 6 weeks after SmoM2 expression. b. Quantification EdU-positive cells in SmoM2-clones in K14CreER/Rosa-SmoM2-YFP at 3 (n=3), 6 (n=4 for the ear and n=5 for the back skin), and 12 weeks (n=3) after SmoM2 activation showing an increase of proliferation in SmoM2-clones compared to the control (n=3). Mean +- SEM. t-test. c. Intravital microscopy analysis of the cell density in WT cells and SmoM2 clones in the ear and the back skin of K14CreER/ Rosa-mT/mG and K14CreER/Rosa-SmoM2-YFP/Rosa-mT/mG before and at 6 weeks after SmoM2 expression. d-e. Quantification of aspect ratio of the SmoM2 cells at the border (d) and at the centre (e) of the clone 3 and 6 weeks after SmoM2 expression. These data show that the SmoM2 cells adopt an elongated shape in the ear whereas in the back skin, SmoM2-cells are more deformed in the centre of the clones than at the periphery. In blue, the average. n= 3 mice for each conditions. Mean +- SEM. Two-tailed z-test. f. Time-lapse intravital microscopy analysis a SmoM2-clone in the back skin of K14CreER/Rosa-SmoM2-YFP/Rosa-mT/mG mouse 10 weeks after tamoxifen administration at different time points for 56 hours showing the clonal expansion of SmoM2 cells and out competition of WT cells surrounding the SmoM2-clone. g. Immunostaining of cleaved Caspase 3 (CC3) in ear and the back skin of K14CreER/Rosa-SmoM2-YFP at 6 weeks after oncogenic expression. Scale bar= 20μm. h. Quantification of CC3+ cells in WT cells and SmoM2 -clones at 3, 6, and 12 weeks after SmoM2 activation showing the increase of apoptosis in SmoM2-clones. Mean +- SEM. t-test. a, c, f, g. Scale bar, 20 μm. b, d, e, h. In parentheses, the number of cells.
Extended Data Fig. 5 |
Extended Data Fig. 5 |. Cell competition, proliferation and apoptosis surrounding SmoM2 clones in the back skin and the ear by whole mounts imaging
a-c. Immunostaining on whole mount back skin and ear epidermis for Caspase cleaved 3 (CC3) (a), Keratin 10 (K10) (b) and EdU (c) in K14CreER/Rosa-SmoM2-YFP/Rosa-mT/mG 6 weeksafter SmoM2 activation. These data show WT apoptotic cells and basal cells expressing K10 at the edge of the SmoM2-clone in the back skin and not in the ear. In the ear and the back skin, Edu positive cells are more present at the periphery of the clone. Scale bar, 20 μm.
Extended Data Fig. 6 |
Extended Data Fig. 6 |. Single cell RNA-seq analysis of WT cells and SmoM2 epidermal cells and FACS sorting strategy
a-b. FACS plots showing the gating strategy used to FACS-isolate the proportion of SmoM2-YFP in K14CreER/Rosa-SmoM2-YFP 6 weeks after oncogenic expression. c. Table showing the genes used to annotate the different clusters. d. Uniform manifold approximation and projection (UMAP) graphic of the clustering analysis for scRNA-seq of the WT ear and back skin epidermis following data integration using Seurat.
Extended Data Fig. 7 |
Extended Data Fig. 7 |. Gene ontology of EHFP associated genes
a. Gene ontology analysis on the genes up regulated in the ear 6W EHFP cluster. Statistics are based on the permutation method. b-g. UMAP plot of the ear and back sample coloured by the level of normalized gene expression values for genes regulating extracellular matrix organization/basal lamina (b), migration (c), regulation of cell proliferation (d), Wnt pathway (e), cell-cell adhesion (f), Hedgehog pathway (g).
Extended data Fig. 8 |
Extended data Fig. 8 |. EHFP reprogramming and block of normal IFE differentiation in SmoM2 expressing cells in the ear and not in the back skin epidermis
a-b. Immunostaining of ear and back skin for Krt15, Lef1 and Som2-YFP in control and in K14-CreER/Rosa-SmoM2 mice at 6 and 12 weeks after tamoxifen induction. SmoM2-cells in the ear skin are reprogrammed into EHFP like cells. c-d. Immunostaining of ear skin and back skin for Krt1, Krt10, and SmoM2-YFP in control and in K14CreER/Rosa-SmoM2-YFP mice at 6 and 12 weeks after tamoxifen induction. SmoM2-cells in the back skin differentiate into K1/10 positive cells. These immunostaining analyses also confirmed the expression of normal differentiation marker Krt1 in the suprabasal cells of the SmoM2-expressing cells in the back skin and the repression of the differentiation in SmoM2 expressing clones in the ear epidermis IFE : interfollicular epidermis. HF : hair follicle. a-d. Scale bar, 20μm.
Extended data 9 |
Extended data 9 |. Orientation of collagen fiber bundles in the ear and back skin
a-f. Angular distribution of collagen fiber bundles measured by OrientationJ software from SHG image of the dermis of the WT ear (a-b), back skin before (c-d) and after collagenase administration (e-f). HBS color-coded map (a,c,e) histogram of local angles (b,d,f) showing the orientation of collagen fiber bundles. The orientation of the collagen bundles was relatively similar in the two locations. HSB = hue-saturation-brightness
Extended data 10 |
Extended data 10 |. ECM composition and remodelling in the ear and the back skin following SmoM2 expression.
a, b. Quantitative proteomic analysis of the dermis following SmoM2 expression in the ear (a) and the back skin (b). Volcano plot indicating the differentially expressed proteins. Proteins upregulated in SmoM2 dermis (red dot) or in WT dermis (blue dot). 742 proteins were significantly downregulated, and 7 proteins were significantly upregulated in SmoM2 back skin dermis samples. Proteomic analysis shows that only very few proteins were more upregulated in the dermis of back skin following SmoM2 expression. 27 proteins were significantly upregulated in WT ear dermis and 40 proteins were significantly upregulated in SmoM2 ear dermis, which contains a higher number of proteins expressed by inflammatory cells after oncogenic expression in the ear. Statistical significance for differential regulation is set at FDR < 0.05 and fold change of 2 (|log2FC| ≥ 1). c. Gene ontology analysis on the proteins upregulated in the SmoM2-ear at 6 weeks after oncogenic expression. Statistics are based on the permutation method. d. H&E staining in control and K14CreER/Rosa-SmoM2-YFP mice of the ear and back skin at 1.5 and 3 months after SmoM2 activation. e. Quantification of CD45+ cells in the dermis of the ear and the back skin in WT and SmoM2 mice at 6 weeks after SmoM2 expression showing the increase of the inflammation in the dermis of the ear after SmoM2 expression but not in the back skin. For each condition, at least 10 area (40x) per mice (n=3) were analysed. In parentheses, number of CD45+ cells. Mean +- SEM. Paired t-test, with Two-sample unequal variance (heteroscedastic). f. Immunostaining for CD45 (pan-immune cells), Vimentin (fibroblasts and inflammatory cells), CD68 (macrophages), CD4 (T helper lymphocytes), CD8 (T cytotoxic lymphocytes) and SmoM2 in control and K14CreER/Rosa-SmoM2-YFP mice at 3, 6, and 12 weeks after SmoM2 expression, revealing a strong recruitment of immune cells in particular macrophages (CD45+ CD68+) and fibroblasts (Vimentin+) in the SmoM2 expressing cells that invade the ear dermis. No inflammatory cell infiltration is observed in the dermis of the back skin. Scale bar, 20 μm.
Extended Data Fig. 11 |
Extended Data Fig. 11 |. The level of collagen 1 expression correlates with the competence for BCC initiation in the tail skin.a.
Collagen 1 immunohistochemistry of the scale and interscale regions of the tail. The level of collagen 1 is higher in the scale compared to the interscale of the tail. Scale bar= 50μm. b. H&E stainings in tail skin of K14CreER/Rosa-SmoM2-YFP mice at 6 weeks after SmoM2 activation, showing that BCC arises from the interscale epidermis whereas the tail scale epidermis (as the back skin) is resistant to SmoM2 induced tumorigenesis. c,. Immunostainings of Lhx2 in the tail of K14CreER/Rosa-SmoM2-YFP mice 6 weeks after SmoM2 activation. Scale bar= 20μm. d. Quantification of tumour invasion measured by the vertical distance between WT cells and smoM2 cells in the tail dermis at 6 weeks after SmoM2 activation. SmoM2-clones in the interscale but not in the scale of the tail skin invade the dermis. 366 clones in the scale region and 318 clones of the interscale region of the tail have been quantified from 3 mice. Mean +- SEM. Kruskal-Wallis test.
Extended data 12 |
Extended data 12 |. Inflammation in the back skin does not promote invasion of SmoM2 expressing cells.
a. Immunostaining of back skin after intradermal injection of PBS (left) or collagenase (right) in control mouse (K14CreER/Rosa-mT/mG), showing the absence of dermal invasion of normal epidermis. b, c. Immunostaining for b4 an Lam5 (b) and electron microscopy imaging (c) of the back skin of WT mice (control) and after collagenase injection showing that the BL remains intact after collagenase injection. Scale bar= 20 μm. EC: epidermal cell. BL: basal lamina. Scale bar for EM images: 500 nm (left) and 200 nm (right). d-h. H&E and immunostaining for CD45 (immune cells), Vimentin (immune cells and fibroblasts) of back skin in control mice (d), one day after collagenase injection (e), of back skin of K14CreER/Rosa-SmoM2-YFP mice at 6 weeks after oncogene expression following bleomycin administration for 1 month (f), of back skin of K14CreER/Rosa-SmoM2-YFP mice at 6 weeks after oncogene expression following daily application of imiquimod for 1 month (g), of back skin in K14CreER/Rosa-SmoM2-YFP 1.5 years old mice at 6 weeks after oncogene expression (h). Scale bar= 20 μm. i. Quantification of CD45+ cells in the dermis of the back skin in WT and SmoM2 mice in different inflammatory conditions (Collagenase, Imiquimod, bleomycin) and in old mice. For the control SmoM2, 472 CD45+ cells for WT (n=3). For the old mice, 569 CD45+ cells from 41 area (n=2). For Imiquimod, 2801 CD45+ cells from 30 area (n=2). For collagenase, 2225 CD45+ cells from 30 area (n=2). For bleomycin, 3094 CD45+ cells from 45 area (n=3). These data show that inflammation induced by imiquimod and bleomycin does not promote invasion of SmoM2 expressing cells. Mean +- SEM; Paired t-test, with Two-sample unequal variance.
Extended data Fig. 13 |
Extended data Fig. 13 |. Gene ontology of SmoM2-cells of the back skin
a. Gene ontology analysis on the genes up regulated in the all the SmoM2-cells of the back skin 6 weeks after oncogenic expression versus the WT cells of the back skin. Statistics are based on the permutation method.
Extended Data Fig. 14 |
Extended Data Fig. 14 |. Model summarizing how extracellular matrix composition dictates the mode of cell competition and competence for tumor initiation.
a. Oncogenic hedgehog activation by SmoM2 oncogene induces BCC in the ear epidermis. SmoM2-cells adopt a placode-like shape, loose their ability to differentiate, and are reprogrammed into an EHFP-like fate. The SmoM2 clones compress the WT cells at the edge. SmoM2 clones invade the dermis until they form a branch-like structure and become invasive BCCs. b. Oncogene-expressing cells in the back skin epidermis undergo clonal expansion in a lateral manner without leading to tumor invasion. SmoM2 cells are very efficient at outcompeting the WT cells but lack the ability to become invasive. The high level of collagen 1 in the dermis of the back skin restricts BCC development and impose a lateral clonal expansion of oncogene-expressing cells. c. Decreasing the abundance of collagen by collagenase injection, during natural ageing and following chronic UV-A exposure overcomes the natural resistance of BCC development in the back skin.
Fig. 1 |
Fig. 1 |. Intravital imaging of clonal expansion and BCC formation in the ear and back skin.
a-d. Intravital imaging of the same SmoM2 expressing clone in the ear (a) and back skin (d) at different time points after TAM administration to K14CreER/Rosa-SmoM2-YFP/Rosa-mT/mG mice. Red: WT cells; Green: SmoM2-cells; Grey: second harmonic generation signal. b, e. Orthogonal views of the same clone presented in figures 1a, d and showing the invasion of the mutated clones over time into the dermis in the ear and the lateral expansion in the back skin. Dashed line: basement membrane. c, f. Immunofluorescence (Left) and Hematoxylin and Eosin (H&E) (Right) stainings of SmoM2-mutated cells in the ear (c) and back skin (f) epidermis of K14CreER/Rosa-SmoM2-YFP/Rosa-mT/mG mice at 12 and 24 weeks post Tamoxifen induction. For H&E, dashed line: epidermal-dermal interface. g. Quantification of the vertical distance between WT and SmoM2 cells showing the depth of invasion of SmoM2-mutated clones at 2 weeks, 4 and 6 weeks after tamoxifen administration. Measurements of the vertical invasion were performed from 3 mice for the ear and 4 mice for the back skin. h. Quantification of the lateral expansion of SmoM2-mutated clones in the ear and back skin epidermis at 2 weeks, 4 weeks and 6 after tamoxifen administration (n= 3 mice for the ear and 4 mice for the back skin). i. Quantification of the number of cells per WT clones after 6 weeks after tamoxifen and SmoM2-expressing clones in the ear and back skin epidermis (total number of cells per clone) at 2 weeks, 4 weeks and 6 weeks after tamoxifen administration. Measurements of the clones were performed on the same image areas from 2 mice (SmoM2) and 4 mice (WT). a-f. Scale bar = 20 μm. g, h, i. The number of clones quantified are indicated in parentheses. Mean +- SEM. Kruskal-Wallis test.
Fig. 2 |
Fig. 2 |. Difference in cell mechanics and competition in the ear and back skin epidermis following SmoM2 expression.
a. Intravital imaging showing the shape of WT cells at border of SmoM2 clone in the ear and back skin epidermis. In the ear, WT cells became elongated whereas they remain cuboidal in the back skin. b. Quantification of aspect ratio of WT cells in control (n=3) and WT cells around SmoM2-clones 3 weeks (n=4) and 6 weeks (n=3 for the ear and n=2 for the back skin) after oncogenic expression. Mean ± SEM. Two-tailed z-test. c-e. Immunostainings for actin (c), phospho-myosin II (d) and active YAP in K14CreER/Rosa-SmoM2-YFP mice at 3 weeks after SmoM2 activation. f. Quantification of cell density in control (n=3) and K14CreER/Rosa-SmoM2-YFP mice at 3 weeks (n=3), 6 weeks (n=5), and 12 weeks (n=3) after SmoM2 expression. Mean +- SEM. Paired t-test, with two-sample unequal variance. g. Immunostainings for cleaved caspase 3 (CC3) in K14CreER/Rosa-SmoM2-YFP mice 6 weeks after SmoM2 activation in the ear and back skin. h Quantification of apoptotic cells in control and WT cells at the border of SmoM2 clones within 20 and 100 μm in K 14CreER/Rosa-SmoM2- YFP at 3 (n=3), 6 (n=4) and 12 weeks (n=3) after SmoM2 expression. i. Immunostainings for Keratin 14 and Keratin 10 in K14CreER/Rosa-SmoM2-YFP mice at 6 weeks after SmoM2 activation in the ear (top) and back skin (bottom). j. Quantification of WT Krt10 positive basal cells in control (n=3) and within 20 and 100 μm from SmoM2 clones in K14CreER/Rosa-SmoM2-YFP mice at 3 (n=3), 6 (n=3 for the ear n=5 for the back skin at 20 μm and n=4 at 100 μm) and 12 weeks (n=3) after SmoM2 activation. h, j. Mean +- SEM. Kruskal-Wallis test. a, c-e, g, i. Scale bar, 20 μm. The number of clones quantified are indicated in parentheses. n = mice.
Fig. 3 |
Fig. 3 |. Single-Cell RNA-seq reveals a block of oncogene induced EHFP reprograming in the back skin.
a-b. Single-cell RNA Sequencing of WT and SmoM2 expressing cells from the back skin and ear at 3 and 6 weeks following oncogene expression. UMAP of the unsupervised clustering analysis of scRNA-seq of basal keratinocytes isolated from WT, 3 weeks and 6 weeks after SmoM2 expression in the ear (a) and back skin (b). Pie chart representing the proportion of the different clusters in the different conditions. SC/CP : Stem cell/Committed progenitors, IFE Diff: interfollicular differentiated, INF Prog: Infundibulum progenitors, INF IST: Infundibulum isthmus, INF Diff: Infundibulum differentiated, EHFP, SG: sebaceous gland, HH Responsive : hedgehog responsive. “Committed cells” are basal cells committed to differentiation that express markers as (Krt14, Krt1 and Hes1) c-d. UMAP plots showing the enrichment score of the EHFP signature, in each cellular cluster from control, 3 weeks, and 6 weeks SmoM2 expressing cells isolated from the ear (c) and back skin epidermis (d). Colour scaling represents the AUC (Area Under the Curve) score of EHFP enrichment as computed by AUCell. e-f. UMAP plots showing the normalized level of gene expression for the indicated EHFP genes (Lhx2/Lgr5) in ear (e) back skin (f). Gene expression is visualized as a colour gradient. g-h. Immunostaining of ear (g) and back skin (h) for EHFP marker P-cadh, Lhx2 and YFP in control and in K14-CreER/Rosa-SmoM2-YFP mice at 3 weeks, 6 weeks, and 12 weeks following SmoM2 expression. Scale bars, 20 μm.
Fig. 4 |
Fig. 4 |. The level of Coll expression correlates with the competence for BCC initiation.
a. Quantitative proteomic analysis of the dermis from the ear and the back skin. Volcano plot shows the statistically significantly (FDR<0.05- and 2-FC) upregulated proteins in the back skin or in the ear. b. RNA fish for Col1a1 and Col1a2 in the WT ear and back skin dermis. c. SHG using confocal imaging of ear and back skin dermis in control mice. d. Quantification of the SHG intensities of ear and back skin dermis in control mice. Measurements of SHG intensities were performed on 3 random areas using intravital microscopy (n=3). e. High magnification of the SHG using confocal imaging to assess collagen fibre bundle of the ear and back skin dermis in control mice. Yellow arrow: collagen fibre bundle size. Scale bar= 5 μm. f. Quantification of the collagen bundle size in the WT ear and back skin (n=3) using ImageJ. In parentheses, the number of bundles. g. Immunohistochemistry of Collagen 1 in control and K14CreER/Rosa-SmoM2-YFP mice at 6 and 12 weeks after SmoM2 activation. h. Stiffness of the dermis measured by atomic force microscopy. Quantification of elastic modulus of the dermis in skin sections of the ear and back skin in control and K14CreER/Rosa-SmoM2 mice 6 weeks after SmoM2 expression (n=2 mice per condition). The number of measurements are shown in parentheses. b, c, g, scale bar, 20 μm. d, f, h, Mean +- SEM. Kruskal-Wallis test. n = mice.
Fig. 5 |
Fig. 5 |. High level of collagen 1 expression constrains BCC development.
a. Collagen 1 immunohistochemistry in the inner and outer ear. b. c. H&E staining (b), immunostainings of Lhx2 (c) in the ear of K14CreER/Rosa-SmoM2-YFP mice at 6 weeks after SmoM2 activation. d. Quantification of tumour invasion measured by the vertical distance between WT cells and SmoM2-cells in the ear at 6 weeks after SmoM2 activation (n=4). e-f. Collagen 1 immunohistochemistry for collagen 1 and confocal analysis using SHG (e) and SHG quantification (f) of the back skin dermis before and 1 day after PBS or collagenase intradermal injection. Scale bar = 50μm for IHC and 20μm for SHG. Measurements of SHG intensities were performed on 3 random areas (n=4 mice). g. Quantification of the collagen bundle size in the WT back skin and back skin after collagenase injection (n=3 mice). h. Lhx2 immunostaining in the back skin after collagenase injection or PBS 6 weeks after SmoM2 expression. i. Vertical distance between WT cells and smoM2 cells at 6 weeks after SmoM2 expression in the back skin following collagenase or PBS injection (n=6 mice) j-r. H&E staining (j, m, p), Collagen 1 immunohistochemistry (k, n, q) and Lhx2 and SmoM2 immunostaining (l, o, r) of the back skin in SmoM2 young (j, k, l), 1.5 years old (m, n, o), and UV-A treated mice (p, q, r). s. Vertical distance between WT cells and smoM2 cells 6 weeks after tamoxifen in the back skin of control mice (n=3), old mice (n=2) and mice treated with UV-A for 8 weeks (n=6). t. Immunostaining of SmoM2-clones of the back skin in young (left) and 1.5 year old SmoM2-mice (right) 6 weeks after SmoM2 expression. yellow arrow= width. Red= height. u. Ratio between the height and width of SmoM2 clones in the back skin in SmoM2 young (n=3) and old mice (n=2) 6 weeks after SmoM2 expression. Mean +- SEM. Two-tailed z-test. v. Quantification of WT basal cells expressing K10 at 20um around SmoM2 clones in the back skin in young (n=3) and 1.5 year-old mice (n=2) 6 weeks after SmoM2 expression. Mean +- SEM. Paired t-test, with two-sample unequal variance (heteroscedastic). a, d, f, g, i, s. Mean +- SEM. Kruskal-Wallis test. a-c, h, j-r, t. Scale bar, 20μm. In parentheses, the number of clones (d, i, s, u, v) or measurements (g) quantified.

References

    1. Blanpain C, Fuchs E. Epidermal stem cells of the skin. Annu Rev Cell Dev Biol. 2006;22:339–373. doi: 10.1146/annurev.cellbio.22.010305.104357. - DOI - PMC - PubMed
    1. Hsu YC, Fuchs E. Building and Maintaining the Skin. Cold Spring Harb Perspect Biol. 2021 doi: 10.1101/cshperspect.a040840. - DOI - PMC - PubMed
    1. Blanpain C, Simons BD. Unravelling stem cell dynamics by lineage tracing. Nat Rev Mol Cell Biol. 2013;14:489–502. doi: 10.1038/nrm3625. - DOI - PubMed
    1. Epstein EH. Basal cell carcinomas: attack of the hedgehog. Nat Rev Cancer. 2008;8:743–754. doi: 10.1038/nrc2503. - DOI - PMC - PubMed
    1. Kasper M, Jaks V, Hohl D, Toftgard R. Basal cell carcinoma - molecular biology and potential new therapies. J Clin Invest. 2012;122:455–463. doi: 10.1172/JCI58779. - DOI - PMC - PubMed

Publication types