. 2023 Dec;624(7990):154-163.
doi: 10.1038/s41586-023-06733-x. Epub 2023 Nov 15.

Single-cell CRISPR screens in vivo map T cell fate regulomes in cancer

Affiliations

Single-cell CRISPR screens in vivo map T cell fate regulomes in cancer

Peipei Zhou et al. Nature. 2023 Dec.

Abstract

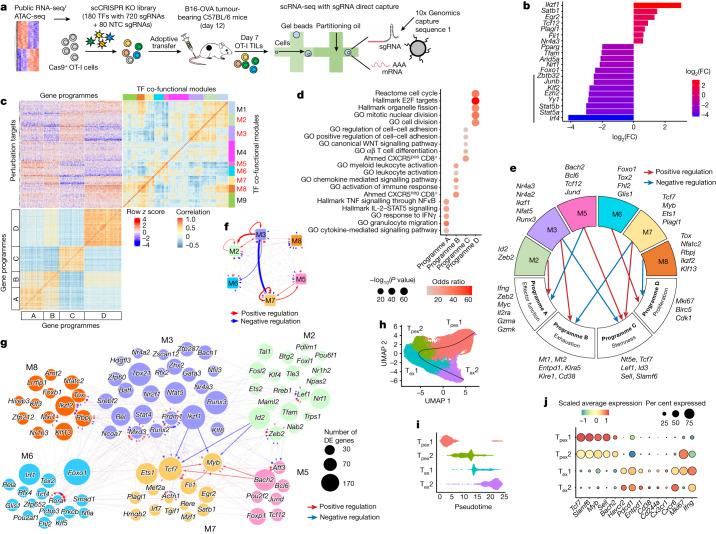
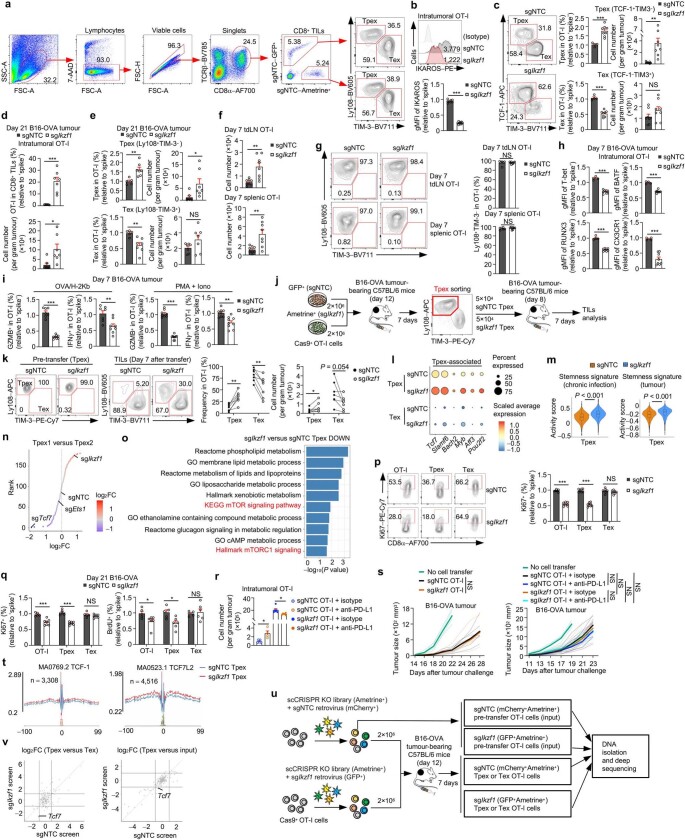
CD8+ cytotoxic T cells (CTLs) orchestrate antitumour immunity and exhibit inherent heterogeneity1,2, with precursor exhausted T (Tpex) cells but not terminally exhausted T (Tex) cells capable of responding to existing immunotherapies3-7. The gene regulatory network that underlies CTL differentiation and whether Tex cell responses can be functionally reinvigorated are incompletely understood. Here we systematically mapped causal gene regulatory networks using single-cell CRISPR screens in vivo and discovered checkpoints for CTL differentiation. First, the exit from quiescence of Tpex cells initiated successive differentiation into intermediate Tex cells. This process is differentially regulated by IKAROS and ETS1, the deficiencies of which dampened and increased mTORC1-associated metabolic activities, respectively. IKAROS-deficient cells accumulated as a metabolically quiescent Tpex cell population with limited differentiation potential following immune checkpoint blockade (ICB). Conversely, targeting ETS1 improved antitumour immunity and ICB efficacy by boosting differentiation of Tpex to intermediate Tex cells and metabolic rewiring. Mechanistically, TCF-1 and BATF are the targets for IKAROS and ETS1, respectively. Second, the RBPJ-IRF1 axis promoted differentiation of intermediate Tex to terminal Tex cells. Accordingly, targeting RBPJ enhanced functional and epigenetic reprogramming of Tex cells towards the proliferative state and improved therapeutic effects and ICB efficacy. Collectively, our study reveals that promoting the exit from quiescence of Tpex cells and enriching the proliferative Tex cell state act as key modalities for antitumour effects and provides a systemic framework to integrate cell fate regulomes and reprogrammable functional determinants for cancer immunity.


Conflict of interest statement

H.C. has consulted for Kumquat Biosciences and Chugai Pharmaceutical.

Figures

Fig. 1
Fig. 1. In vivo scCRISPR screening of intratumoral CTLs reveals connectivity of co-functional modules and gene programmes.
a, Schematic of the scCRISPR screening strategy. b, Relative ratio (log2(fold-change (FC))) of cells with gene-level perturbation compared with sgNTC. Vertical line, TFs excluded for initial network analyses. c, Co-functional modules (with the six major modules highlighted in red) and co-regulated programmes (A–D) were identified by hierarchical clustering. d, Top enriched pathways (two-tailed Fisher’s exact test) in the four co-regulated gene programmes. e, Representation of regulatory connections between the six major modules and gene programmes from c. f, The interaction strengths between modules. Arrow width indicates interaction strength. g, The connectivity between the components of the indicated modules. Arrows indicate positive (red) and negative (blue) regulatory effects. Bold arrows highlight strong interactions between the indicated TFs. Node size, relative to number of perturbation-induced differentially expressed (DE) genes. h, UMAP showing the developmental trajectory of Tpex1, Tpex2, Tex1 and Tex2 cells among Tox+ cells. i, Pseudotime analysis of the indicated states from h. j, Relative expression of cell-state-associated genes.
Fig. 2
Fig. 2. IKAROS promotes the quiescence exit of Tpex1 cells.
a,b, sgNTC (n = 4) or sgIkzf1 (n = 8) OT-I cells were co-transferred with sgNTC-expressing (spike) cells (dual-colour transfer system) into B16-OVA tumour-bearing mice. a, Relative frequency (normalized to spike) and number (per g of tumour tissue) of OT-I cells. b, Frequencies and numbers of Tpex and Tex OT-I cells. c, scRNA-seq analysis of sgNTC and sgIkzf1 OT-I cells and cell cluster proportions from B16-OVA tumours. d, Pseudotime analysis of cell states from c. e,f, Relative (normalized to spike) geometric mean fluorescence intensities (gMFIs) of indicated markers (e) or relative frequency of BrdU+ (f) cells (dual-colour transfer system in B16-OVA tumours) (n = 7 for sgNTC and n = 8 for sgIkzf1 in e; 5 per group in f). gi, B16-OVA tumour-bearing mice that received sgNTC or sgIkzf1 OT-I cells were treated with anti-PD-L1 or isotype control (n = 6 per group). Frequencies of indicated subsets (g), Ki67 Tpex, Ki67+ Tpex, Ki67+ Tex and Ki67 Tex cells (h), or IFNγ+ and GZMB+ OT-I cells (i). j, Tpex-selectively and Tex-selectively accessible peaks in ATAC-seq analysis of sgNTC and sgIkzf1 Tpex and Tex cells (n = 5 per group). k,l, Relative frequency of Tpex cells (k) or Tpex to Tex cell ratio (l) of sgNTC (n = 4), sgIkzf1 (n = 4), sgTcf7 (n = 5) or sgIkzf1 with sgTcf7 (n = 6) OT-I cells (dual-colour transfer system in B16-OVA tumours). Data are representative of three (a,b,e), two (f,k,l) or one (gi) independent experiments. NS, not significant, **P < 0.01, ***P < 0.001; two-tailed unpaired Student’s t-test (a,b,e,f) or one-way analysis of variance (ANOVA) (g,i,k,l). Data are presented as the mean ± s.e.m. Source Data
Fig. 3
Fig. 3. ETS1 is a gatekeeper for the Tpex to Tex1 cell transition.
a, sgNTC and sgEts1 OT-I cells and cell cluster proportions. b,c, Relative frequencies and numbers of total intratumoral OT-I cells (b) and their Tpex and Tex cell subsets in B16-OVA tumours on day 7 (c) (n = 7 per group). d,e, Relative frequencies of GZMB+ and IFNγ+ (n = 7 for sgNTC and 6 for sgEts1) OT-I cells after OVA/H-2Kb stimulation (d) or Ki67+ OT-I populations (n = 5 for sgNTC and 6 for sgEts1) (e). f, Numbers of total, Tpex and Tex OT-I cells after Tpex (left, n = 9 per group) or Tex (right, n = 6 per group) cell secondary transfer. ND, not detected. g, B16-OVA tumour growth with sgNTC or sgEts1 OT-I cell treatment. h, B16-F10 tumour growth with sgNTC or sgEts1 pmel cell treatment. i, B16-hCD19 tumour growth with sgNTC or sgEts1 hCD19 CAR T cell treatment. j, B16-OVA tumour growth with indicated treatments. k, ETS1 and IFNG expression in memory, exhausted and activated CD8+ T cells from patients with BCC (data from Gene Expression Omnibus (GEO) database identifier GSE123813). FDR, false discovery rate. l, TF motif enrichment analysis in sgEts1 compared with sgNTC Tex cells (n = 4 per group). m, Relative frequency and number of sgNTC (n = 3), sgEts1 (n = 5), sgBatf (n = 5), or sgEts1 with sgBatf (n = 5) Tex cells. n, Relative frequencies of GZMB+, IFNγ+ (n = 5 for sgNTC, n = 6 for sgEts1 and sgEts1 with sgBatf, and n = 7 for sgBatf) and Ki67+ (n = 3 for sgNTC, and n = 5 for sgEts1, sgBatf, and sgEts1 with sgBatf) intratumoral OT-I cells. Data are representative of three (be,g), two (f,h,i,m,n) or one (j) independent experiments. *P < 0.05, **P < 0.01, ***P < 0.001; two-tailed unpaired Student’s t-test (be), two-tailed paired Student’s t-test (f), two-way ANOVA (gj), two-tailed Wilcoxon rank-sum test (k) or one-way ANOVA (m,n). Data are presented as the mean ± s.e.m. Source Data
Fig. 4
Fig. 4. RBPJ drives Tex1 to Tex2 cell differentiation.
a, Enrichment (red) or depletion (blue) of sgRNAs in Tex1 compared with Tex2 cells from scCRISPR screening. b,c, Relative frequencies and numbers of OT-I cells (n = 6 for sgNTC and n = 7 for sgRbpj) (b) and their Tpex and Tex subsets (n = 7 for sgNTC and n = 10 for sgRbpj) (c) in B16-OVA tumours on day 7 (dual-colour transfer system). d, Relative frequencies of Ki67+ (n = 7 for sgNTC and n = 10 for sgRbpj; left) and BrdU+ (n = 5 for sgNTC and n = 6 for sgRbpj; right) cells among indicated subsets. e, sgNTC or sgRbpj OT-I cells were individually transferred into B16-OVA tumour-bearing mice. Frequency (left) and number (right) of OT-I cells on day 7 after adoptive transfer (n = 6 for sgNTC and n = 4 for sgRbpj) (single-colour transfer system). f, RBPJ expression in OT-I cells from spleen (n = 4) or tdLN (n = 5) and Tpex or Tex OT-I cells from B16-OVA tumours (n = 5) or naive endogenous splenic CD8+ T cells (n = 4). g,h, Numbers of total, Tpex and Tex OT-I cells (g) and CellTrace Violet (CTV) levels (h) after Tex cell secondary transfer to B16-OVA tumours (n = 5 per group). ik, scRNA-seq analysis of sgNTC and sgRbpj OT-I cells from B16-OVA tumours (i), cell cluster proportions (j) and distribution of sgNTC or sgRbpj OT-I cells and expression dynamics of selected genes across pseudotime (k). l, Relative frequencies of indicated cell states from B16-OVA tumours (dual-colour transfer system) (n = 6 for sgNTC and n = 10 for sgRbpj). Data are from representative of three (bd,fh,l) or two (e) independent experiments. *P < 0.05, **P < 0.01, ***P < 0.001; two-tailed unpaired Student’s t-test (be,l), one-way ANOVA (f) or two-tailed paired Student’s t-test (g,h). Data are presented as the mean ± s.e.m. Source Data
Fig. 5
Fig. 5. RBPJ deficiency promotes CTL functional reinvigoration.
a, Expression of HAVCR2 and RBPJ in tumour-derived human CD8+ T cells: NSCLC (data from GEO identifier GSE99254) and CRC (data from GEO identifier GSE108989). b, Gene expression profiles in melanoma-derived human CD8+ T cell populations. c, Numbers of GZMB+ and IFNγ+ sgNTC and sgRbpj OT-I cells isolated on day 7 after adoptive transfer to B16-OVA tumours with OVA/H-2Kb stimulation (n = 7 per group; dual-colour transfer). d, B16-OVA tumour growth with sgNTC or sgRbpj OT-I cell treatment. e, B16-F10 tumour growth with sgNTC (same samples as Fig. 3h) or sgRbpj pmel cell treatment. f, B16-OVA tumour growth with indicated treatments. g, B16-hCD19 tumour growth with sgNTC (same samples as Fig. 3i) or sgRbpj hCD19-CAR T cell treatment. h, E.G7-OVA tumour growth with indicated treatments. i, TF motif enrichment analysis (n = 3 per group) by ATAC-seq of sgRbpj compared with sgNTC Tex cells. j,k, Relative frequency of total intratumoral OT-I cells (j) or Tex OT-I cells (k) transduced with indicated sgRNAs (n = 5 per group; dual-colour transfer). l, Relative expression of DE genes (sgRbpj compared with sgNTC) in sgNTC (n = 4), sgRbpj (n = 4), sgIrf1 (n = 4), and sgRbpj with sgIrf1 (n = 3) OT-I cells. m,n, Relative frequencies of Ki67+ (n = 5 per group) (m) or GZMB+ (n = 5 per group) and IFNγ+ (n = 5 for sgNTC, sgRbpj with sgIrf1, and n = 4 for sgRbpj, sgIrf1) OT-I cells (n). Data are representative of three (c,d,f,g), two (e,j,k,m,n) or one (h) independent experiments. *P < 0.05, **P < 0.01 and ***P < 0.001; two-tailed unpaired Student’s t-test (c), two-way ANOVA (dh) or one-way ANOVA (j,k,m,n). Data are presented as the mean ±s.e.m. Source Data
Extended Data Fig. 1
Extended Data Fig. 1. scCRISPR screening and molecular diversity of intratumoral CTLs.
a, Schematic of the dual sgRNA CRISPR KO vector used for direct-capture Perturb-seq. PS, protospacer sequence. TF.g1, transcription factor (TF) guide RNA 1. TF.g2, TF guide RNA 2. CR, constant region. CS, capture sequence. EFS, EF1α short promoter. b, Percentage of dual sgRNA CRISPR KO vector-transduced OT-I cells (Ametrine+). c, Bioinformatic approach that nominated the 180 TF targets in the direct capture Perturb-seq library (see Methods). DE, differential expression. DA, differentially accessibility of chromatin state; ME, motif enrichment. d,e, Percentage of intratumoral OT-I cells with the indicated number of sgRNA(s) detected (d) or that contained two sgRNAs from different vectors or the same vector (e). f, Uniform Manifold Approximation and Project (UMAP) depicting the six clusters of CD8+ T cells obtained from graph-based clustering and Tox expression. g, Relative expression of CTL signature genes in the six clusters corresponding to Tpex (clusters 0, 1 and 2), Tex (clusters 3 and 4) and Teff (cluster 5) cells from (f). h, UMAP plots showing the expression of genes related to T cell exhaustion (including Tpex and Tex markers) or effector function in intratumoral OT-I cells as identified in scCRISPR screening. i, Activity scores of the curated Tpex-associated, Tex-associated and Teff-associated gene signatures among the Tpex, Tex and Teff cells from the scCRISPR experiment. j, Fold-change (FC)/FC plot comparing transcriptomic profiles of Tex relative to Tpex cells from our scCRISPR experiment (x-axis) with those from B16-OVA tumour-specific CD8+ T cells (y-axis). r, Pearson correlation coefficient. k, Relative intensity of peaks from upregulated open chromatin regions (OCRs) in intratumoral Tpex and Tex cells compared with splenic P14 cells from LCMV Armstrong infection (n = 3 per group). l, Geometric mean fluorescence intensity (gMFI) of TOX expression in OT-I cells from spleen or tdLN and Tpex and Tex OT-I cells from B16-OVA tumours (n = 10 per group). Naive endogenous splenic CD8+ T cells (n = 5). m, Frequencies of Tpex (Ly108+TIM-3CD11c), Tex (Ly108TIM-3+CD11c) and Teff (Ly108TIM-3+CD11c+) cells in intratumoral OT-I cells in B16-OVA tumours on day 7 after adoptive transfer (upper). Lower, TOX or CD39 expression in indicated subsets (n = 5 per group). n, Relative activity scores of the gene programmes A–D (as indicated) in the six clusters from (f). o, Regulatory connections between the nine TF modules and four gene programmes. Red and blue lines indicate positive and negative regulatory effects, respectively. Line width shows regulation strength (see Methods for details). Data are representative of three independent experiments (l,m). ***P < 0.001; two-tailed Wilcoxon rank sum test (i), two-tailed unpaired Student’s t-test (j) or one-way ANOVA (l,m). Data are presented as the mean ± s.e.m. Source Data
Extended Data Fig. 2
Extended Data Fig. 2. Characterization of CTL differentiation states and identification of underlying drivers by scCRISPR screening.
a, UMAP plots with arrows depicting the combined Tpex and Tex (Tpex + Tex) and Teff cluster distribution, and the perturbation-specific cluster in intratumoral OT-I cells from scCRISPR screening. b, TOX, TCF-1, PD-1, and CD39 expression in intratumoral Tpex or Tex OT-I cells, or frequencies of Ki67+, IFNγ+, GZMB+ or TNF+ cells among Tpex or Tex OT-I cells on days 7 (n = 5), 14 (n = 6) or 21 (n = 6) after adoptive transfer to B16-OVA tumour-bearing mice. c, Percentages of indicated OT-I cell states on days 7, 14 or 21 as in (b) as assessed by scRNA-seq. d, Percentages of OT-I cell states in cells transduced with sgNTC, sgMyb and sgTbx21 from scCRISPR screening. e, Pre-ranked GSEA analysis of Tpex2 compared with Tpex1 and Tex2 compared with Tex1 cells using the indicated gene signatures. NES, normalized enrichment score. f, Activity scores of indicated gene signatures in OT-I cell states, and n = 6,202 (Tpex1), n = 3,246 (Tpex2), n = 7,695 (Tex1) or n = 8,631 (Tex2) cells examined over one independent experiment. The boxes stand for 25% to 75% interquartile range (IQR), and the whiskers stand for minimum (25% quantile – 1.5* IQR) to maximum (75% quantile + 1.5* IQR) values. gk, Analyses of indicated intraumoral Tpex or Tex populations or splenic naive CD8+ T cells. Frequency of pS6+ cells (n = 5 for splenic naive CD8+ and 6 for Ki67 Tpex, Ki67+ Tpex, Ki67+ Tex, and Ki67 Tex) (g). CD98 and CD71 expression (n = 6 per group) (h). MitoTracker levels in cells (n = 6 per group) (i). Frequencies of GZMB+ (n = 5 per group) and IFNγ+ (n = 6 per group) cells (j). T-bet and BATF expression (n = 4 for splenic naive CD8+ and 8 for Ki67 Tpex, Ki67+ Tpex, Ki67+ Tex, and Ki67 Tex) (k). FMO, Fluorescence Minus One. l, Top positive and negative regulators of each individual cell state (compared with all other states) in scCRISPR screening. m, Venn diagrams depicting the positive and negative transcriptional regulators of Tpex1 compared with Tpex2 or Tex1 compared with Tex2 states based on scCRISPR screening, with their discrete and overlapping distributions shown. n, Percentages of indicated cell states among cells with indicated perturbations in scCRISPR screening. The same sgNTC cells are presented in (d). o, Enrichment scores (colour-coded) of a co-functional module as a positive or negative regulator of the indicated cell states. Circle size indicates significance (P < 0.05). Data are representative of one (b), three (g,h,j,k) or two (i) independent experiments. NS, not significant; *P < 0.05, **P < 0.01, and ***P < 0.001; two-tailed unpaired Student’s t-test (b), two-tailed Wilcoxon rank sum test (f), one-way ANOVA (gk) or right-tailed Fisher’s exact test (o). Data are presented as the mean ± s.e.m. Source Data
Extended Data Fig. 3
Extended Data Fig. 3. Ikzf1 deficiency promotes Tpex1 cell accumulation.
a, Gating strategies of flow cytometry analysis to identify the sgNTC OT-I cells labeled with different fluorescent proteins and their Tpex and Tex subsets in the dual-colour transfer system. b, IKAROS expression in total intratumoral sgNTC (n = 8) or sgIkzf1 (n = 9) OT-I cells (dual-colour transfer system). c, Relative frequencies and numbers of sgNTC (n = 4) and sgIkzf1 (n = 8) Tpex (TCF-1+TIM-3) and Tex (TCF-1TIM-3+) OT-I cells (dual-colour transfer system). d,e, Relative frequencies and numbers of total (d), Tpex or Tex (e) sgRNA OT-I cells (dual-colour transfer system) from B16-OVA tumours were analyzed on day 21 after adoptive transfer (n = 5 for sgNTC and n = 7 for sgIkzf1). f, Numbers of OT-I cells in tdLN and spleen (dual-colour transfer system) on day 7 after adoptive transfer (n = 8 per group). g, Relative frequencies of Ly108+TIM-3 cells among tdLN and splenic OT-I cells (dual colour-transfer system) (n = 6 for sgNTC and n = 8 for sgIkzf1). h, T-bet, BATF, RUNX3 and CX3CR1 expression in intratumoral OT-I cells (dual-colour transfer system) (n = 4 for sgNTC and n = 8 for sgIkzf1). i, Relative frequencies of GZMB+ and IFNγ+ OT-I cells (dual-colour transfer system) after cognate antigen (n = 7 for sgNTC and n = 8 for sgIkzf1) or PMA plus ionomycin (PMA + Iono) (n = 8 for sgNTC and n = 9 for sgIkzf1) stimulation ex vivo. j,k, Schematic for secondary Tpex cell transfer assay (j). Frequencies and numbers of Tpex and Tex cells from Tpex secondary transfer assay (k) (n = 7 per group). l, Relative average expression of the selected genes in indicated Tpex and Tex OT-I cells as profiled by scRNA-seq (see Fig. 2c). m, Activity scores of stemness-associated signatures (see Methods) in the sgNTC or sgIkzf1 Tpex OT-I cell subset from Fig. 2c, and n = 2,825 (sgNTC) or n = 9,151 (sgIkzf1) cells examined over one independent experiment. The boxes stand for 25% to 75% interquartile range (IQR), and the whiskers stand for minimum (25% quantile – 1.5* IQR) to maximum (75% quantile + 1.5* IQR) values. n, Top enriched (red) and depleted (blue) perturbations in Tpex1 compared with Tpex2 cells. o, Pathway enrichment analysis revealing enrichment of metabolic pathway-related signatures among downregulated (DOWN) genes in sgIkzf1 Tpex cells compared with sgNTC Tpex cells. p, Relative frequencies of Ki67+ cells among total sgNTC (n = 7) or sgIkzf1 (n = 8) intratumoral OT-I cells and their Tpex and Tex subsets (dual-colour transfer system) on day 7 after adoptive transfer. q, Relative frequencies of Ki67+ (n = 5 for sgNTC and n = 7 for sgIkzf1) and BrdU+ (n = 5 for sgNTC and n = 6 for sgIkzf1) cells among indicated sgRNA-transduced intratumoral OT-I cell populations (dual-colour transfer system) on day 21 after adoptive transfer. r, Numbers of total intratumoral OT-I cells in mice given the indicated treatments (n = 5 for sgNTC OT-I + isotype, n = 4 for sgNTC OT-I + anti-PD-L1, and n = 6 for sgIkzf1 OT-I + isotype, sgIkzf1 OT-I + anti-PD-L1). s, Left, B16-OVA tumour growth in mice that received sgNTC (n = 7) or sgIkzf1 (n = 6) OT-I cells. No cell transfer group (n = 4). Right, B16-OVA tumour growth in mice given the indicated treatments (n = 4 for no cell transfer, n = 8 for sgNTC OT-I + isotype, n = 7 for sgNTC OT-I + anti-PD-L1 and n = 9 for sgIkzf1 OT-I + isotype, sgIkzf1 OT-I + anti-PD-L1). t, Footprinting analysis of TCF-1 and TCF7L2 in ATAC-seq analysis of sgNTC and sgIkzf1 Tpex OT-I cells (n = 5 per group). u, v, Schematic for genetic interaction screening of sgRNA-transduced OT-I cells (e.g., sgNTC or sgIkzf1) (see Methods) (u). Sectored scatter plots of gene-level log2FC from sgNTC (x-axis) and sgIkzf1 (y-axis) OT-I cells in genetic interaction screening. The intratumoral Tpex compared with Tex cells and Tpex cells compared with input are shown, with Tcf7 highlighted (v). Data are representative of three (b,c,fh,p), one (d,e,q,r) or two (i,k,s) independent experiments. NS, not significant; *P < 0.05, **P < 0.01, and ***P < 0.001; two-taiIed unpaired Student’s t-test (bi,p,q), two-tailed paired Student’s t-test (k), two-tailed Wilcoxon rank sum test (m), two-tailed Fisher’s exact test (o), one-way ANOVA (r) or two-way ANOVA (s). Data are presented as the mean ± s.e.m. Source Data
Extended Data Fig. 4
Extended Data Fig. 4. Targeting Ets1 promotes Tex1 cell accumulation and antitumour immunity.
a, GSEA analysis revealing enrichment of indicated signatures among genes upregulated (UP) in Tex1 compared with Tpex2 cells as profiled by scCRISPR screening. b, Top enriched (red) and depleted (blue) perturbations in Tex1 compared with Tpex2 cells. c, Expression of Ets1 in indicated OT-I cell states. d, Activity scores of the curated stemness-associated signatures in sgNTC and sgEts1 Tpex and Tex OT-I cells (from scRNA-seq analysis shown in Fig. 3a). e, GSEA analysis revealing enrichment of indicated signatures in sgEts1 compared with sgNTC total (upper) or Tex (lower) OT-I cells. f, Relative expression of FSC-A, CD71 and CD98 in intratumoral OT-I cells (dual-colour transfer system) (n = 3 for sgNTC and n = 7 for sgEts1). g,h, Relative frequencies and numbers of total (g), Tpex (h) and Tex (h) OT-I cells in B16-OVA tumours on day 21 after adoptive transfer (n = 5 for sgNTC and n = 7 for sgEts1). The same sgNTC OT-I cells are presented in Extended Data Fig. 3d, e. i, Numbers of OT-I cells in tdLN (left) and spleen (right) on day 7 after adoptive transfer (n = 5 per group). j, Frequencies of Ly108+TIM-3 OT-I cells in tdLN and spleen (n = 6 per group). The same sgNTC OT-I cells are presented in Extended Data Fig. 3g. k, Relative expression of BATF, T-bet (n = 5 for sgNTC and n = 6 for sgEts1 for both BATF and T-bet), CX3CR1 (n = 7 per group) and CXCR6 (n = 7 per group) in intratumoral OT-I cells (dual-colour transfer system). l, Relative frequencies of GZMB+ and IFNγ+ OT-I cells (dual-colour transfer system) after PMA + Iono stimulation (n = 7 for sgNTC and n = 6 for sgEts1). m, Relative frequencies of BrdU+ cells among indicated intratumoral OT-I cell populations (dual-colour transfer system) (n = 4 for sgNTC and n = 5 for sgEts1) on day 7 after adoptive transfer. n, Relative frequencies of Ki67+ (n = 5 for sgNTC and n = 7 for sgEts1; left) and BrdU+ (n = 5 for sgNTC and n = 6 for sgEts1; right) cells among intratumoral OT-I cell populations (dual-colour transfer system) on day 21 after adoptive transfer. The same sgNTC OT-I cells are presented in Extended Data Fig. 3q. Data are representative of three (f,i,jl), one (g,h,n) or two (m) independent experiments. NS, not significant; *P < 0.05, **P < 0.01, and ***P < 0.001; two-tailed Kolmogorov–Smirnov test with FDR adjustments for multiple comparisons (a,e), two-tailed Wilcoxon rank sum test (c,d) or two-tailed unpaired Student’s t-test (fn). Data are presented as the mean ± s.e.m. Source Data
Extended Data Fig. 5
Extended Data Fig. 5. ETS1–BATF axis impinges upon Tpex to Tex cell transition.
ac, Schematic of Tpex or Tex cell secondary transfer assay (a). CellTrace Violet (CTV) levels in total intratumoral OT-I cells after Tpex (b) or Tex (c) cell secondary transfer (n = 9 per group for Tpex cells and n = 6 per group for Tex cells). d, Left, E.G7-OVA tumour growth in mice given sgNTC (n = 8) or sgEts1 (n = 9) OT-I cells. No cell transfer (n = 4). Right, LLC-OVA tumour growth in mice given sgNTC (n = 9) or sgEts1 (n = 10) OT-I cells. No cell transfer (n = 4). e,f, sgNTC (n = 6) or sgEts1 (n = 7) OT-I cells were transferred to E.G7-OVA tumour-bearing mice (single-colour transfer system). Number of total intratumoral OT-I cells (e). Frequencies and numbers of Tpex and Tex OT-I cells (f). g,h, sgNTC (n = 5) or sgEts1 (n = 7) OT-I cells were transferred to LLC-OVA tumour-bearing mice (single-colour transfer system). Number of total intratumoral OT-I cells (g). Frequencies and numbers of Tpex and Tex OT-I cells (h). i, E.G7-OVA tumour growth in mice given the indicated treatments (n = 3 for no cell transfer and 7 for all other groups). The same sgNTC OT-I + isotype and sgNTC + anti-PD-L1 groups are presented in Fig. 5h. j, ETS1 expression in human intratumoral CD8+ T cells before ICB (Pre-ICB) treatment in individuals with melanoma. k, scRNA-seq analysis of T cells from patients with basal cell carcinoma (BCC) pre- and post-anti-PD-1 treatments. UMAP shows three CD8+ T cell subsets (memory (mem), exhausted (ex) and activated (act)) and the distribution of CD8+ T cells pre- or post-anti-PD-1 treatment. l, ETS1 and IFNG expression in human CD8+ T cell subsets from scRNA-seq analysis of T cells from patients with squamous cell carcinoma (SCC) pre- and post-anti-PD-1 treatments. m, TF motif enrichment analysis of differentially accessible chromatin regions in sgEts1 compared with sgNTC Tpex cells by ATAC-seq (n = 4 per group). n, Footprinting analysis of ATAC-seq peaks in sgNTC and sgEts1 Tex cells, ranked by activity z scores. o, BATF expression in indicated intratumoral OT-I cell populations (dual-colour transfer system) (n = 5 for sgNTC and n = 6 for sgEts1). p, Genetic interaction screen of sgEts1-transduced and sgNTC-transduced OT-I cells (see Methods and similar schematic in Extended Data Fig. 3u). Sectored scatter plot of gene-level log2FC from sgNTC (x-axis) and sgEts1 (y-axis) OT-I cells in genetic interaction screening. The intratumoral Tex compared with Tpex cells and Tex cells compared with input are shown, with Batf highlighted. q, Relative frequency and fold change of number of cells expressing sgNTC (n = 3), sgEts1 (n = 5), sgBatf (n = 5) or sgEts1 with sgBatf (n = 5) (dual-colour transfer system). Data are representative of two (bd,q), one (ei) or three (o) independent experiments. NS, not significant; *P < 0.05, **P < 0.01 and ***P < 0.001; two-tailed paired Student’s t-test (b,c), two-way ANOVA (d,i), two-tailed unpaired Student’s t-test (eh,n,o), two-tailed Wilcoxon rank sum test (j,l) or one-way ANOVA (q). Data are presented as the mean ± s.e.m. Source Data
Extended Data Fig. 6
Extended Data Fig. 6. Rbpj deficiency selectively promotes Tex cell accumulation.
a, Contour density plots on UMAP showing distribution of sgNTC and sgRbpj in indicated OT-I cell states as profiled by scCRISPR screening. The arrow indicates the enrichment of the Tex1 cell population in sgRbpj cells. b, GSEA enrichment of Hallmark gene signatures in sgRbpj compared with sgNTC OT-I cells (based on gene expression in scCRISPR screening). c, Immunoblot analysis of RBPJ expression in OT-I cells transduced with sgNTC or two individual sgRNAs targeting Rbpj (sgRbpj-#1 or sgRbpj-#2) cultured for four days. The numbers show abundance of RBPJ (normalized to β-Actin) relative to that of sgNTC OT-I cells. d, Relative expression of RBPJ in sgNTC (n = 4) or sgRbpj (n = 5) intratumoral OT-I cells (dual-colour transfer system). eg, Number of OT-I cells in tdLN (n = 6 per group) and spleen (n = 7 per group) (e). Frequencies of Ly108+TIM-3 OT-I cells in tdLN and spleen (n = 6 for sgNTC and n = 7 for sgRbpj). The same sgNTC OT-I cells are presented in Extended Data Fig. 3g (f). Flow cytometry analysis of intratumoral Tpex and Tex OT-I cells on day 7 after adoptive transfer (dual-colour transfer system) (g). h, Relative frequencies and numbers of total intratumoral OT-I cells and their Tpex and Tex cell subsets (dual-colour transfer system) on day 21 after adoptive transfer (n = 5 for sgNTC and n = 7 for sgRbpj). The same sgNTC OT-I cells are presented in Extended Data Fig. 3d, e. i, Relative frequencies of active caspase-3+ cells among intratumoral OT-I cells and their Tpex and Tex cell subsets (dual-colour transfer system) on day 7 after adoptive transfer (n = 7 for sgNTC and n = 10 for sgRbpj). j, Relative frequencies of Ki67+ (n = 5 for sgNTC and n = 7 for sgRbpj; left) and BrdU+ (n = 5 per group; right) cells among indicated intratumoral OT-I cell populations (dual-colour transfer system) on day 21 after adoptive transfer. The same sgNTC OT-I cells are presented in Extended Data Fig. 3q. k, Frequencies and numbers of Tpex and Tex OT-I cells after adoptive transfer to B16-OVA tumour-bearing mice (single-colour transfer system) (n = 6 for sgNTC and n = 4 for sgRbpj). Data are representative of two (c,k), three (dg,i) or one (h,j) independent experiments. NS, not significant; *P < 0.05, **P < 0.01, and ***P < 0.001; two-tailed Kolmogorov–Smirnov test (b), two-tailed unpaired Student’s t-test (df,hk). Data are presented as the mean ± s.e.m. Source Data
Extended Data Fig. 7
Extended Data Fig. 7. RBPJ is expressed by and mainly functions in Tex cells.
a, b, UMAP plots of CD8+ T cells from B16 melanoma (a) or MC38 (b) tumour. The Tpex and Tex cell subsets and distribution of Rbpj expression are indicated. c,d, UMAP plots showing Havcr2 and Rbpj expression in CD8+ T cells from GEMMs of breast cancer (c) and lung adenocarcinoma (d). eg, Schematic for Tpex-like and Tex-like cell generation in vitro (e). TIM-3 and Ly108 expression on freshly-isolated naive (CD62L+CD44) CD8+ T cells (n = 2) from spleen or in vitro-derived Tpex-like (n = 6) and Tex-like (n = 6) cells (f). Immunoblot analysis of RBPJ protein expression in Tpex-like or Tex-like cells. The numbers show abundance of RBPJ (normalized to β-Actin) relative to that of Tpex-like cells (g). h,i, Diagram of Tpex or Tex cell secondary transfer assays (h). Numbers of total intratumoral OT-I cells or their Tpex and Tex cell subsets in the Tpex cell secondary transfer assay (n = 7 per group; i). Data are representative of three (f,i) or two (g) independent experiments. NS, not significant; ***P < 0.001; two-tailed unpaired Student’s t-test (f) or two-tailed paired Student’s t-test (i). Data are presented as the mean ± s.e.m. Source Data
Extended Data Fig. 8
Extended Data Fig. 8. RBPJ negatively correlates with immunotherapies in human cancers and suppresses antitumour immunity.
a, RBPJ expression in human CD8+ T cells from peripheral blood (blood), tumour-adjacent normal tissues (normal), and tumour tissues. b, HAVCR2, TCF7 and RBPJ expression in TCF7+HAVCR2 and TCF7HAVCR2+ cells of human CD8+ T cells from individuals with melanoma or hepatocellular carcinoma (HCC). c, UMAP plot showing cluster analysis (naive-like, transitional and dysfunctional cells) and lineage trajectory of human intratumoral CD8+ T cells from individuals with melanoma. The pseudotime of the three clusters along the developmental trajectory is also shown. d, Relative expression of Tcf7, Pdcd1, Tox and Rbpj in tumour-specific CD8+ T cells from a GEMM of liver cancer at days 5 to 60 after tumour induction. e, Correlation matrix displaying the expression of RBPJ and genes associated with responsiveness to anti-PD-1 therapy. Kendall rank order correlations are displayed from blue to red. Genes positively (+; orange) or negatively (−; green) associated with response to anti-PD-1 blockade are indicated. f, Differentially expressed genes in MANA-specific T cells (derived from patients with NSCLC) with major pathologic response (MPR) compared to those without MPR (non-MPR). g, RBPJ expression in human CD8+ T cell subsets (memory (mem), exhausted (ex) and activated (act)) from patients with BCC or SCC pre- and post-anti-PD-1 treatments. See also Extended Data Fig. 5k. h, Expression of TOX, RBPJ, HAVCR2, ENTPD1, IFNG and GZMB from a public bulk RNA-seq dataset of human CAR T cells at days 0, 16 and 28 after continuous antigen exposure (CAE) in vitro. The boxes stand for 25% to 75% interquartile range (IQR), and the whiskers stand for minimum (25% quantile – 1.5* IQR) to maximum (75% quantile + 1.5* IQR) values, and n = 4 biologically independent samples examined over one independent experiment. i, UMAP plots showing the expression of HAVCR2, LAYN, RBPJ and SOX4 in human CAR T cells at day 28 after CAE. j. Differentially accessible chromatin regions between days 0 and 28 after CAE, with selective genes showing altered accessibility labeled. k, GSEA enrichment of CD8+ effector T cell-associated signatures in sgRbpj compared with sgNTC OT-I cells (from scRNA-seq profiling shown in Fig. 4i). l, Relative frequencies of GZMB+ and IFNγ+ intratumoral OT-I cells (dual-colour transfer system, isolated on day 7 after adoptive transfer) after cognate antigen stimulation (n = 7 per group). m, Relative frequencies and numbers of GZMB+ and IFNγ+ intratumoral OT-I cells (dual-colour transfer system, isolated on day 7 after adoptive transfer) after PMA + Iono stimulation (n = 6 for sgNTC and n = 7 for sgRbpj). n,o, Relative frequencies and numbers of GZMB+ and IFNγ+ intratumoral OT-I cells (dual-colour transfer system, isolated on day 21 after adoptive transfer) after cognate antigen (n; n = 5 for sgNTC and n = 7 for sgRbpj) or PMA + Iono stimulation (o; n = 5 for sgNTC and n = 7 for sgRbpj). p, Relative expression of perforin (n = 7 for sgNTC and n = 10 for sgRbpj), RUNX3 (n = 7 for sgNTC and n = 10 for sgRbpj), T-bet (n = 7 for sgNTC and n = 10 for sgRbpj), BATF (n = 6 for sgNTC and n = 7 for sgRbpj), CXCR6 (n = 7 for sgNTC and n = 10 for sgRbpj), and CX3CR1 (n = 7 for sgNTC and n = 10 for sgRbpj) in total intratumoral OT-I cells (dual-colour transfer system). q, Expression of Prf1, Gzmb and Gzmk in Tpex and Tex cell subsets of intratumoral sgNTC and sgRbpj OT-I cells (as profiled by scRNA-seq in Fig. 4i). r, Survival analysis of B16-OVA tumour-bearing mice given sgNTC (n = 5) or sgRbpj (n = 8) OT-I cells. No cell transfer (n = 5). s, E.G7-OVA tumour growth in mice that received sgNTC (n = 8) or sgRbpj (n = 8) OT-I cells. No cell transfer (n = 4). The same sgNTC OT-I cells are presented in Extended Data Fig. 5d. t, LLC-OVA tumour growth in mice given sgNTC (n = 9) or sgRbpj (n = 10) OT-I cells. No cell transfer (n = 4). The same sgNTC OT-I cells are presented in Extended Data Fig. 5d. u,v, sgNTC (n = 6) or sgRbpj (n = 8)-transduced OT-I cells were transferred (single-colour transfer system) to E.G7-OVA tumour-bearing mice and analyzed seven days later. Number of total intratumoral OT-I cells (u). Frequencies and numbers of Tpex and Tex OT-I cells (v). The same sgNTC OT-I cells are presented in Extended Data Fig. 5e, f. w,x, sgNTC (n = 5) or sgRbpj (n = 6) OT-I cells were transferred to LLC-OVA tumour-bearing mice (single-colour transfer system) and analyzed seven days later. Number of total intratumoral OT-I cells (w). Frequencies and numbers of Tpex and Tex OT-I cells (x). The same sgNTC OT-I cells are presented in Extended Data Fig. 5g, h. Data are representative of three (l,m,p,r), one (n,o,ux) or two (s,t) independent experiments. NS, not significant; *P < 0.05; **P < 0.01 and ***P < 0.001; two-tailed Wilcoxon rank sum test (a,b,g,q), two-tailed Wald test (h), two-tailed Kolmogorov–Smirnov test (k), two-tailed unpaired Student’s t-test (lp,ux), log-rank (Mantel-Cox) test (r) or two-way ANOVA (s,t). Data are presented as the mean ± s.e.m. Source Data
Extended Data Fig. 9
Extended Data Fig. 9. RBPJ acts independently of NOTCH1/2 and is repressed by BACH2.
a, Expression of Notch1 and Notch2 in Tpex and Tex cell subsets among sgNTC or sgRbpj OT-I cells (from scRNA-seq profiling shown in Fig. 4i). be, Relative frequencies of Tpex (Ly108+TIM-3 (b) or TCF-1+TIM-3 (c)) and Tex (Ly108TIM-3+ (b) or TCF-1TIM-3+ (c)) cells among sgNTC or sgNotch1/2 intratumoral OT-I cells (dual-colour transfer system). Relative frequencies of Ki67+ cells among indicated intratumoral OT-I populations (d). Relative frequencies of GZMB+ and IFNγ+ intratumoral OT-I cells (e) (n = 10 per group). f, GSEA enrichment plots showing no enrichment of KEGG NOTCH signature in sgRbpj compared with sgNTC Tpex cells or sgRbpj compared with sgNTC Tex cells (from scRNA-seq profiling shown in Fig. 4i). g, Differential chromatin accessibility profiles of Tex compared with Tpex cells from B16-OVA tumours. Upregulated (red) chromatin accessibility regions of Rbpj are labeled. h, Enrichment of transcriptional regulators in regions of the Rbpj locus (see Methods). i, Rbpj expression in sgBach2, sgRunx1, sgRunx2 or sgJun OT-I cells compared with OT-I cells transduced with sgNTC and other sgRNAs (sgRNAs for all the other perturbations combined) in scCRISPR screening. j, Relative expression of Rbpj in Tpex and Tex cell subsets of Cas9-expressing OT-I cells transduced with sgBach2, sgNTC and other sgRNAs (sgRNAs for all the other perturbations combined) from scCRISPR screening. k, Relative expression of Rbpj in indicated cell states (from scRNA-seq profiling sgNTC cells shown in Fig. 4i). l, RBPJ expression in indicated sgBach2 (n = 9)-transduced intratumoral OT-I cell populations (dual-colour transfer system). m, Rbpj expression in wild-type (WT) or Bach2-deficient (Bach2 KO) naive CD8+ T cells after 0, 8 and 16 h after TCR stimulation. The boxes stand for 25% to 75% interquartile range (IQR), and the whiskers stand for minimum (25% quantile – 1.5* IQR) to maximum (75% quantile + 1.5* IQR) values. n, Rbpj expression in control and Bach2 overexpressing (OE) CD8+ T cells. o, Differential chromatin accessibility in Bach2 OE CD8+ T cells compared with control CD8+ T cells. Downregulated (blue) chromatin accessibility regions in the Rbpj locus are labeled. Data are representative of two (be) or three (l) independent experiments. NS, not significant; two-tailed Wilcoxon sum-rank test (a,i,n), two-tailed unpaired Student’s t-test (be,l) or two-tailed moderated t-test (m). Data are presented as the mean ± s.e.m. Source Data
Extended Data Fig. 10
Extended Data Fig. 10. RBPJ–IRF1 axis impinges upon Tex cell accumulation.
ac, Principal component analysis (PCA) plot showing chromatin alterations in sgNTC (n = 3) and sgRbpj (n = 3) Tpex and Tex intratumoral OT-I cells (dual-colour transfer system), with the percentage of variance shown (a). Peak set enrichment analysis of effector-function-related pathways in Tpex and Tex cell subsets (b). Relative intensity of differentially accessible peaks in Rbpj-deficient compared with control Tex cells (Tpex peak intensity profiles are shown as reference). Selective genes associated with effector function that display enhanced chromatin accessibility in Rbpj-deficient Tex cells are labeled (c). d, e, Sectored scatter plot of gene-level log2FC from sgNTC and sgRbpj OT-I cells in genetic interaction screening. The tumour compared with spleen, tumour Tex cells compared with input, and Tex compared with Tpex cell are shown. Rbpj and Irf1 are labeled as described in the text (d). Venn diagram showing the number of overlapping candidates from genetic interaction screening with the indicated comparisons (e). f, OCRs upregulated in sgRbpj compared with sgNTC Tex OT-I cells were analyzed for IRF1 binding motif (V_IRF1_06, from TRANSFAC database), followed by mapping to the nearest genes. Functional enrichment analysis of CD8+ T cell effector-function-associated pathways of these genes. g, Relative number of Tex cells (dual-colour transfer system) (n = 5 per group). h, PCA plot showing transcriptome changes in sgNTC (n = 4; co-transferred cells from the sgIrf1 group), sgRbpj (n = 4), sgIrf1 (n = 4), and sgRbpj with sgIrf1 (n = 3) intratumoral OT-I cells (dual-colour transfer system), with the percentage of variance shown. i, GSEA enrichment plot showing downregulated cell-cycle-associated and effector-function-associated signatures in sgRbpj with sgIrf1 OT-I cells compared with sgRbpj OT-I cells (from microarray shown in h). j, B16-OVA tumour growth in mice that received indicated sgRNA-transduced OT-I cells (n = 7 per group). No cell transfer group (n = 4). k, Schematic of in vivo scCRISPR screening and co-functional modules orchestrating heterogeneity and differentiation of intratumoral CTLs. Co-functional modules coordinately regulate gene expression programmes underlying the CTL differentiation trajectory. This trajectory is characterized by a progressive loss of stemness, and an increase in metabolism and proliferative capacity in Tpex2 and Tex1 cells, which are decreased in Tex2 cells. IKAROS (from TF M3) and ETS1 (from TF M7) reciprocally regulate the transition from Tpex to intermediate Tex1 cells, which requires quiescence exit of Tpex cells. Moreover, NOTCH-independent RBPJ (from TF M8)–IRF1 axis mediates Tex1 to Tex2 cell differentiation, associated with reduced proliferation (dotted line marks possible Tpex to Tex2 cell generation that may also arise). Data are representative of two (g) or one (j) independent experiments. NS, not significant; *P < 0.05, **P < 0.01, and ***P < 0.001; two-tailed Fisher’s exact test (b,f), one-way ANOVA (g) or two-way ANOVA (j). Data are presented as the mean ± s.e.m. Source Data

References

    1. McLane LM, Abdel-Hakeem MS, Wherry EJ. CD8 T cell exhaustion during chronic viral infection and cancer. Annu. Rev. Immunol. 2019;37:457–495. doi: 10.1146/annurev-immunol-041015-055318. - DOI - PubMed
    1. Philip M, Schietinger A. CD8+ T cell differentiation and dysfunction in cancer. Nat. Rev. Immunol. 2022;22:209–223. doi: 10.1038/s41577-021-00574-3. - DOI - PMC - PubMed
    1. Im SJ, et al. Defining CD8+ T cells that provide the proliferative burst after PD-1 therapy. Nature. 2016;537:417–421. doi: 10.1038/nature19330. - DOI - PMC - PubMed
    1. He R, et al. Follicular CXCR5-expressing CD8+ T cells curtail chronic viral infection. Nature. 2016;537:412–428. doi: 10.1038/nature19317. - DOI - PubMed
    1. Miller BC, et al. Subsets of exhausted CD8+ T cells differentially mediate tumor control and respond to checkpoint blockade. Nat. Immunol. 2019;20:326–336. doi: 10.1038/s41590-019-0312-6. - DOI - PMC - PubMed

Publication types

MeSH terms