. 2023 Nov 15;13(1):19960.
doi: 10.1038/s41598-023-46253-2.

Predicting glaucoma progression using deep learning framework guided by generative algorithm

Affiliations

Predicting glaucoma progression using deep learning framework guided by generative algorithm

Shaista Hussain et al. Sci Rep. .

Abstract

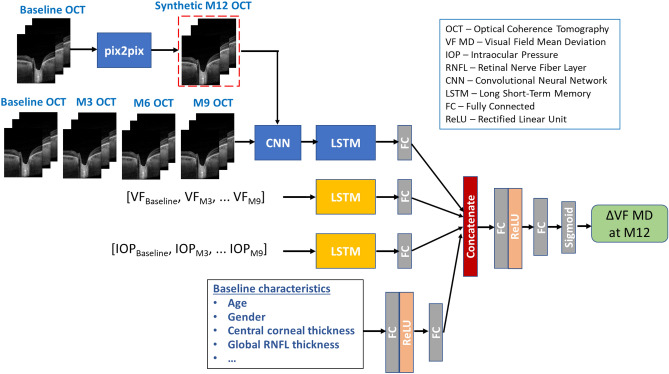
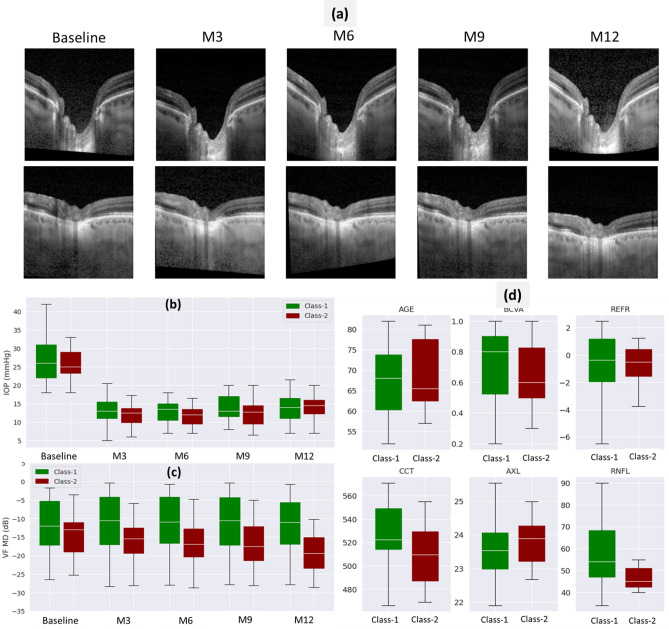
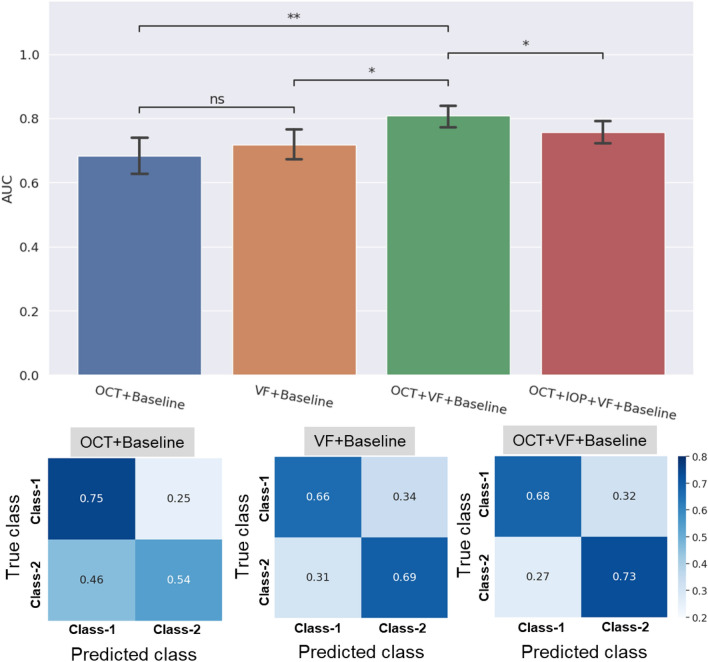
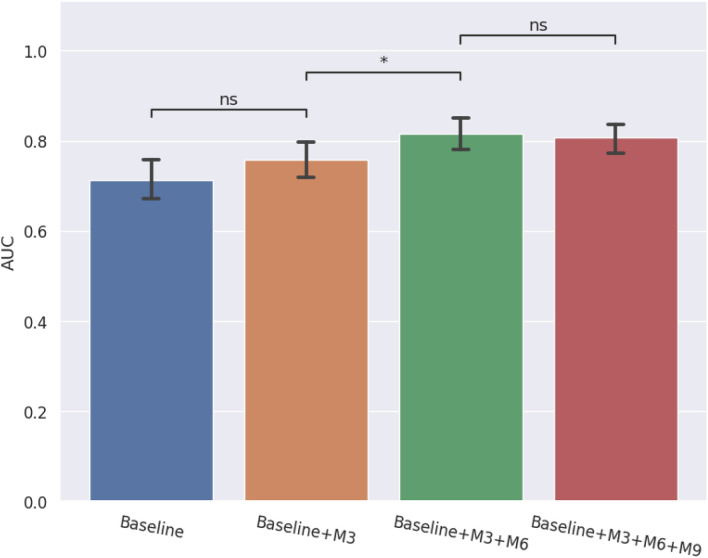
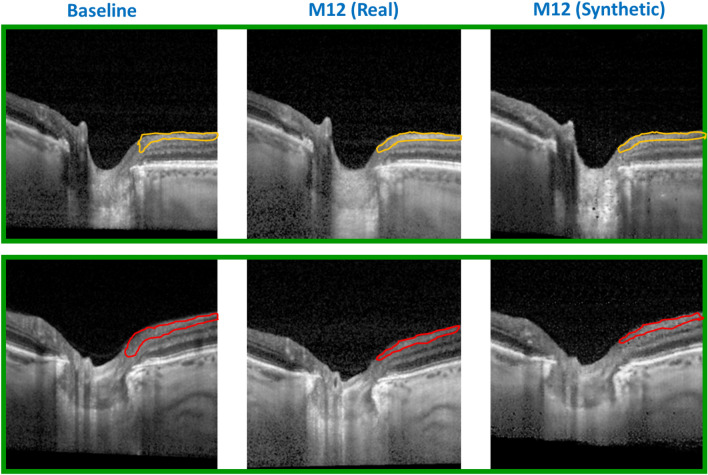
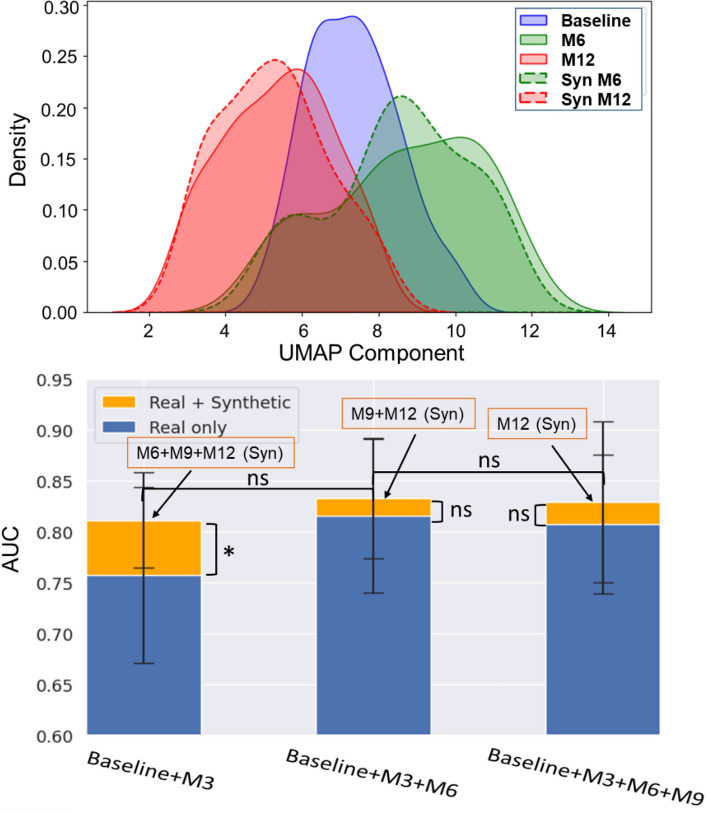
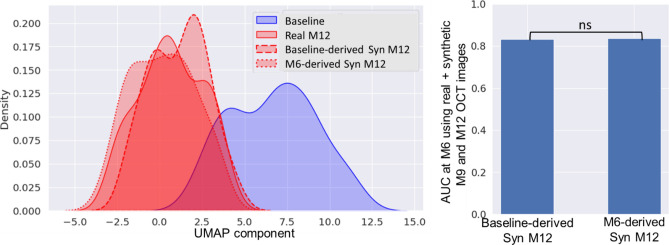
Glaucoma is a slowly progressing optic neuropathy that may eventually lead to blindness. To help patients receive customized treatment, predicting how quickly the disease will progress is important. Structural assessment using optical coherence tomography (OCT) can be used to visualize glaucomatous optic nerve and retinal damage, while functional visual field (VF) tests can be used to measure the extent of vision loss. However, VF testing is patient-dependent and highly inconsistent, making it difficult to track glaucoma progression. In this work, we developed a multimodal deep learning model comprising a convolutional neural network (CNN) and a long short-term memory (LSTM) network, for glaucoma progression prediction. We used OCT images, VF values, demographic and clinical data of 86 glaucoma patients with five visits over 12 months. The proposed method was used to predict VF changes 12 months after the first visit by combining past multimodal inputs with synthesized future images generated using generative adversarial network (GAN). The patients were classified into two classes based on their VF mean deviation (MD) decline: slow progressors (< 3 dB) and fast progressors (> 3 dB). We showed that our generative model-based novel approach can achieve the best AUC of 0.83 for predicting the progression 6 months earlier. Further, the use of synthetic future images enabled the model to accurately predict the vision loss even earlier (9 months earlier) with an AUC of 0.81, compared to using only structural (AUC = 0.68) or only functional measures (AUC = 0.72). This study provides valuable insights into the potential of using synthetic follow-up OCT images for early detection of glaucoma progression.


Conflict of interest statement

The authors declare no competing interests.

Figures

Figure 1
Figure 1
Progression prediction framework using OCT images, VF MD values, IOP and patient baseline characteristics to predict the slow vs fast progression of glaucoma patients 12 months (M12) after the baseline visit. The framework comprises CNN (ResNet-34) for feature extraction from OCT images, LSTM models to learn the temporal relationships within longitudinal inputs and pix2pix GAN for generating the M12 images using baseline images.
Figure 2
Figure 2
Multimodal longitudinal (ac) and baseline inputs (d) used for training the progression prediction model. (a) Examples of OCT images used for glaucoma progression prediction task. Each row corresponds to OCT B-scans of a patient at the five visit times (Baseline and M3-M12) over 12 months. (b) The IOP distributions at baseline and M3–M12 visit times for two glaucoma classes used in this work, where Class-1 (green) refers to slow progressing cases (∆VF > − 3 dB) and Class-2 (red) refers to fast progressing cases (∆VF < − 3 dB). (c) VF MD distributions for Class-1 and Class-2 patients at the five visit times. (d) Distributions of baseline demographic and clinical features—age (years), best-corrected visual acuity (BCVA in decimal scale), refractive error (REFR in D), central corneal thickness (CCT in µm), axial eye length (AXL in mm), retinal nerve fiber layer (RNFL in µm) thickness of patients belonging to Class-1 and Class-2 progressing classes.
Figure 3
Figure 3
Top panel shows the prediction AUCs obtained when baseline demographic and clinical data is used with only OCT images (blue), only VF MD values (orange), combined OCT and VF MD inputs (green), and OCT images combined with VF MD and longitudinal IOP values (red). Statistical annotations are as follows: **P value < 0.01, *P value < 0.05 and ns denotes “not statistically significant”. Confusion matrices shown in the bottom panel for three input combinations to the progression model suggest that the “OCT + VF + Baseline” input combination performs well for both Class-1 and Class-2 patients, correctly predicting 73% of the fast progressing cases (Class-2).
Figure 4
Figure 4
AUC for progression prediction by utilizing multimodal inputs comprising baseline patient inputs, OCT images and VF MD values at different time-points of patient visits from baseline (blue) until M3 (orange), M6 (green) and M9 (red). Statistical annotations are as follows: *P value < 0.05 and ns denotes “not statistically significant”.
Figure 5
Figure 5
Real and pix2pix GAN based synthesized OCT B-scans of two patients (rows) showing baseline (left), real M12 (center) and synthetic M12 (right) B-scans. The RNFL thinning in a slow progressing case (top row) and a fast progressing case (bottom row) is demarcated by orange and red coloured outlines respectively. The thinning of RNFL as shown from the baseline to M12 images is also captured well by the synthetic M12 images.
Figure 6
Figure 6
Probability density distribution for OCT image features (top panel) corresponding to baseline (blue), real and synthetic M6 images (green) and real and synthetic M12 images (red). AUCs obtained without (blue bars) and with (orange bars) synthetic OCT images (bottom panel). * indicates P value < 0.05 and ns denotes “not statistically significant”.
Figure 7
Figure 7
Real and synthetic OCT image feature distributions (left) showing that M12 images synthesized using baseline images (dashed red) and M6 images (dotted red) have similar distributions, which are significantly different from baseline image distribution (blue). The AUCs obtained using synthetic images derived from baseline and M6 images are similar (right). ns denotes “not statistically significant”.

References

    1. Bourne R, et al. Causes of vision loss worldwide, 1990–2010: A systematic analysis. Lancet Glob. Health. 2013;1:1. doi: 10.1016/S2214-109X(13)70113-X. - DOI - PubMed
    1. Jonas JB, et al. Glaucoma. Lancet. 2017;390:2183–2193. doi: 10.1016/S0140-6736(17)31469-1. - DOI - PubMed
    1. Tham Y-C, et al. Global prevalence of glaucoma and projections of glaucoma burden through 2040: A systematic review and meta-analysis. Ophthalmology. 2014;121:2081–2090. doi: 10.1016/j.ophtha.2014.05.013. - DOI - PubMed
    1. Lucy KA, Wollstein G. Structural and functional evaluations for the early detection of glaucoma. Expert Rev. Ophthalmol. 2016;11:367–376. doi: 10.1080/17469899.2016.1229599. - DOI - PMC - PubMed
    1. Tatham AJ, Medeiros FA. Detecting structural progression in glaucoma with optical coherence tomography. Ophthalmology. 2017;124:S57–S65. doi: 10.1016/j.ophtha.2017.07.015. - DOI - PMC - PubMed

Publication types