. 2024 Apr;241(4):687-698.
doi: 10.1007/s00213-023-06492-7. Epub 2023 Nov 16.

Liraglutide ameliorates delirium-like behaviors of aged mice undergoing cardiac surgery by mitigating microglia activation via promoting mitophagy

Affiliations

Liraglutide ameliorates delirium-like behaviors of aged mice undergoing cardiac surgery by mitigating microglia activation via promoting mitophagy

Min Jia et al. Psychopharmacology (Berl). 2024 Apr.

Erratum in

Abstract

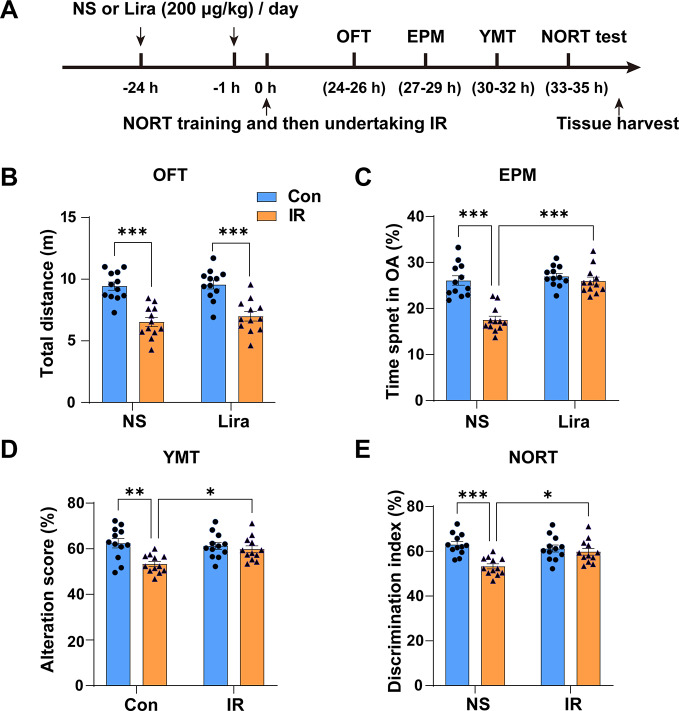
Objective: Postoperative delirium (POD) is a prevalent complication in cardiac surgery patients, particularly the elderly, with neuroinflammation posited as a crucial contributing factor. We investigated the prophylactic effects of liraglutide, a GLP-1 analog, on delirium-like behaviors in aged mice undergoing cardiac surgery and explored the underlying mechanisms focusing on neuroinflammation, mitochondrial dysfunction, and synaptic plasticity.

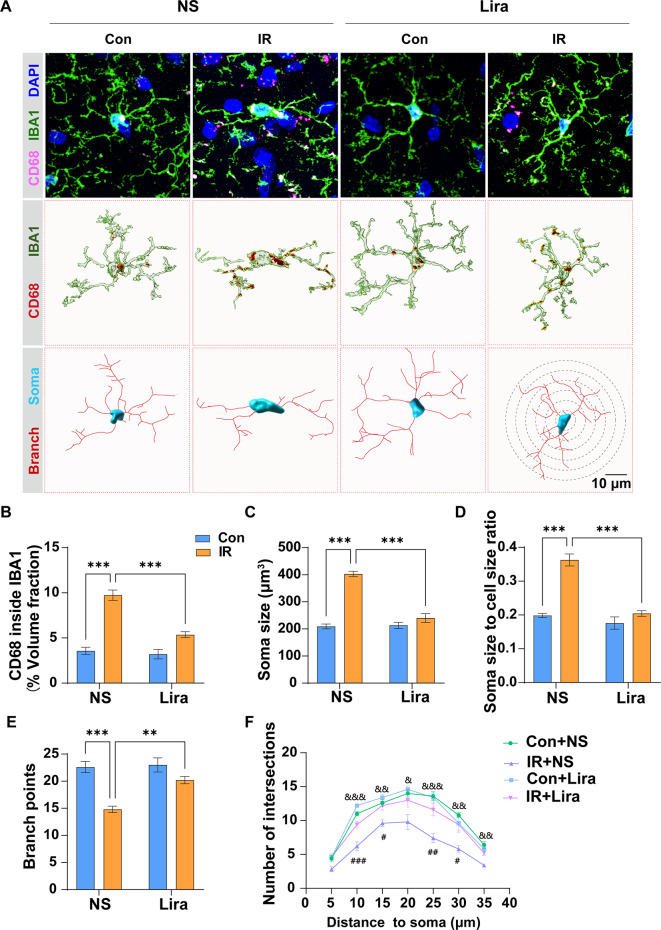
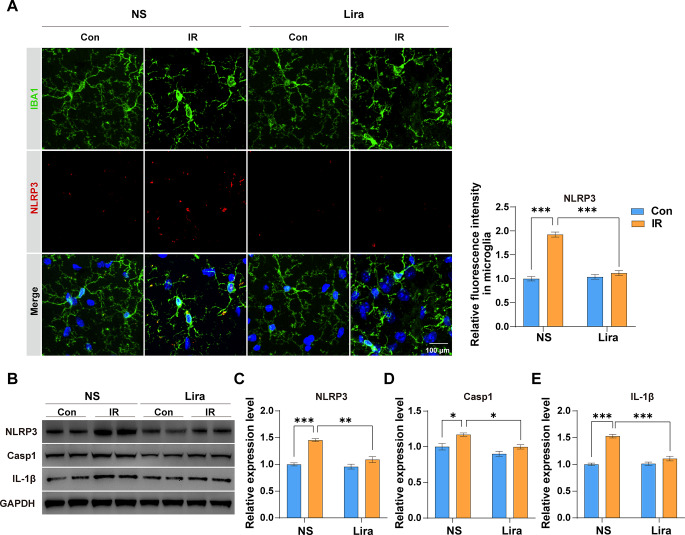
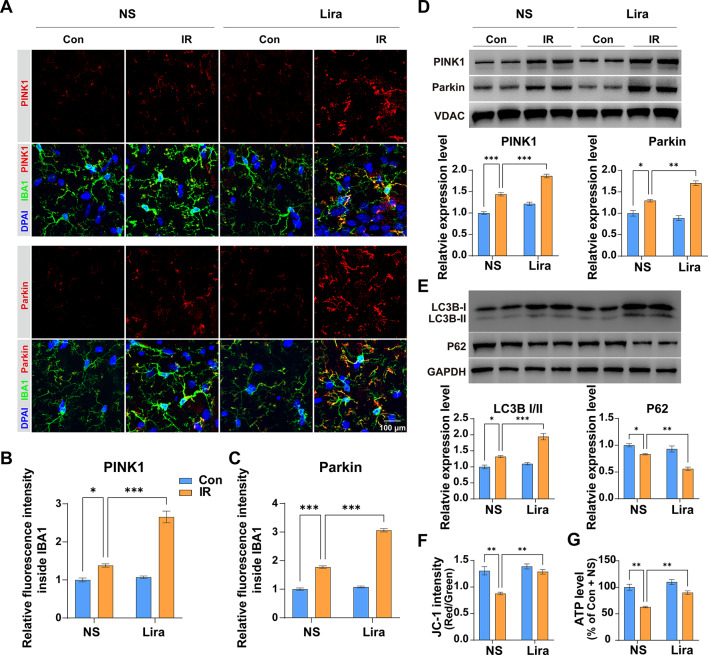
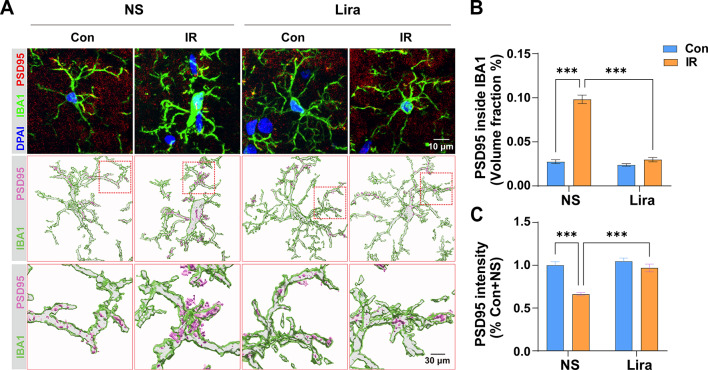
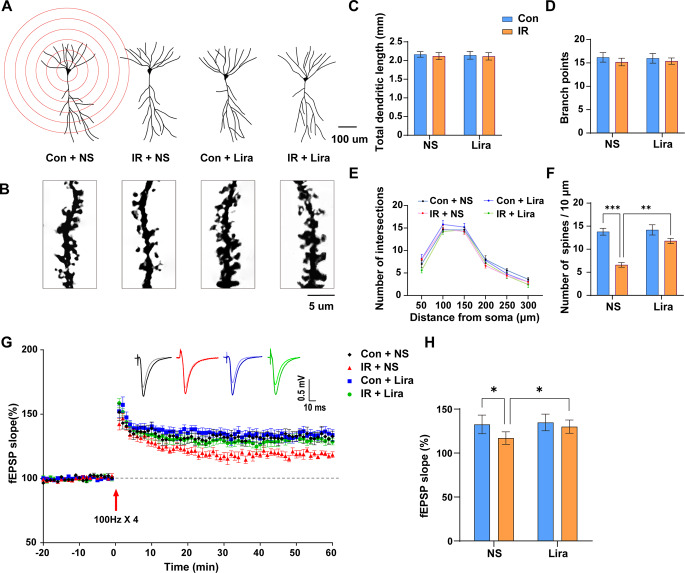
Methods: Using a cardiac ischemia-reperfusion animal model to mimic cardiac surgery, we assessed delirium-like behaviors, microglial activation, NLRP3 inflammasome activation, mitophagy, synaptic engulfment, and synaptic plasticity.

Results: Cardiac surgery triggered delirium-like behaviors, concomitant with heightened microglial and NLRP3 inflammasome activation and impaired mitochondrial function and synaptic plasticity. Pretreatment with liraglutide ameliorated these adverse outcomes. Mechanistically, liraglutide enhanced mitophagy, thereby inhibiting NLRP3 inflammasome activation and subsequent microglial activation. Furthermore, liraglutide counteracted surgery-induced synaptic loss and impairment of synaptic plasticity.

Conclusion: Liraglutide exerts protective effects against delirium-like behaviors in aged mice post-cardiac surgery, potentially through bolstering microglia mitophagy, curtailing neuroinflammation, and preserving synaptic integrity. This highlights the potential of liraglutide as a promising perioperative strategy for delirium prevention in cardiac surgery patients.

Keywords: Cardiac surgery; Liraglutide; Microglia mitophagy; Postoperative delirium; Synaptic plasticity.


Conflict of interest statement

There were no conflicts of interest to declare.

Figures

Fig. 1
Fig. 1
Liraglutide mitigates delirium-like behaviors in aged mice post cardiac surgery. (A) Experiment procedure for the study. B Total distance in the Open Field Test (OFT) assessing motion ability across groups. Two-way ANOVA: Interaction, F (1,44) = 0.2303, P = 0.6337; Row Factor, F (1,44) = 0.6628, P = 0.42; Column Factor, F (1,44) = 56.98, P < 0.0001. C Percentage of time spent in the open arm (OA) in the Elevated Plus Maze (EPM) measuring anxiety-like behaviors across groups. Two-way ANOVA: Interaction, F (1,44) = 19.96, P < 0.0001; Row Factor, F (1,44) = 30.69, P < 0.0001; Column Factor, F (1,44) = 32.32, P < 0.0001. D, E Alteration score in the Y Maze Test (YMT) (D) and discrimination index in the Novel Objective Recognition Test (NORT) (E) evaluating memory ability across groups. Two-way ANOVA: For D, Interaction, F (1,44) = 5.821, P = 0.0201; Row Factor, F (1,44) = 2.758, P = 0.1039; Column Factor, F (1,44) = 10.92, P = 0.0019; For E, Interaction, F (1,44) = 8.749, P = 0.005; Row Factor, F (1,44) = 2.839, P = 0.0991; Column Factor, F (1,44) = 15.80, P = 0.0003. Data are expressed as mean ± SEM (n = 12). *P < 0.05, **P < 0.01, ***P < 0.001
Fig. 2
Fig. 2
Liraglutide suppresses microglial activation triggered by cardiac surgery. (A) Representative immunofluorescence (IF) images of IBA1-positive microglia and their 3D reconstruction using Imaris. B–F Analysis and quantification of microglial activation and morphological parameters, including volume fraction of CD68 to IBA1 (B), soma volume (C), soma size to cell size ratio (D), branch points (E), and the number of intersections (F). Two-way ANOVA: For B, Interaction, F (1,16) = 18.65, P = 0.0005, Row Factor, F (1,16) = 25.97, P = 0.0001; Column Factor, F (1,16) = 80.11, P < 0.0001; For C, Interaction, F (1,16) = 14.93, P = 0.0014, Row Factor, F (1,16) = 23.12, P = 0.0002; Column Factor, F (1,16) = 51.02, P < 0.0001; For D, Interaction, F (1,16) = 7.062, P = 0.0172, Row Factor, F (1,16) = 9.503, P = 0.0071; Column Factor, F (1,16) = 31.74, P < 0.0001; For E, Interaction, F (1,16) = 48.58, P < 0.0001, Row Factor, F (1,16) = 43.82, P < 0.0001; Column Factor, F (1,16) = 84.78, P < 0.0001; One-way ANOVA for F. Data are expressed as mean ± SEM (n = 5). *P < 0.05, **P < 0.01, ***P < 0.001; Con + NS compared with IR + NS, &P < 0.05, &&P < 0.01, &&&P < 0.001; IR + NS compared with IR + Lira, #P < 0.05, ##P < 0.01, ###P < 0.001
Fig. 3
Fig. 3
Liraglutide inhibits NLRP3 inflammasome activation in microglia. (A) Representative IF images of IBA1 and NLRP3 double staining, and the relative fluorescence intensity of NLRP3 in microglia. Two-way ANOVA: Interaction, F (1,16) = 71.84, P < 0.0001, Row Factor, F (1,16) = 59.4, P < 0.0001; Column Factor, F (1,16) = 101.1, P < 0.0001. B Representative western blot (WB) images for NLRP3, Casp1, IL-1β, and GAPDH. C–E Analysis and quantification of the proteins expression level of NLRP3 (C), Casp1 (D) and IL-1β (E). Two-way ANOVA: For C, Interaction, F (1,8) = 15.25, P = 0.0045, Row Factor, F (1, 8) = 24.22, P = 0.0012; Column Factor, F (1, 8) = 51.06, P < 0.0001; For D, Interaction, F (1,8) = 1.128, P = 0.3192, Row Factor, F (1, 8) = 15.46, P = 0.0043; Column Factor, F (1, 8) = 15.13, P = 0.0046; For E, Interaction, F (1,8) = 39.9, P = 0.0002, Row Factor, F (1, 8) = 35.07, P = 0.0004; Column Factor, F (1, 8) = 83.24, P < 0.0001. Data are expressed as mean ± SEM (n = 5 for IF, n = 3 for WB). *P < 0.05, **P < 0.01, ***P < 0.001
Fig. 4
Fig. 4
Liraglutide boosts mitophagy in microglia and enhances mitochondrial function. (A) Representative immunofluorescence images for PINK1 and IBA1, Parkin and IBA1 double staining. B–C Analysis and quantification of PINK1 (B) and Parkin (C) fluorescence intensity in microglia. Two-way ANOVA: For B, Interaction, F (1,16) = 49.46, P < 0.0001, Row Factor, F (1, 16) = 61.92, P < 0.0001; Column Factor, F (1, 16) = 131.8, P < 0.0001; For C, Interaction, F (1,16) = 170.9, P < 0.0001, Row Factor, F (1, 16) = 218.3, P < 0.0001; Column Factor, F (1, 16) = 890, P < 0.0001. D Analysis and quantification of the proteins expression level of PINK1 and Parkin in separated mitochondria. Two-way ANOVA: For PINK1, Interaction, F (1, 8) = 7.771, P = 0.0236, Row Factor, F (1, 8) = 70.74, P < 0.0001; Column Factor, F (1, 8) = 200.5, P < 0.0001;: For Parkin, Interaction, F (1, 8) = 23.11, P = 0.0013, Row Factor, F (1, 8) = 7.348, P = 0.0266; Column Factor, F (1, 8) = 105, P < 0.0001. E Analysis and quantification of the proteins expression level of LC3B II/I and P62 in the hippocampus. Two-way ANOVA: For LC3B II/I, Interaction, F (1, 8) = 17.33, P = 0.0032, Row Factor, F (1, 8) = 32.5, P = 0.0005; Column Factor, F (1, 8) = 85.53, P < 0.0001; For P62, Interaction, F (1, 8) = 7.916, P = 0.0227, Row Factor, F (1, 8) = 22.09, P = 0.0015; Column Factor, F (1, 8) = 54.47, P < 0.0001. F Assessment of mitochondrial membrane potentiation using JC-1 staining. Two-way ANOVA, Interaction, F (1, 8) = 9.864, P = 0.0138, Row Factor, F (1, 8) = 22.25, P = 0.0015; Column Factor, F (1, 8) = 25.66, P < 0.0001. (G) Assessment ATP level of hippocampus. Two-way ANOVA, Interaction, F (1, 8) = 4.219, P = 0.074, Row Factor, F (1, 8) = 19.91, P = 0.0021; Column Factor, F (1, 8) = 47.68, P = 0.0001. Data are expressed as mean ± SEM (n = 5 for IF, n = 3 for WB, JC-1 staining and ATP assay). *P < 0.05, **P < 0.01, ***P < 0.001
Fig. 5
Fig. 5
Liraglutide mitigates microglial engulfment of synapses. (A) Representative immunofluorescence images for IBA1 and PSD95 double staining and the 3D reconstructions using Imaris. (B) Quantification of volume fraction of PSD95 to IBA1. Two-way ANOVA, Interaction, F (1, 16) = 115.1, P < 0.0001, Row Factor, F (1, 16) = 141.8, P < 0.0001; Column Factor, F (1, 16) = 161.5, P < 0.0001. (C) Quantification of PSD95 fluorescence intensity. Two-way ANOVA, Interaction, F (1, 16) = 12.47, P = 0.0028, Row Factor, F (1, 16) = 23.02, P = 0.0002; Column Factor, F (1, 16) = 31.67, P < 0.0001. Data are expressed as mean ± SEM (n = 5). *P < 0.05, **P < 0.001
Fig. 6
Fig. 6
Liraglutide reverses cardiac surgery-induced synaptic plasticity impairments. (A) Representative images of hippocampal neuronal tracings and sholl analysis. (B) Representative images of apical dendritic spines. (C–F) Analysis and quantification of dendritic length (C), number of branch points (D), intersections (E) and spines (F). Two-way ANOVA: For F, Interaction, F (1, 16) = 9.681, P = 0.0067, Row Factor, F (1, 16) = 13.18, P = 0.0023; Column Factor, F (1, 16) = 38.72, P < 0.0001. (G) Long-term potentiation (LTP) induced by 4 trains of 100 Hz tetanic stimulus across groups. (H) Quantification of LTP level across groups. Two-way ANOVA, Interaction, F (1, 23) = 2.587, P = 0.1214, Row Factor, F (1, 23) = 5.169, P = 0.0326; Column Factor, F (1, 23) = 9.077, P = 0.0062. Data are expressed as mean ± SEM (n = 5–7). *P < 0.05, **P < 0.01, ***P < 0.001

References

    1. Alam A, Hana Z, Jin Z, Suen KC, Ma D. Surgery, neuroinflammation and cognitive impairment. EBioMedicine. 2018;37:547–556. doi: 10.1016/j.ebiom.2018.10.021. - DOI - PMC - PubMed
    1. An JR, Liu JT, Gao XM, Wang QF, Sun GY, Su JN, Zhang C, Yu JX, Yang YF, Shi Y. Effects of liraglutide on astrocyte polarization and neuroinflammation in db/db mice: focus on iron overload and oxidative stress. Front Cell Neurosci. 2023;17:1136070. doi: 10.3389/fncel.2023.1136070. - DOI - PMC - PubMed
    1. Awasthi S, Hindle A, Sawant NA, George M, Vijayan M, Kshirsagar S, Morton H, Bunquin LE, Palade PT, Lawrence JJ, Khan H, Bose C, Reddy PH, Singh SP (2021) RALBP1 in Oxidative Stress and Mitochondrial Dysfunction in Alzheimer’s Disease. Cells 10. - PMC - PubMed
    1. Bin Ibrahim MZ, Benoy A, Sajikumar S. Long-term plasticity in the hippocampus: maintaining within and ‘tagging’ between synapses. Febs j. 2022;289:2176–2201. doi: 10.1111/febs.16065. - DOI - PubMed
    1. Calabrese B, Wilson MS, Halpain S. Development and regulation of dendritic spine synapses. Physiol (Bethesda) 2006;21:38–47. - PubMed

Substances