. 2023 Dec;17(6):1591-1607.
doi: 10.1007/s11571-022-09915-x. Epub 2022 Dec 7.

Seizure onset zone identification using phase-amplitude coupling and multiple machine learning approaches for interictal electrocorticogram

Affiliations

Seizure onset zone identification using phase-amplitude coupling and multiple machine learning approaches for interictal electrocorticogram

Yao Miao et al. Cogn Neurodyn. 2023 Dec.

Abstract

Automatic seizure onset zone (SOZ) localization using interictal electrocorticogram (ECoG) improves the diagnosis and treatment of patients with medically refractory epilepsy. This study aimed to investigate the characteristics of phase-amplitude coupling (PAC) extracted from interictal ECoG and the feasibility of PAC serving as a promising biomarker for SOZ identification. We employed the mean vector length modulation index approach on the 20-s ECoG window to calculate PAC features between low-frequency rhythms (0.5-24 Hz) and high frequency oscillations (HFOs) (80-560 Hz). We used statistical measures to test the significant difference in PAC between the SOZ and non-seizure onset zone (NSOZ). To overcome the drawback of handcraft feature engineering, we established novel machine learning models to learn automatically the characteristics of the obtained PAC features and classify them to identify the SOZ. Besides, to handle imbalanced dataset classification, we introduced novel feature-wise/class-wise re-weighting strategies in conjunction with classifiers. In addition, we proposed a time-series nest cross-validation to provide more accurate and unbiased evaluations for this model. Seven patients with focal cortical dysplasia were included in this study. The experiment results not only showed that a significant coupling at band pairs of slow waves and HFOs exists in the SOZ when compared with the NSOZ, but also indicated the effectiveness of the PAC features and the proposed models in achieving better classification performance .

Keywords: Electrocorticogram (ECoG); Focal cortical dysplasia (FCD); Interictal; Machine learning; Phase-amplitude coupling (PAC).


Figures

Fig. 1
Fig. 1
The work scheme, classifiers, and TSNCV principle. A The work scheme. B1 The example of SVM for simple binary classification in 2-D feature space. B2 The example of leaf-wise tree growth for LightGBM. B3 The architecture of the established 2-D CNN model. The input is the comodulogram with the size of 16×16. There are three convolutional layers and two fully connected layers named Conv_1, Conv_2, and Conv_3, Fc_1, and Fc_2, respectively. MaxPooling is respectively followed by Conv_2 and Conv_3. C The working principle of TSNCV. The dataset is chronologically split into five splits. For each split, there are model selection and model evaluation processes. The training subset, validation set, and test set are denoted by dark blue color, dark orange color, and brown color, respectively, in which the training subset and validation set are selected the former 80% and the latter 20% of the training set
Fig. 2
Fig. 2
The PAC computation process. ECoG, phase, and amplitude are marked by a black line, brown line, and blue line, respectively. ϕpha(0.5-1Hz)(t) and Aamp(80-110Hz)(t) denote the phase time series in the band of 0.5–1 Hz and the amplitude time series in the band of 80–110 Hz, respectively. MI(0.5-1) & (80-110) is the PAC value between the phase in the band of 0.5–1 Hz and the amplitude in the band of 80–110 Hz. In the comodulogram, the x-axis and y-axis denote the frequency of phase and the frequency of amplitude, respectively. The red color indicates a higher value. The region surrounded by a grey rectangle represents the PAC values in the given band pair
Fig. 3
Fig. 3
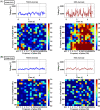
Raw interictal ECoG and comodulogram plots in the SOZ and NSOZ for adult patient Pt2 (sub-figure A) and child patient Pt6 (sub-figure B)
Fig. 4
Fig. 4
The mean comodulogram and the Mann-Whitney U test results at eight band pairs in both SOZ and NSOZ for four adult patients. A The mean comodulogram of SOZ and NSOZ for each adult patient. For each mean comodulogram, the x-axis denotes the frequency of phase, the y-axis indicates the frequency of amplitude, and the pseudocolor represents the PAC value at different band pairs. B The Mann-Whitney U test results of the SOZ and NSOZ for four adult patients at eight band pairs. The median value of each band pair for both SOZ and NSOZ is displayed zoom in the most right sub-figure. The eight band pairs are δ-r, δ-fr, θ-r, θ-fr, α-r, α-fr, β-r, and β-fr, representing δ-ripple, δ-fastripple, θ-ripple, θ-fastripple, α-ripple, α-fastripple, β-ripple, and β-fastripple, respectively, where the frequency range of δ, θ, α, β, ripple, and fastripple is 0.5–4, 4–8, 8–12, 12–24, 80–260, and 260–560 Hz, respectively. The x-axis and y-axis imply types of band pair and PAC values, respectively. The brown and green colors indicate the SOZ and the NSOZ, respectively. indicates p<0.001
Fig. 5
Fig. 5
The mean comodulogram and the Mann-Whitney U test results at eight band pairs in both the SOZ and NSOZ for three child patients. A The mean comodulogram of the SOZ and NSOZ for each child patient. B The Mann-Whitney U test results of SOZ and NSOZ for each child patient at eight band pairs
Fig. 6
Fig. 6
Statistical results between the adult SOZ and child SOZ groups, as well as between the adult NSOZ and child NSOZ groups. The brown, yellow, green, and slate grey colors indicate the adult SOZ, child SOZ, adult NSOZ, and child NSOZ, respectively. implies p<0.001
Fig. 7
Fig. 7
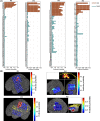
The prediction probability in bar-plot and MRI for four adult patients. A The bar plot of the prediction probability of each electrode for four adult patients. The x-axis and y-axis denote the value of prediction probability and channel name, respectively. The brown color indicates the SOZ electrodes, while green represents the NSOZ electrodes. B The MRI of prediction probability for four adult patients. The pseudo color denotes the value of the prediction probability of each electrode. It is noted that the numbers 1–60 and 61–76 in (B) represent A1–A60 and B1–B16 in (A), respectively. Electrodes surrounded by purple lines denote SOZ electrodes

Similar articles

Cited by

References

    1. Abbasi B, Goldenholz DM. Machine learning applications in epilepsy. Epilepsia. 2019;60:2037–2047. doi: 10.1111/epi.16333. - DOI - PMC - PubMed
    1. Akter MS, Islam MR, Iimura Y, Sugano H, Fukumori K, Wang D, Tanaka T, Cichocki A. Multiband entropy-based feature-extraction method for automatic identification of epileptic focus based on high-frequency components in interictal ieeg. Sci Rep. 2020;10:7044. doi: 10.1038/s41598-020-62967-z. - DOI - PMC - PubMed
    1. Akter MS, Islam MR, Tanaka T, Iimura Y, Mitsuhashi T, Sugano H, Wang D, Molla MKI. Statistical features in high-frequency bands of interictal ieeg work efficiently in identifying the seizure onset zone in patients with focal epilepsy. Entropy (Basel) 2020;22(12):1415. doi: 10.3390/e22121415. - DOI - PMC - PubMed
    1. Allen EA, Liu J, Kiehl KA, Gelernter J, Pearlson GD, Perrone-Bizzozero NI, Calhoun VD. Components of cross-frequency modulation in health and disease. Front Syst Neurosci. 2011;5:59. doi: 10.3389/fnsys.2011.00059. - DOI - PMC - PubMed
    1. Amiri M, Frauscher B, Gotman J. Phase-amplitude coupling is elevated in deep sleep and in the onset zone of focal epileptic seizures. Front Human Neuroence. 2016;10:387. - PMC - PubMed

LinkOut - more resources