. 2023 Oct 13;8(44):41427-41437.
doi: 10.1021/acsomega.3c05159. eCollection 2023 Nov 7.

Virofree Associates with the Modulation of Gut Microbiomes and Alleviation of DSS-Induced IBD Symptoms in Mice

Affiliations

Virofree Associates with the Modulation of Gut Microbiomes and Alleviation of DSS-Induced IBD Symptoms in Mice

Wei-Sheng Lin et al. ACS Omega. .

Abstract

Inflammatory bowel disease (IBD) is a chronic, nonspecific inflammation of the intestines that primarily comprises Crohn's disease and ulcerative colitis. The incidence and prevalence of IBD have been increasing globally, highlighting the significance of research and prophylactic interventions. Virofree, a mixture of various botanical extracts (including grapes, cherries, olive leaves, marigolds, green tea, and others), has shown significant potential in disease prevention. This study examined the effects of Virofree on intestinal inflammation and the gut microbiota in mice using a dextran sulfate sodium (DSS)-induced model. The mice showed no adverse reactions when administered Virofree. Virofree administration reduced the disease activity index as indicated by amelioration of DSS-induced symptoms in the mice, including weight loss, diarrhea, and rectal bleeding. Regarding the gut microbiota, Virofree intervention modulated the DSS-induced decrease in gut microbial diversity; the Virofree group showed no increase in the phyla Proteobacteria or Verrucomicrobia while displaying an increase in the genus Duncaniella, bacteria that may have protective properties. These findings suggest that Virofree may have a direct or indirect impact on the composition of the gut microbiota and that it can alleviate the imbalance of the microbiome and intestinal inflammation caused by DSS treatment.


Conflict of interest statement

The authors declare no competing financial interest.

Figures
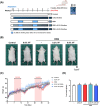
Figure 1
Figure 1
Effects of Virofree on the profile, body weight, and food intake of DSS-induced ICR mice. Mice were fed a normal diet with or without Virofree for 6 weeks. A 2% DSS solution was orally administered in deionized water for two cycles with a 2 week rest between cycles. The control group was given deionized water only. (A) Experimental procedure. (B) Representative photographs of each group of mice after sacrifice. (C) Body weight changes after intervention with 2% DSS in water. (D) Daily food intake. Each bar represents the mean ± SEM (n = 12). p-Values were determined through a one-way ANOVA using Duncan’s multiple comparison test. Values labeled with different letters were significantly distinct (p < 0.05) among groups.
Figure 2
Figure 2
Effects of Virofree on the appearance of organs, weight, and serum biochemical parameters in DSS-induced mice. (A) Representative photographs of organs of mice in each group. The relative weights of the (B) liver, (C) kidney, and (D) spleen. (E) Liver function analyses were carried out with serum. Each bar represents the mean ± SEM (n = 8–12). p-Values were determined through a one-way ANOVA using Duncan’s multiple comparison test. Values labeled with different letters were significantly distinct (p < 0.05) among groups.
Figure 3
Figure 3
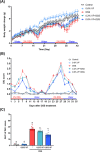
Effects of Virofree on DAI in DSS-induced ICR mice. (A) Body weight change, (B) DAI score, and (C) AUC of DAI score. Each bar represents the mean ± SEM (n = 12). p-Values were determined through a one-way ANOVA using Duncan’s multiple comparison test. Values labeled with different letters were significantly distinct (p < 0.05) among groups.
Figure 4
Figure 4
Effects of Virofree on colon appearances, weight/length ratio, intestinal permeability, and morphology in DSS-induced ICR mice. (A) Macroscopic views of the colon of each group. (B) Colon weight/length ratio in each group. (C) Gut permeability was assessed by measuring the levels of FITC-dextran in serum after oral gavage of 4 kDa FITC-dextran for 2 h. (D) Representative images of H&E staining of the colon tissues. (100× magnification, 200 μm) Each bar represents the mean ± SEM (n = 6–12). p-Values were determined through a one-way ANOVA using Duncan’s multiple comparison test. Values labeled with different letters were significantly distinct (p < 0.05) among groups.
Figure 5
Figure 5
Effects of Virofree on the cytokine content in the colon tissues in DSS-induced ICR mice. The levels of (A) TNF-α and (B) IL-β in colorectal tissues. Each bar represents the mean ± SEM (n = 6–8). p-Values were determined through a one-way ANOVA using Duncan’s multiple comparison test. Values labeled with different letters were significantly distinct (p < 0.05) among groups.
Figure 6
Figure 6
Effects of Virofree on alpha diversity indices of gut microbiota in DSS-induced ICR mice. (A) Shannon’s diversity index, (B) Simpson’s diversity index, (C) Menhinick’s richness index, and (D) Margalef’s richness index. Each box plot represents the median, interquartile range, minimum, and maximum values; n = 3 per group. p-Values were determined through a one-way ANOVA using Duncan’s multiple comparison test. Values labeled with different letters were significantly distinct (p < 0.05) among groups.
Figure 7
Figure 7
Effects of Virofree on the beta diversity of gut microbiota in DSS-induced ICR mice. Gut microbiota composition in feces was analyzed by 16S rRNA gene sequencing analyses (n = 3 for each group). The plots shown were generated using (A) PCA of the correlation matrix and (B) constrained PCoA.
Figure 8
Figure 8
Correlation between gut microbiota and colitis parameters. Distance-based redundancy analysis was used to analyze the correlations at the species level. The lengths of the arrows in the diagram indicate the degree of impact of environmental factors on bacterial species. The angle between arrows represents the correlation between environmental factors, with acute angles indicating a positive correlation and obtuse angles indicating a negative correlation. Gray dots represent species, with the top 10 contributing species names displayed by default. Colored dots represent sample points labeled by the group.

References

    1. Wright E. K.; Ding N. S.; Niewiadomski O. Management of inflammatory bowel disease. Med. J. Aust. 2018, 209 (7), 318–323. 10.5694/mja17.01001. - DOI - PubMed
    1. Xavier R. J.; Podolsky D. K. Unravelling the pathogenesis of inflammatory bowel disease. Nature 2007, 448 (7152), 427–434. 10.1038/nature06005. - DOI - PubMed
    1. Song E. M.; Yang S. K. Natural history of inflammatory bowel disease: a comparison between the East and the West. Intest. Res. 2022, 20 (4), 418–430. 10.5217/ir.2021.00104. - DOI - PMC - PubMed
    1. Ramos G. P.; Papadakis K. A. Mechanisms of disease: Inflammatory bowel diseases. Mayo Clin. Proc. 2019, 94 (1), 155–165. 10.1016/j.mayocp.2018.09.013. - DOI - PMC - PubMed
    1. Bhattacharya A.; Sood P.; Citovsky V. The roles of plant phenolics in defence and communication during Agrobacterium and Rhizobium infection. Mol. Plant Pathol. 2010, 11 (5), 705–719. 10.1111/j.1364-3703.2010.00625.x. - DOI - PMC - PubMed