. 2023 Oct 24;8(44):41835-41843.
doi: 10.1021/acsomega.3c06538. eCollection 2023 Nov 7.

Improved Detection and Quantification of Cyclopropane Fatty Acids via Homonuclear Decoupling Double Irradiation NMR Methods

Affiliations

Improved Detection and Quantification of Cyclopropane Fatty Acids via Homonuclear Decoupling Double Irradiation NMR Methods

Dilek Eltemur et al. ACS Omega. .

Abstract

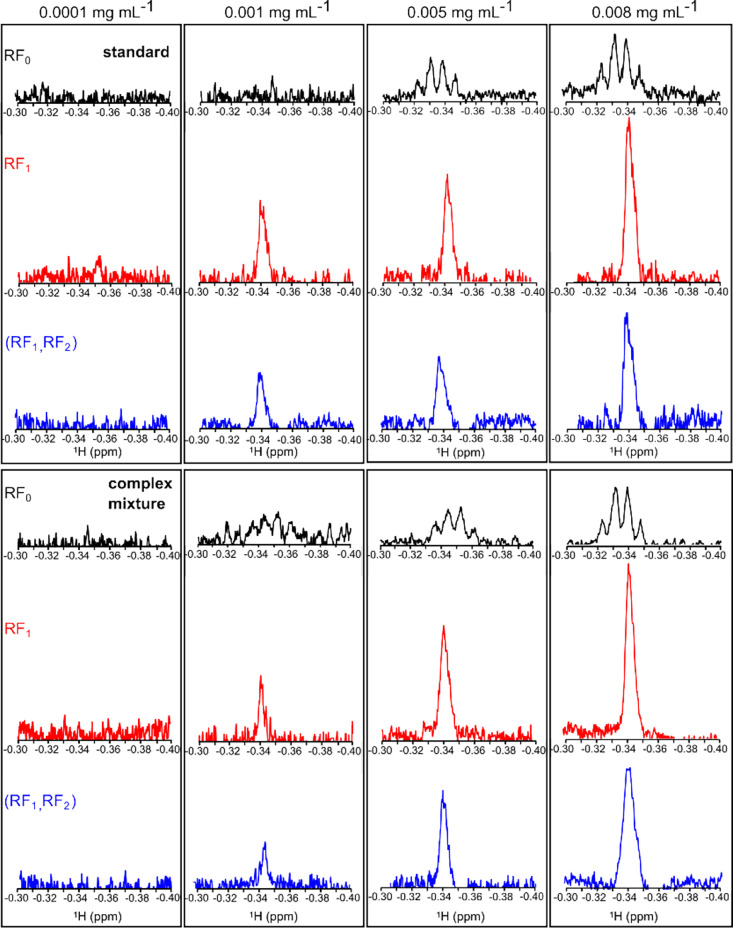
Over the years, NMR spectroscopy has become a powerful analytical tool for the identification and quantification of a variety of natural compounds in a broad range of food matrices. Furthermore, NMR can be useful for characterizing food matrices in terms of quality and authenticity, also allowing for the identification of counterfeits. Although NMR requires minimal sample preparation, this technique suffers from low intrinsic sensitivity relative to complementary techniques; thus, the detection of adulterants or markers for authenticity at low concentrations remains challenging. Here, we present a strategy to overcome this limitation by the introduction of a simple band-selective homonuclear decoupling sequence that consists of double irradiation on 1H during NMR signal acquisition. The utility of the proposed method is tested on dihydrosterculic acid (DHSA), one of the cyclopropane fatty acids (CPFAs) shown to be a powerful molecular marker for authentication of milk products. A quantitative description of how the proposed NMR scheme allows sensitivity enhancement yet accurate quantification of DHSA is provided.


Conflict of interest statement

The authors declare no competing financial interest.

Figures

Figure 1
Figure 1
Effect of the single irradiation RF field (RF1) on the signal intensity of the cis-methylene proton (1Hc) in the cyclopropane ring of dihydrosterculic acid, DHSA. (A) 1H NMR spectrum of DHSA (CDCl3, 600 MHz, 25 °C) in the region from −0.60 to 1.40 ppm and the chemical structure of DHSA with protons of the cyclopropane ring identified as cis and trans by the labels Hc and Ht, respectively. The portion of the spectrum enclosed in the black box (and zoomed in in the upper right part) shows the characteristic quartet signal arising from coupling of 1Hc to three 1Ht in the cyclopropane ring and the corresponding coupling constants (in Hz). (B) Stacked 1H NMR spectra of CHCl3 (black), TMS (black), and 1Hc proton of DHSA (red) as a function of single RF field (RF1) strengths. The arrows near the vertical dotted lines highlight the chemical shifts caused by the Bloch–Siegert effect. (C) Overlay of 1Hc signals obtained at different RF field strengths. Note that signals from TMS and 1Hc in parts B and C were referenced and scaled to the CHCl3 signal, as described in the Experimental Section. All measurements were performed on a 0.60 mg mL–1 (standard) DHSA sample.
Figure 2
Figure 2
Effect of homonuclear decoupling on the quantification of the DHSA molecule. (A) Region of the 1H NMR spectrum of DHSA (CDCl3, 600 MHz, 25 °C) showing the offset of the applied single (RF1, top panel) and double (RF1, RF2, bottom panel) selective RF fields, with ωRF1 and ωRF2 values equal to 0.60 and −0.97 ppm, respectively. Plots of integrated 1Hc DHSA peak areas (referenced to TMS signal) as a function of the applied RF field strengths are shown for (B) “standard” solution (containing only DHSA) and (C) in a complex mixture (DHSA spiked to freeze-dried milk as described in the Experimental Section). Changes in signal areas employing single (RF1) and double (RF1, RF2) selective frequencies are colored red and blue, respectively. All 1Hc DHSA peak areas shown in the plots are normalized to the peak area measured for γB1 = 0 Hz.
Figure 3
Figure 3
Correlation plots comparing predicted (pred) and experimental (exp) DHSA concentrations determined from the integrated area of the cis-methylene proton signal of the cyclopropane ring in 1H NMR spectra. Concentrations of DHSA recast from NMR experiments acquired with single (RF1) and double (RF1, RF2) selective decoupling pulses are colored red and blue, respectively. Concentrations of DHSA obtained from reference experiments without decoupling (RF0) are labeled in black. Measurements were performed on (A) “standard” solution (with only DHSA) and (B) in “complex mixture” (with DHSA dissolved in milk extract as described in the Experimental Section). Slopes and Pearson correlation coefficients (R) are reported in the figures. Measures were performed in triplicate, and error bars are reported in the plots.
Figure 4
Figure 4
Bar graph of the experimental ratios R (= SNRRFi/SNRRF0, with i = 1 or 1,2) measured on the cis-methylene proton signal of the cyclopropane ring in DHSA as a function of the concentration of DHSA in standard solution (upper panel) and in complex mixture (freeze-dried milk spiked with DHSA, lower panel). Rs values obtained from decoupled NMR experiments acquired with single (RF1) and double (RF1, RF2) selective pulses are shown as red and blue bars, respectively. Red and blue dotted lines in both panels indicate the average SNRRFi/SNRRF0 values, respectively. NMR signal and noise were extracted as described in the Experimental Section. NMR analyses were carried out in triplicate for each experiment.
Figure 5
Figure 5
Improved detection of cis-methylene proton, 1Hc signal from DHSA by employing single (RF1) and double (RF1, RF2) selective pulses. NMR experiments acquired on four different concentrations of DHSA (0.0001, 0.001, 0.005, and 0.008 mg mL–1) without decoupling (RF0), with a single (RF1) selective decoupling pulse and with the double-pulse (RF1, RF2) scheme are shown in black, red, and blue, respectively. Data obtained for the DHSA standard solution and in complex mixture are shown in the upper and lower panel, respectively. Correct comparison of DHSA signal intensities was achieved by using the CHCl3 signal as reference, as described in the Experimental Section.

Similar articles

References

    1. Ortea I.; O’Connor G.; Maquet A. Review on Proteomics for Food Authentication. J. Proteomics 2016, 147, 212–225. 10.1016/j.jprot.2016.06.033. - DOI - PubMed
    1. Sobolev A. P.; Thomas F.; Donarski J.; Ingallina C.; Circi S.; Cesare Marincola F.; Capitani D.; Mannina L. Use of NMR Applications to Tackle Future Food Fraud Issues. Trends Food Sci. Technol. 2019, 91, 347–353. 10.1016/j.tifs.2019.07.035. - DOI
    1. Lytou A. E.; Panagou E. Z.; Nychas G.-J. E. Volatilomics for Food Quality and Authentication. Curr. Opin. Food Sci. 2019, 28, 88–95. 10.1016/j.cofs.2019.10.003. - DOI
    1. Román S.; Sánchez-Siles L. M.; Siegrist M. The Importance of Food Naturalness for Consumers: Results of a Systematic Review. Trends Food Sci. Technol. 2017, 67, 44–57. 10.1016/j.tifs.2017.06.010. - DOI
    1. Petrescu D. C.; Vermeir I.; Petrescu-Mag R. M. Consumer Understanding of Food Quality, Healthiness, and Environmental Impact: A Cross-National Perspective. Int. J. Environ. Res. Public Health 2020, 17 (1), 169.10.3390/ijerph17010169. - DOI - PMC - PubMed