. 2023 Nov 16:12:e85700.
doi: 10.7554/eLife.85700.

A single-cell atlas depicting the cellular and molecular features in human anterior cruciate ligamental degeneration: A single cell combined spatial transcriptomics study

Affiliations

A single-cell atlas depicting the cellular and molecular features in human anterior cruciate ligamental degeneration: A single cell combined spatial transcriptomics study

Runze Yang et al. Elife. .

Abstract

Background: To systematically identify cell types in the human ligament, investigate how ligamental cell identities, functions, and interactions participated in the process of ligamental degeneration, and explore the changes of ligamental microenvironment homeostasis in the disease progression.

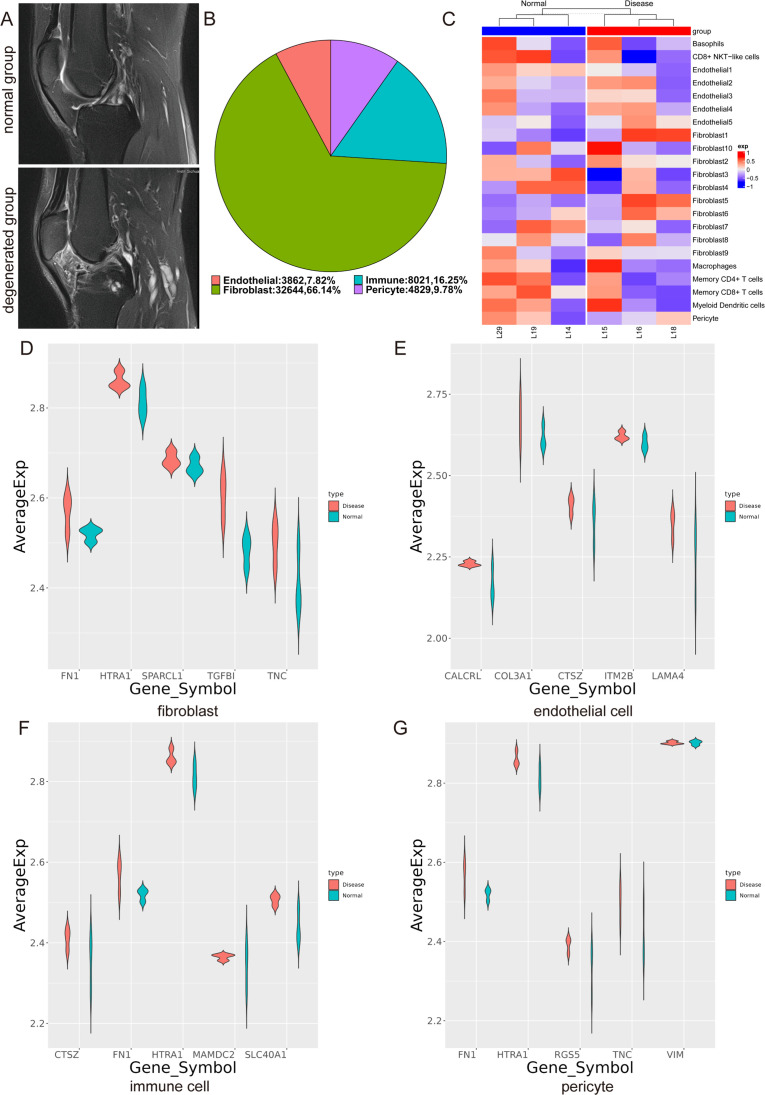
Methods: Using single-cell RNA sequencing and spatial RNA sequencing of approximately 49,356 cells, we created a comprehensive cell atlas of healthy and degenerated human anterior cruciate ligaments. We explored the variations of the cell subtypes' spatial distributions and the different processes involved in the disease progression, linked them with the ligamental degeneration process using computational analysis, and verified findings with immunohistochemical and immunofluorescent staining.

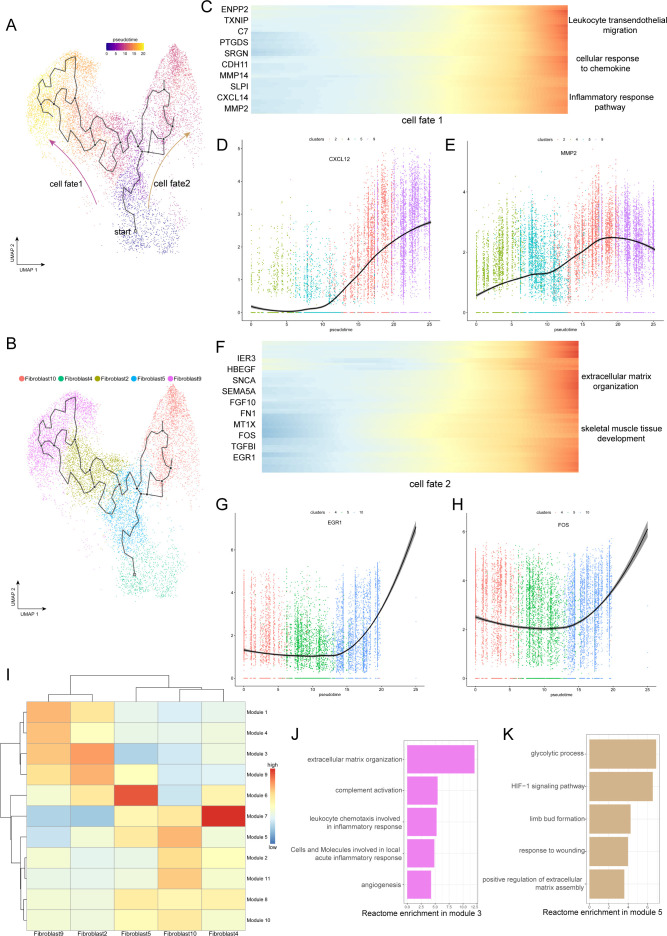
Results: We identified new fibroblast subgroups that contributed to the disease, mapped out their spatial distribution in the tissue and revealed two dynamic trajectories in the process of the degenerative process. We compared the cellular interactions between different tissue states and identified important signaling pathways that may contribute to the disease.

Conclusions: This cell atlas provides the molecular foundation for investigating how ligamental cell identities, biochemical functions, and interactions contributed to the ligamental degeneration process. The discoveries revealed the pathogenesis of ligamental degeneration at the single-cell and spatial level, which is characterized by extracellular matrix remodeling. Our results provide new insights into the control of ligamental degeneration and potential clues to developing novel diagnostic and therapeutic strategies.

Funding: This study was funded by the National Natural Science Foundation of China (81972123, 82172508, 82372490) and 1.3.5 Project for Disciplines of Excellence of West China Hospital Sichuan University (ZYJC21030, ZY2017301).

Keywords: extracellular matrix remodeling; human; ligamental degeneration; medicine; single-cell RNA-seq; spatial RNA-seq.


Conflict of interest statement

RY, TX, LZ, MG, LY, JL, WF No competing interests declared

Figures

Figure 1.
Figure 1.. Single-cell RNA-seq reveals major cell classes in human ligament.
(A and B) A photograph of typical normal (left) and degenerated (right) anterior cruciate ligaments (ACL) under arthroscopy. (C) UMAP visualization of all cell clusters in collected ligamental specimens. (D and E) UMAP visualization of the donor origins in normal/diseased samples. (F) Heatmap of selected marker genes in each cell cluster. (G) The percentages of the identified cell classes in normal/diseased ligament. (H) Number of differentially expressed genes (DEGs) in each cell type of normal/diseased status. (I) Feature plots of expression distribution for selected cluster-specific genes. Brighter colors indicate higher expression levels. (J) Gene expression profiles from bulk samples (n=6) and in single cell samples (n=8) were averaged and plotted on X and Y axes, respectively. Red lines indicate linear model fit and the diagonal. (K) Correlation heatmap shows Pearson’s correlation between all bulk and in single cell samples. (L) Consistency analysis of Degs between normal and diseased groups in single cell and bulk RNA sequencing data.
Figure 1—figure supplement 1.
Figure 1—figure supplement 1.. The overall workflow of our research programme.
Figure 1—figure supplement 2.
Figure 1—figure supplement 2.. Typical MRI images of different types of ligaments and consistency analysis between single cell and bulk RNA sequencing data.
(A) MRI Photographs of typical normal and degenerated ACLs. (B) The proportion of each cell type. (C) GSVA analysis of the top 50 genes of each subpopulation identified by scRNA-seq in bulk RNA sequencing. (D–G) Through Degs analysis, five genes highly expressed in the diseased group of four cell clusters (fibroblast, endothelial cell, immune cell, pericyte) in the scRNA-seq data were selected, and then the expression differences of these genes were detected in the diseased and normal samples of bulk RNA-seq data.
Figure 2.
Figure 2.. Characterization of fibroblast subclusters across different statuses in human ACL.
(A) UMAP visualization of the subclusters of fibroblasts. (B) UMAP visualization of the distribution of fibroblast subclusters at different samples. (C) The proportions of 10 fibroblast subpopulations in normal and diseased ligaments. (D) A cell-level heatmap reveals the normalized expression of DEGs for each fibroblast cluster defined in. (E) Volcano plot showing the DEGs between two statues of ligamental fibroblasts. The x axis represents highly expressed genes in normal cells, and the y axis represents highly expressed genes in diseased cells. (F) GO and KEGG enrichment analysis of DEGs in ligamental fibroblasts between normal and degenerated states. (G) GSEA enrichment plots for representative signaling pathways upregulated in fibroblasts of diseased samples, compared with normal samples. (H) Gene-gene interaction networks between DEGs in ligamental fibroblasts of normal group and fibroblasts of diseased group.
Figure 3.
Figure 3.. Evolution trajectory and transcriptional fluctuation during ligamental degeneration progression.
(A and B) UMAP visualization of fibroblast 2, 4, 5, 9, 10. Developmental pseudotime for cells present along the trajectory inferred by Monocle 3, with cell fate1 and cell fate2 branches coming from fibroblast 4. (C) Heatmap showing the expression changes of the highly variable genes along the cell fate1 in normal and degenerated groups. (D and E) Representative gene expression levels along cell fate1 trajectory of normal and diseased statuses. (F) Heatmap showing the expression changes of the highly variable genes along the cell fate2 in normal and degenerated groups. (G and H) Representative gene expression levels along cell fate2 trajectory of normal and diseased statuses. (I) Heatmap showing the scaled mean expression of modules of coregulated genes grouped by Louvain community analysis across the subclusters. (J and K) Enrichment analysis results of Module 3 and 5.
Figure 4.
Figure 4.. Identification of blood vessel derived cell and immune cell subclusters in human ligament.
(A) UMAP visualization of the subclusters of endothelial cell and pericyte. (B) UMAP visualization of the distribution of endothelial cell and pericyte subclusters at different sample statuses. (C and D) Summarized subpopulations of endothelial cell and pericyte percentage changes. (E) Volcano plots displaying the DEGs in endothelial cell between normal group and diseased group. Each dot represented one gene. Red dots, differentially up-regulated genes; blue dots, differentially down-regulated genes; gray dot, non-differentially expressed genes. (F) GSEA enrichment plots for representative signaling pathways upregulated in endothelial cell of diseased samples, compared with normal samples. (G) Violin plots showing representative marker genes associated with different types of pericyte expressed in pericyte1 and pericyte2. (H) GO and KEGG enrichment analysis of DEGs between normal and diseased endothelial cells. (I and J) Immunofluorescence staining of pericyte related markers in normal and diseased groups. (K) UMAP visualization of the subclusters of immune cell and the distribution of immune cell subclusters at different sample statuses. (L) The proportion of each subcluster of immune cells in the lesioned and normal ligament. (M) Summarized subpopulations of immune cell percentage changes. (N) Violin plots showing representative genes of macrophages between normal and degenerated states. (O) GO and KEGG enrichment analysis of DEGs between normal and diseased macrophages.
Figure 4—figure supplement 1.
Figure 4—figure supplement 1.. Immunofluorescence staining of ACTA2, CD90, and MYH11 in normal and degenerated ACLs.
Figure 5.
Figure 5.. Cell–cell crosstalk during ligamental degeneration progression.
(A) Heatmap depicting the significant interactions among the identified subclusters of fibroblast, immune cell, and endothelial cell of normal and degenerated ligaments. (B and C) Circle plots showing the inferred TGF-β and FGF signaling networks. (D and E) Violin plots showing ligand-receptor interactions related to TGF-β and FGF signaling pathways among subclusters of fibroblast, endothelial cell and immune cell. (F) Immunofluorescent staining of TGFβ1, TOP2A, APOE, and FGF7 in normal and diseased groups.
Figure 5—figure supplement 1.
Figure 5—figure supplement 1.. Immunofluorescence staining of FGF7, APOE, TGFB1, and TOP2A in normal and degenerated ACLs.
Figure 6.
Figure 6.. Spatial transcriptome sequencing deciphers the microenvironment changes during ligamental degeneration progression.
(A–D) Spatial heatmaps showing the representative normal and degenerated fibroblast subcluster distribution in L1 and L8 samples. (E and F) Spatial heatmaps showing the immune cells distribution in normal and degenerated ligamental samples. (G) Quantitative analysis of immune cells in these two types of tissues. (H and I) Spatial heatmaps showing the endothelial cells distribution in normal and degenerated ligamental samples. (J) Quantitative analysis of endothelial cells in these two types of tissues. (K and L) Spot light showing fibroblast subpopulation unique to diseased samples proportion in L1 and L8 samples.
Figure 6—figure supplement 1.
Figure 6—figure supplement 1.. Expression data of FGF7 and TGFβ ligand and receptor genes in the spatial transcriptomes.

Update of

  • doi: 10.1101/2023.01.05.23284219

References

    1. Armulik A, Genové G, Betsholtz C. Pericytes: developmental, physiological, and pathological perspectives, problems, and promises. Developmental Cell. 2011;21:193–215. doi: 10.1016/j.devcel.2011.07.001. - DOI - PubMed
    1. Busch C, Girke G, Kohl B, Stoll C, Lemke M, Krasnici S, Ertel W, Silawal S, John T, Schulze-Tanzil G. Complement gene expression is regulated by pro-inflammatory cytokines and the anaphylatoxin C3a in human tenocytes. Molecular Immunology. 2013;53:363–373. doi: 10.1016/j.molimm.2012.09.001. - DOI - PubMed
    1. Cao J, Spielmann M, Qiu X, Huang X, Ibrahim DM, Hill AJ, Zhang F, Mundlos S, Christiansen L, Steemers FJ, Trapnell C, Shendure J. The single-cell transcriptional landscape of mammalian organogenesis. Nature. 2019;566:496–502. doi: 10.1038/s41586-019-0969-x. - DOI - PMC - PubMed
    1. Corps AN, Robinson AHN, Movin T, Costa ML, Hazleman BL, Riley GP. Increased expression of aggrecan and biglycan mRNA in Achilles tendinopathy. Rheumatology. 2006;45:291–294. doi: 10.1093/rheumatology/kei152. - DOI - PubMed
    1. Ferrão PM, Nisimura LM, Moreira OC, Land MG, Pereira MC, Mendonça-Lima L, Araujo-Jorge TC, Waghabi MC, Garzoni LR. Inhibition of TGF-β pathway reverts extracellular matrix remodeling in T. cruzi-infected cardiac spheroids. Experimental Cell Research. 2018;362:260–267. doi: 10.1016/j.yexcr.2017.11.026. - DOI - PubMed